Springfield, PA (Pennsylvania) Houses and Residents
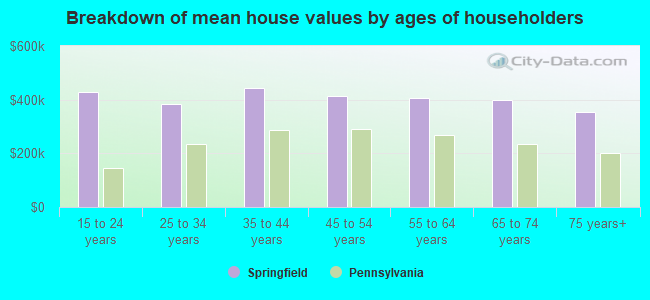
| Springfield: | $403,840 |
| Pennsylvania: | $245,500 |
Total population: 23,802 (Urban population: 23,677, Rural population: 0)
Houses: 8,800 (8,618 occupied: 7,955 owner occupied, 663 renter occupied)
| % of renters here: | 8% |
| State: | 31% |
Housing density: 1,384 houses/condos per square mile
Median price asked for vacant for-sale houses and condos in 2022 in this county: $246,679.
Median contract rent in 2022: $1,292 (lower quartile is $1,154, upper quartile is $1,563)
Median rent asked for vacant for-rent units in 2022: $1,271
Median gross rent in Springfield, PA in 2022: $1,451
Housing units in Springfield with a mortgage: 4,687 (417 second mortgage, 910 home equity loan, 14 both second mortgage and home equity loan)
Houses without a mortgage: 3,024
Compare current foreclosures near Springfield, PA:
| Photo | Address | Area | Beds / Baths | Price | Details |
|---|---|---|---|---|---|

|
#1
Beechwood Rd
Springfield, PA 19064
|
1,380 sq. feet
|
1 baths 3 beds |
show details | |

|
#2
Kerr Ln
Springfield, PA 19064
|
- sq. feet
|
2 baths 3 beds |
show details | |

|
#3
Orchard Rd
Springfield, PA 19064
|
- sq. feet
|
2 baths 3 beds |
show details | |

|
#4
W Sproul Rd
Springfield, PA 19064
|
- sq. feet
|
4 baths 4 beds |
show details | |

|
#5
School Ln
Springfield, PA 19064
|
- sq. feet
|
1 baths 4 beds |
show details | |

|
#6
N Rolling Rd
Springfield, PA 19064
|
- sq. feet
|
2 baths 4 beds |
show details | |

|
#7
Gleaves Rd
Springfield, PA 19064
|
- sq. feet
|
1 baths 3 beds |
show details | |

|
#8
Timber Trail Ln
Springfield, PA 19064
|
- sq. feet
|
2 baths 4 beds |
show details | |

|
#9
Larchwood Rd
Springfield, PA 19064
|
- sq. feet
|
1 baths 3 beds |
show details | |

|
#10
Andrew Rd
Springfield, PA 19064
|
- sq. feet
|
2 baths 3 beds |
show details |
| Photo | Address | Area | Beds / Baths | Price | Details |
|---|---|---|---|---|---|

|
#11
Andrew Rd
Springfield, PA 19064
|
- sq. feet
|
2 baths 3 beds |
show details | |

|
#12
School Ln
Springfield, PA 19064
|
- sq. feet
|
1 baths 4 beds |
show details | |

|
#13
Rambling Way
Springfield, PA 19064
|
- sq. feet
|
1 baths 3 beds |
show details | |

|
#14
Wayne Ave
Springfield, PA 19064
|
- sq. feet
|
2 baths 4 beds |
show details | |

|
#15
E Springfield Rd
Springfield, PA 19064
|
- sq. feet
|
1 baths 3 beds |
show details | |

|
#16
E Springfield Rd
Springfield, PA 19064
|
- sq. feet
|
2 baths 5 beds |
show details | |

|
#17
W Oakdale Street
Philadelphia, PA 19132
|
1,152 sq. feet
|
2 baths 3 beds |
$108,900
|
show details |

|
#18
Jessamine Ave
Oaklyn, NJ 08107
|
864 sq. feet
|
2 baths 5 beds |
$399,900
|
show details |

|
#19
Yeadon Ave
Lansdowne, PA 19050
|
1,388 sq. feet
|
1 baths 3 beds |
$273,000
|
show details |

|
#20
Browning Rd
Merchantville, NJ 08109
|
2,376 sq. feet
|
3 baths 5 beds |
$489,900
|
show details |
| Photo | Address | Area | Beds / Baths | Price | Details |
|---|---|---|---|---|---|

|
#21
N 5th St
Philadelphia, PA 19126
|
1,420 sq. feet
|
2 baths 3 beds |
$313,900
|
show details |

|
#22
Edgewood Ave
Audubon, NJ 08106
|
1,250 sq. feet
|
1 baths 4 beds |
$375,000
|
show details |

|
#23
N Parkview Dr
Norristown, PA 19403
|
2,602 sq. feet
|
2 baths 4 beds |
$240,000
|
show details |

|
#24
Kershaw St
Philadelphia, PA 19131
|
1,284 sq. feet
|
1 baths 3 beds |
$139,900
|
show details |

|
#25
N Norman Ave
Penns Grove, NJ 08069
|
882 sq. feet
|
1 baths 2 beds |
$74,900
|
show details |

|
#26
N Pine St
Wilmington, DE 19802
|
1,125 sq. feet
|
1 baths 3 beds |
$199,900
|
show details |

|
#27
S 8th St
Philadelphia, PA 19148
|
1,170 sq. feet
|
1 baths 3 beds |
$178,500
|
show details |

|
#28
N 59th St
Philadelphia, PA 19151
|
1,244 sq. feet
|
1 baths 3 beds |
$241,500
|
show details |

|
#29
Mockingbird Ln
Swedesboro, NJ 08085
|
2,076 sq. feet
|
2 baths 4 beds |
$429,900
|
show details |

|
#30
W Olney Ave
Philadelphia, PA 19120
|
1,782 sq. feet
|
2 baths 4 beds |
$112,500
|
show details |
| Photo | Address | Area | Beds / Baths | Price | Details |
|---|---|---|---|---|---|

|
#31
Manchester Rd
Elkins Park, PA 19027
|
3,444 sq. feet
|
2 baths 3 beds |
$559,900
|
show details |

|
#32
Broadway
Westville, NJ 08093
|
1,548 sq. feet
|
1 baths 3 beds |
$259,900
|
show details |

|
#33
Edwards Ave
Barrington, NJ 08007
|
1,112 sq. feet
|
1 baths 3 beds |
$325,500
|
show details |

|
#34
Christian St
Philadelphia, PA 19146
|
1,612 sq. feet
|
2 baths 5 beds |
$449,900
|
show details |

|
#35
N Front St Apt B
Philadelphia, PA 19123
|
2,491 sq. feet
|
2 baths 3 beds |
$659,500
|
show details |

|
#36
Ashbourne Rd
Elkins Park, PA 19027
|
3,104 sq. feet
|
3 baths 6 beds |
$154,500
|
show details |

|
#37
Cooper St
Woodbury, NJ 08096
|
936 sq. feet
|
1 baths 3 beds |
$255,000
|
show details |

|
#38
Harvey Ave
Pennsauken, NJ 08110
|
1,555 sq. feet
|
2 baths 4 beds |
$415,000
|
show details |

|
#39
Glen Ave
West Chester, PA 19382
|
1,240 sq. feet
|
1 baths 3 beds |
$218,966
|
show details |

|
#40
Pickering St
Philadelphia, PA 19150
|
1,170 sq. feet
|
1 baths 3 beds |
$169,900
|
show details |
| Photo | Address | Area | Beds / Baths | Price | Details |
|---|---|---|---|---|---|

|
#41
Woodside Ave
Berwyn, PA 19312
|
2,080 sq. feet
|
2 baths 5 beds |
$525,082
|
show details |

|
#42
N 21st St
Philadelphia, PA 19138
|
1,302 sq. feet
|
1 baths 3 beds |
$86,709
|
show details |

|
#43
Stirling Ct
West Chester, PA 19380
|
1,050 sq. feet
|
1 baths 2 beds |
$30,983
|
show details |

|
#44
Richmond Rd
Paoli, PA 19301
|
1,215 sq. feet
|
1 baths 2 beds |
$263,438
|
show details |

|
#45
E Strasburg Rd
West Chester, PA 19380
|
4,204 sq. feet
|
3 baths 3 beds |
$668,955
|
show details |

|
#46
Oxford Rd
West Chester, PA 19380
|
2,116 sq. feet
|
2 baths 4 beds |
$173,254
|
show details |

|
#47
S 19th St
Philadelphia, PA 19145
|
1,544 sq. feet
|
1 baths 4 beds |
$75,082
|
show details |

|
#48
Hamilton St
Swedesboro, NJ 08085
|
- sq. feet
|
1 baths 3 beds |
$260,000
|
show details |

|
#49
E Wishart St
Philadelphia, PA 19134
|
1,064 sq. feet
|
1 baths 3 beds |
$1,290,613
|
show details |

|
Check over 1 million property listings on Foreclosure.com!
|
browse all offers | |||
Latest news about housing in Springfield, PA collected exclusively by city-data.com from local newspapers, TV, and radio stations

 | Where to vacation rent (3 replies) |
| Suburban or Rural homes near PHL with good high school? (20 replies) |
| PA Republicans bucking party to endorse Democrat Josh Shapiro for governor (284 replies) |
| Could Springfield, PA be the one? Advice please. (98 replies) |
| Delaware County by Median Household Income... Interesting (17 replies) |
| House rentals - Springfield PA to Wilmington DE (2 replies) |

Household type by relationship:
Households: 535,924- In family households: 453,586 (91,569 male householders, 48,290 female householders)
99,383 spouses, 170,789 children (161,642 natural, 3,823 adopted, 5,324 stepchildren), 11,365 grandchildren, 5,918 brothers or sisters, 5,812 parents, foster children, 6,644 other relatives, 10,420 non-relatives
- In nonfamily households: 82,338 (29,827 male householders (23,777 living alone)), 39,014 female householders (33,920 living alone)), 13,497 nonrelatives
- In group quarters: 23,055 (7,828 institutionalized population)
94,926 married couples with children.
28,980 single-parent households (5,380 men, 23,600 women).
92.6% of residents of Springfield speak English at home.
1.2% of residents speak Spanish at home (63% speak English very well, 14% speak English well, 23% speak English not well).
4.6% of residents speak other Indo-European language at home (70% speak English very well, 26% speak English well, 4% speak English not well).
1.3% of residents speak Asian or Pacific Island language at home (53% speak English very well, 31% speak English well, 15% speak English not well, 1% don't speak English at all).
0.3% of residents speak other language at home (90% speak English very well, 10% speak English well).
Foreign born population: 1,650 (6.7%)
(95.0% of them are naturalized citizens)
| Here: | 8.2 |
| State: | 6.8 |
| Here: | 5.5 |
| State: | 4.3 |
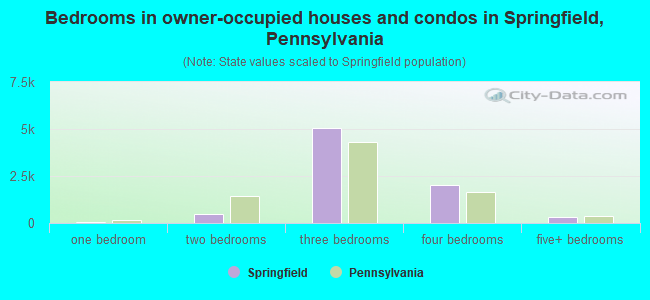
- Bedrooms in owner-occupied houses and condos in Springfield, Pennsylvania
- 0no bedroom
- 631 bedroom
- 4682 bedrooms
- 5,0513 bedrooms
- 2,0464 bedrooms
- 3275+ bedrooms
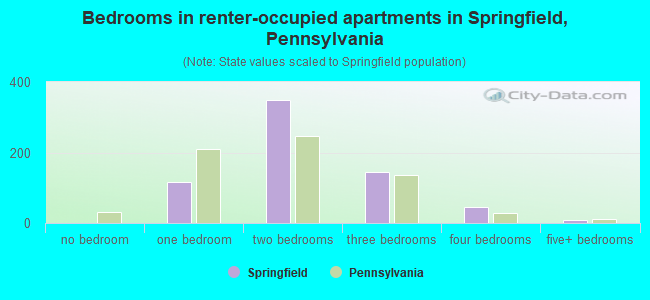
- Bedrooms in renter-occupied apartments in Springfield, Pennsylvania
- 0no bedroom
- 1161 bedroom
- 3502 bedrooms
- 1443 bedrooms
- 454 bedrooms
- 85+ bedrooms
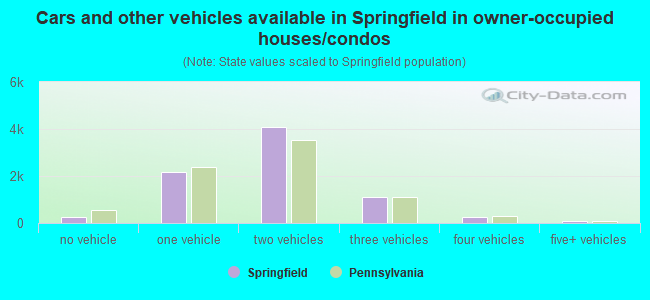
- Cars and other vehicles available in Springfield in owner-occupied houses/condos
- 261no vehicle
- 2,1871 vehicle
- 4,0942 vehicles
- 1,0883 vehicles
- 2544 vehicles
- 715+ vehicles
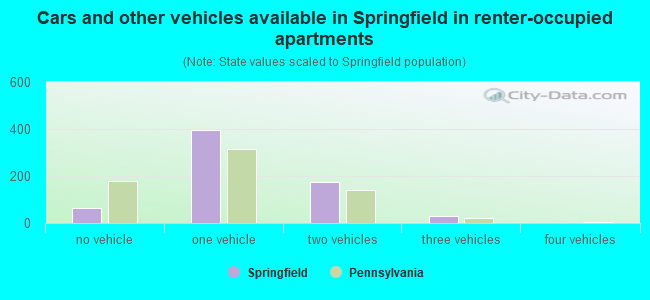
- Cars and other vehicles available in Springfield in renter-occupied apartments
- 63no vehicle
- 3951 vehicle
- 1762 vehicles
- 293 vehicles
- 04 vehicles
- 05+ vehicles
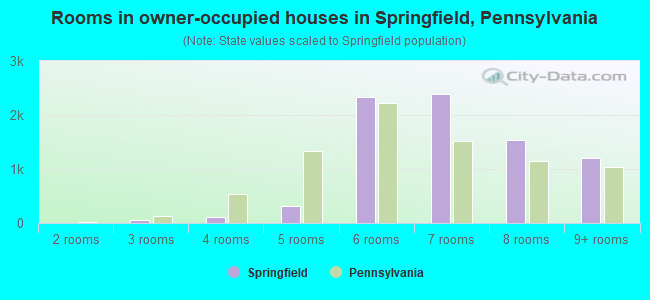
- Rooms in owner-occupied houses in Springfield, Pennsylvania
- 01 room
- 02 rooms
- 553 rooms
- 1104 rooms
- 3105 rooms
- 2,3336 rooms
- 2,3937 rooms
- 1,5468 rooms
- 1,2089+ rooms
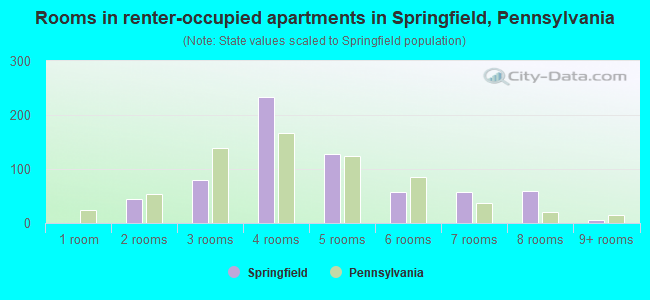
- Rooms in renter-occupied apartments in Springfield, Pennsylvania
- 01 room
- 442 rooms
- 793 rooms
- 2344 rooms
- 1275 rooms
- 586 rooms
- 577 rooms
- 598 rooms
- 59+ rooms
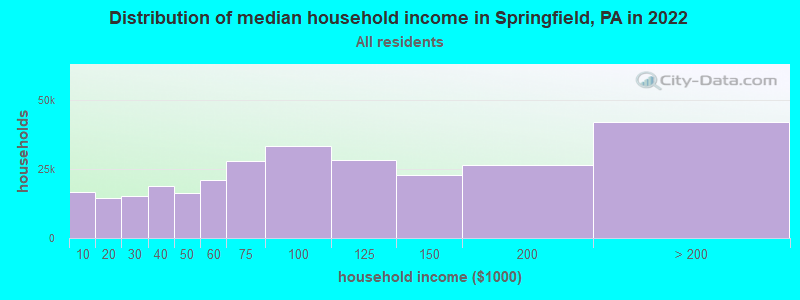
Springfield, PA household income distribution

- 16,624Less than $10,000
- 14,366$10,000 to $19,999
- 15,249$20,000 to $29,999
- 18,778$30,000 to $39,999
- 16,487$40,000 to $49,999
- 21,014$50,000 to $59,999
- 27,897$60,000 to $74,999
- 33,600$75,000 to $99,999
- 28,528$100,000 to $124,999
- 22,819$125,000 to $149,999
- 26,671$150,000 to $199,999
- 42,171$200,000 or more
Percentage of workers working in this county: 63.1%
Number of people working at home: 2,101 (16.9% of all workers)
Travel time to work (commute)
- Less than 5 minutes: 238
- 5 to 9 minutes: 1,024
- 10 to 14 minutes: 1,240
- 15 to 19 minutes: 1,441
- 20 to 24 minutes: 1,429
- 25 to 29 minutes: 675
- 30 to 34 minutes: 1,672
- 35 to 39 minutes: 509
- 40 to 44 minutes: 659
- 45 to 59 minutes: 1,313
- 60 to 89 minutes: 494
- 90 or more minutes: 151
Means of transportation to work:
- Drove a car alone: 9,221 (82.1%)
- Carpooled: 880 (7.8%)
- Bus or trolley bus: 100 (0.9%)
- Streetcar or trolley car: 22 (0.2%)
- Subway or elevated: 152 (1.4%)
- Railroad: 261 (2.3%)
- Bicycle: 16 (0.1%)
- Walked: 171 (1.5%)
- Other means: 22 (0.2%)
- Worked at home: 381 (3.4%)
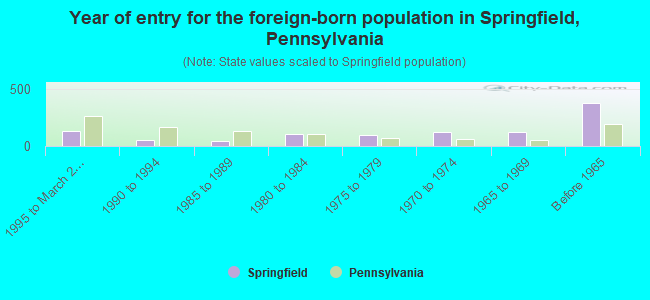
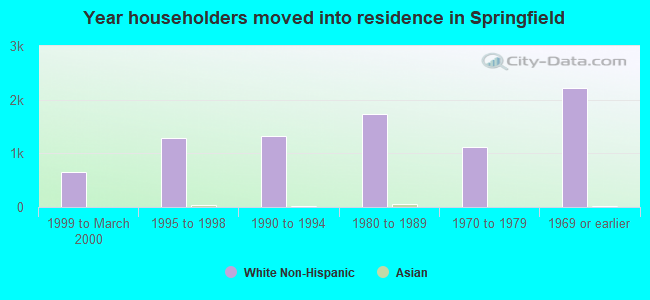
- Year of entry for the foreign-born population in Springfield, Pennsylvania
- 1341995 to March 2000
- 491990 to 1994
- 451985 to 1989
- 1041980 to 1984
- 981975 to 1979
- 1261970 to 1974
- 1201965 to 1969
- 373Before 1965
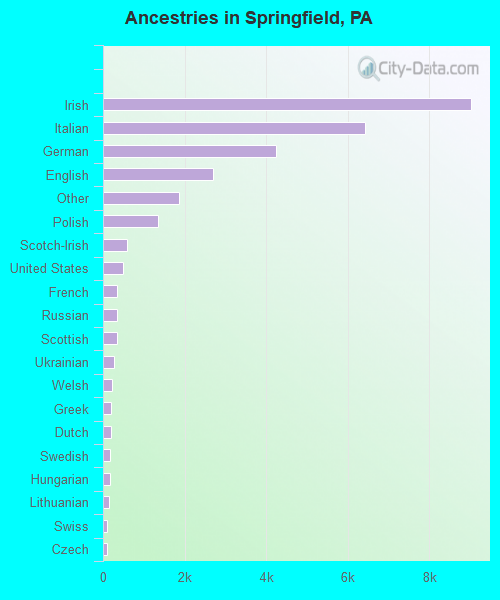
First ancestries reported:
- Irish: 9,008 (30.5%)
- Italian: 6,424 (21.7%)
- German: 4,232 (14.3%)
- English: 2,685 (9.1%)
- Other: 1,859 (6.3%)
- Polish: 1,345 (4.5%)
- Scotch-Irish: 590 (2.0%)
- United States: 498 (1.7%)
- French: 340 (1.1%)
- Russian: 339 (1.1%)
- Scottish: 337 (1.1%)
- Ukrainian: 258 (0.9%)
- Welsh: 226 (0.8%)
- Greek: 202 (0.7%)
- Dutch: 194 (0.7%)
- Swedish: 181 (0.6%)
- Hungarian: 162 (0.5%)
- Lithuanian: 138 (0.5%)
- Swiss: 108 (0.4%)
- Czech: 93 (0.3%)
- Slovak: 81 (0.3%)
- Subsaharan African: 61 (0.2%)
- Norwegian: 54 (0.2%)
- Danish: 53 (0.2%)
- French Canadian: 53 (0.2%)
- Portuguese: 42 (0.1%)
- West Indian: 5 (0.02%)
Most common places of birth for foreign-born residents (%):
| Springfield: | 12.4% (130) |
| Pennsylvania: | 6.0% (30,559) |
| Springfield: | 10.6% (111) |
| Pennsylvania: | 7.4% (37,541) |
| Springfield: | 10.2% (107) |
| Pennsylvania: | 5.3% (26,703) |
| Springfield: | 5.4% (57) |
| Pennsylvania: | 3.0% (15,200) |
| Springfield: | 4.4% (46) |
| Pennsylvania: | 4.6% (23,171) |
| Springfield: | 3.9% (41) |
| Pennsylvania: | 0.8% (4,181) |
| Springfield: | 3.9% (41) |
| Pennsylvania: | 4.6% (23,478) |
| Springfield: | 3.2% (34) |
| Pennsylvania: | 0.6% (2,828) |
| Springfield: | 3.1% (33) |
| Pennsylvania: | 1.4% (7,362) |
| Springfield: | 3.1% (32) |
| Pennsylvania: | 0.8% (3,975) |
| Springfield: | 2.8% (29) |
| Pennsylvania: | 0.7% (3,762) |
| Springfield: | 2.8% (29) |
| Pennsylvania: | 0.4% (1,888) |
| Springfield: | 2.4% (25) |
| Pennsylvania: | 0.7% (3,475) |
| Springfield: | 2.4% (25) |
| Pennsylvania: | 1.3% (6,687) |
| Springfield: | 2.2% (23) |
| Pennsylvania: | 2.3% (11,916) |
| Springfield: | 1.9% (20) |
| Pennsylvania: | 3.3% (16,897) |
| Springfield: | 1.9% (20) |
| Pennsylvania: | 1.2% (5,852) |
| Springfield: | 1.9% (20) |
| Pennsylvania: | 0.6% (2,934) |
| Springfield: | 1.9% (20) |
| Pennsylvania: | 0.5% (2,767) |
| Springfield: | 1.6% (17) |
| Pennsylvania: | 5.1% (25,685) |
| Springfield: | 1.6% (17) |
| Pennsylvania: | 0.4% (2,265) |
| Springfield: | 1.6% (17) |
| Pennsylvania: | 4.8% (24,232) |
| Springfield: | 1.5% (16) |
| Pennsylvania: | 0.8% (4,274) |
Place of birth for U.S.-born residents:
- This state: 20,047
- Other state: 2,482
- Northeast: 1,204
- Midwest: 393
- South: 693
- West: 192
77% of Springfield residents lived in the same house 5 years ago.
Out of people who lived in different houses, 72% lived in this county.
Out of people who lived in different counties, 64% lived in Pennsylvania.
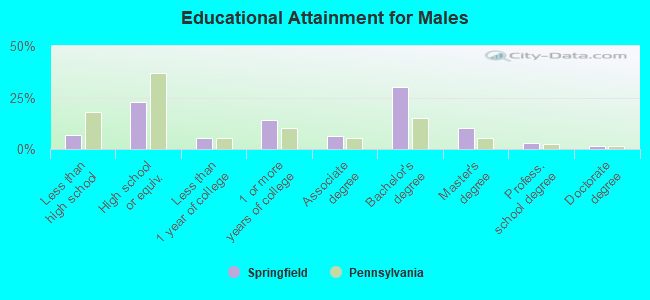
Education attainment for males 25 years and older:
- No schooling: 28
- Nursery to 4th grade: 12
- 5th and 6th grade: 29
- 7th and 8th grade: 78
- 9th grade: 41
- 10th grade: 130
- 11th grade: 71
- 12th grade, no diploma: 121
- High school graduate (or equivalency): 1,766
- Less than 1 year of college: 410
- Some college more than 1 year, no degree: 1,098
- Associate degree: 480
- Bachelor's degree: 2,310
- Master's degree: 766
- Professional school degree: 229
- Doctorate degree: 115
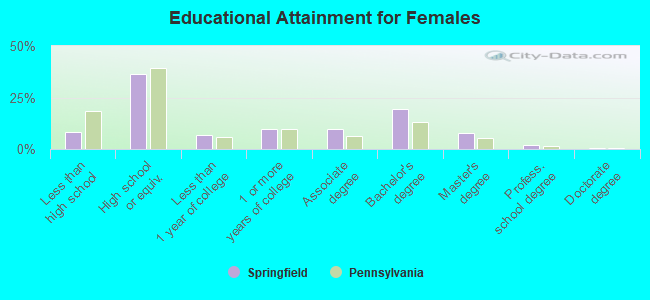
Education attainment for females 25 years and older:
- No schooling: 5
- Nursery to 4th grade: 26
- 5th and 6th grade: 18
- 7th and 8th grade: 112
- 9th grade: 95
- 10th grade: 127
- 11th grade: 135
- 12th grade, no diploma: 214
- High school graduate (or equivalency): 3,223
- Less than 1 year of college: 614
- Some college more than 1 year, no degree: 840
- Associate degree: 840
- Bachelor's degree: 1,727
- Master's degree: 698
- Professional school degree: 151
- Doctorate degree: 27


Housing units in structures:
- One, detached: 7,536
- One, attached: 673
- Two: 25
- 3 or 4: 390
- 5 to 9: 45
- 10 to 19: 7
- 20 to 49: 20
- 50 or more: 97
- Mobile homes: 7
Median worth of mobile homes: $198,134
Housing units lacking complete kitchen facilities: 0.2%
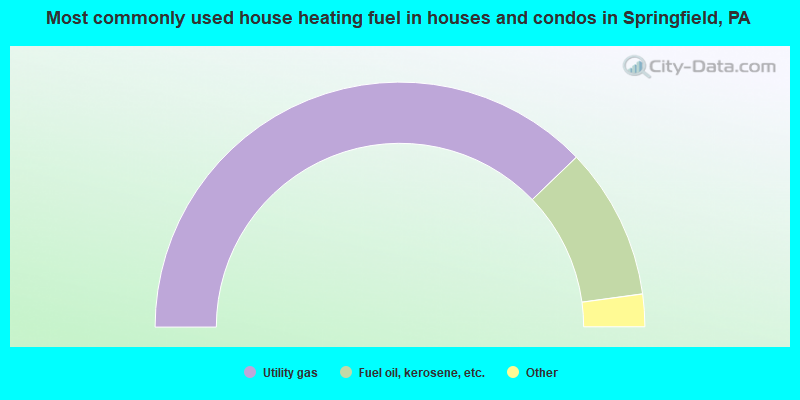
- 75.7%Utility gas
- 20.1%Fuel oil, kerosene, etc.
- 3.7%Electricity
- 0.4%Bottled, tank, or LP gas
- 0.1%Other fuel
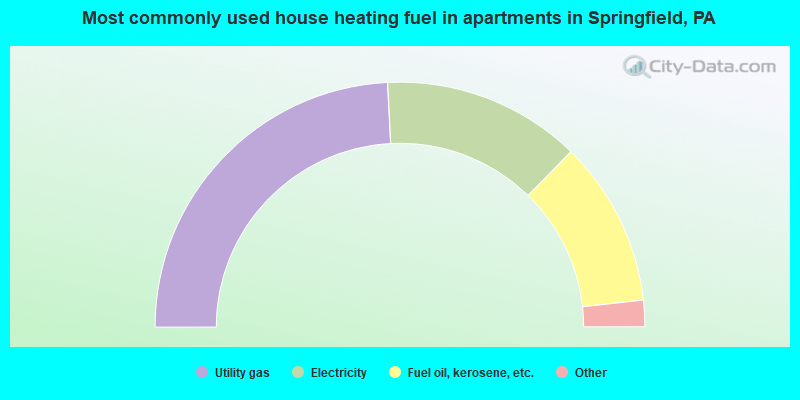
- 48.4%Utility gas
- 26.2%Electricity
- 21.9%Fuel oil, kerosene, etc.
- 1.4%Other fuel
- 1.1%Bottled, tank, or LP gas
- 1.1%Coal or coke
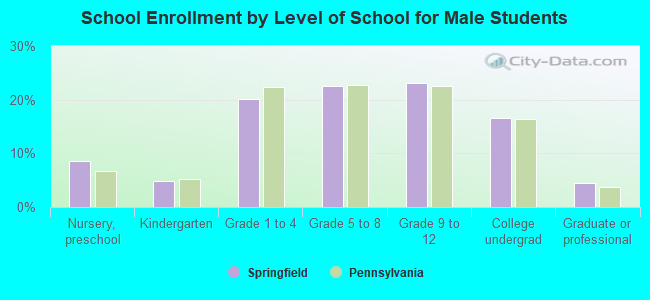
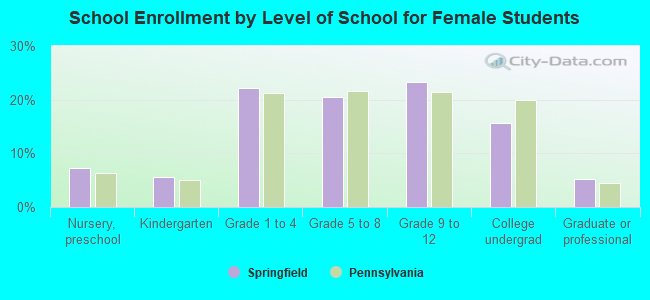
Private vs. public school enrollment:
| Here: | 27.5% |
| Pennsylvania: | 16.0% |
| Here: | 29.7% |
| Pennsylvania: | 13.1% |
| Here: | 41.1% |
| Pennsylvania: | 37.3% |