Spring Hill, TN (Tennessee) Houses and Residents
Estimated median house or condo value in 2022: $501,864 (it was $144,700 in 2000 )
Spring Hill:
$501,864Tennessee:
$284,800
Lower value quartile - upper value quartile: $401,448 - $631,817Total population: 34,269 (Urban population: 6,441 (all inside urban clusters), Rural population: 1,443 (54 farm, 1,389 nonfarm ))
Houses: 19,858 (19,072 occupied: 14,320 owner occupied, 4,788 renter occupied )
% of renters here:
25%State:
33%
Housing density: 1,121 houses/condos per square mile
Median price asked for vacant for-sale houses and condos in 2022: $1,393,583.
Median contract rent in 2022: $1,645 (lower quartile is $1,341, upper quartile is over $2,000)
Median rent asked for vacant for-rent units in 2022: $1,983
Median gross rent in Spring Hill, TN in 2022: $1,711
Housing units in Spring Hill with a mortgage: 10,674 (1,124 second mortgage, 0 home equity loan, 1,080 both second mortgage and home equity loan )Houses without a mortgage: 168
Median household income for houses/condos with a mortgage: $112,081
Median household income for apartments without a mortgage: $67,647
Median monthly housing costs: $1,706
Data:
Median house or condo value ($)
Median house or condo value ($ change since 2000)
Median house or condo value ($) - White
Median house or condo value ($) - Black or African American
Median house or condo value ($) - Asian
Median house or condo value ($) - Hispanic or Latino
Median house or condo value ($) - American Indian and Alaska Native
Median house or condo value ($) - Multirace
Median house or condo value ($) - Other Race
Median price asked for mobile homes ($)
Household density (households per square mile)
Mean house or condo value by units in structure - 1, detached ($)
Mean house or condo value by units in structure - 1, attached ($)
Mean house or condo value by units in structure - 2 ($)
Mean house or condo value by units in structure by units in structure - 3 or 4 ($)
Mean house or condo value by units in structure - 5 or more ($)
Mean house or condo value by units in structure - Boat, RV, van, etc. ($)
Mean house or condo value by units in structure - Mobile home ($)
Median contract rent ($)
Median contract rent - Lower quartile ($)
Median contract rent - Upper quartile ($)
Median gross rent ($)
Urban houses (%)
Rural houses (%)
Houses occupied (%)
Houses occupied (% change since 2000)
Houses owner occupied (%)
Houses owner occupied (% change since 2000)
Houses renter occupied (%)
Houses renter occupied (% change since 2000)
Vacant housing units - For rent (%)
Vacant housing units - For rent (% change since 2000)
Vacant housing units - For sale only (%)
Vacant housing units - For sale only (% change since 2000)
Vacant housing units - Rented or sold, not occupied (%)
Vacant housing units - Rented or sold, not occupied (% change since 2000)
Vacant housing units - For seasonal, recreational, or occasional use (%)
Vacant housing units - For seasonal, recreational, or occasional use (% change since 2000)
Vacant housing units - For migrant workers (%)
Vacant housing units - For migrant workers (% change since 2000)
Vacant housing units - Other vacant (%)
Vacant housing units - Other vacant (% change since 2000)
Median monthly housing costs ($)
Median household income for houses/condos with a mortgage ($)
Median household income for houses/condos without a mortgage ($)
Median household income ($)
Median household income ($) - White
Median household income ($) - Black or African American
Median household income ($) - Asian
Median household income ($) - Hispanic or Latino
Median household income ($) - American Indian and Alaska Native
Median household income ($) - Multirace
Median household income ($) - Other Race
Mortgage status - with mortgage (%)
Mortgage status - with second mortgage (%)
Mortgage status - with home equity loan (%)
Mortgage status - with both second mortgage and home equity loan (%)
Mortgage status - without a mortgage (%)
Median year house/condo built
Median year apartment built
Household type by relationship - Male householder living alone (%)
Household type by relationship - Male householder not living alone (%)
Household type by relationship - Female householder living alone (%)
Household type by relationship - Female householder not living alone (%)
Household type by relationship - Opposite-Sex spouse (%)
Household type by relationship - Same-Sex spouse (%)
Household type by relationship - Opposite-Sex unmarried partner (%)
Household type by relationship - Same-Sex unmarried partner (%)
Household type by relationship - In group quarters (%)
Size of family households - 2-person household (%)
Size of family households - 3-person household (%)
Size of family households - 4-person household (%)
Size of family households - 5-person household (%)
Size of family households - 6-person household (%)
Size of family households - 7-or-more-person household (%)
Size of nonfamily households - 1-person household (%)
Size of nonfamily households - 2-person household (%)
Size of nonfamily households - 3-person household (%)
Size of nonfamily households - 4-person household (%)
Size of nonfamily households - 5-person household (%)
Size of nonfamily households - 6-person household (%)
Size of nonfamily households - 7-or-moreperson household (%)
Year house built - Built 2010 or later (%)
Year house built - Built 2000 to 2009 (%)
Year house built - Built 1990 to 1999 (%)
Year house built - Built 1980 to 1989 (%)
Year house built - Built 1970 to 1979 (%)
Year house built - Built 1960 to 1969 (%)
Year house built - Built 1950 to 1959 (%)
Year house built - Built 1940 to 1949 (%)
Year house built - Built 1939 or earlier (%)
Median number of rooms in houses and condos
Median number of rooms in apartments
Median number of bedrooms in owner occupied houses
Mean number of bedrooms in owner occupied houses
Median number of bedrooms in renter occupied houses
Mean number of bedrooms in renter occupied houses
Median number of vehichles in owner occupied houses
Mean number of vehichles in owner occupied houses
Median number of vehichles in renter occupied houses
Mean number of vehichles in renter occupied houses
Rooms in owner-occupied houses - 1 room (%)
Rooms in owner-occupied houses - 2 rooms (%)
Rooms in owner-occupied houses - 3 rooms (%)
Rooms in owner-occupied houses - 4 rooms (%)
Rooms in owner-occupied houses - 5 rooms (%)
Rooms in owner-occupied houses - 6 rooms (%)
Rooms in owner-occupied houses - 7 rooms (%)
Rooms in owner-occupied houses - 8 rooms (%)
Rooms in owner-occupied houses - 9+ rooms (%)
Rooms in renter-occupied houses - 1 room (%)
Rooms in renter-occupied houses - 2 rooms (%)
Rooms in renter-occupied houses - 3 rooms (%)
Rooms in renter-occupied houses - 4 rooms (%)
Rooms in renter-occupied houses - 5 rooms (%)
Rooms in renter-occupied houses - 6 rooms (%)
Rooms in renter-occupied houses - 7 rooms (%)
Rooms in renter-occupied houses - 8 rooms (%)
Rooms in renter-occupied houses - 9+ rooms (%)
Bedrooms in owner-occupied houses - no bedrooms (%)
Bedrooms in owner-occupied houses - 1 bedroom (%)
Bedrooms in owner-occupied houses - 2 bedrooms (%)
Bedrooms in owner-occupied houses - 3 bedrooms (%)
Bedrooms in owner-occupied houses - 4 bedrooms (%)
Bedrooms in owner-occupied houses - 5+ bedrooms (%)
Bedrooms in renter-occupied houses - no bedrooms (%)
Bedrooms in renter-occupied houses - 1 bedroom (%)
Bedrooms in renter-occupied houses - 2 bedrooms (%)
Bedrooms in renter-occupied houses - 3 bedrooms (%)
Bedrooms in renter-occupied houses - 4 bedrooms (%)
Bedrooms in renter-occupied houses - 5+ bedrooms (%)
Vehicles available in owner-occupied houses - no vehicle available (%)
Vehicles available in owner-occupied houses - 1 vehicle available(%)
Vehicles available in owner-occupied houses - 2 Vehicles available (%)
Vehicles available in owner-occupied houses - 3 Vehicles available (%)
Vehicles available in owner-occupied houses - 4 Vehicles available (%)
Vehicles available in owner-occupied houses - 5+ Vehicles available (%)
Vehicles available in renter-occupied houses - no vehicle available (%)
Vehicles available in renter-occupied houses - 1 vehicle available (%)
Vehicles available in renter-occupied houses - 2 Vehicles available (%)
Vehicles available in renter-occupied houses - 3 Vehicles available (%)
Vehicles available in renter-occupied houses - 4 Vehicles available (%)
Vehicles available in renter-occupied houses - 5+ Vehicles available (%)
Housing units in structures - 1, detached (%)
Housing units in structures - 1, attached (%)
Housing units in structures - 2 (%)
Housing units in structures - 3 or 4 (%)
Housing units in structures - 5 to 9 (%)
Housing units in structures - 10 to 19 (%)
Housing units in structures - 20 to 49 (%)
Housing units in structures - 50 or more (%)
Housing units in structures - Mobile home (%)
Housing units in structures - Boat, RV, van, etc. (%)
Housing units in structures - Owners - 1, detached (%)
Housing units in structures - Owners - 1, attached (%)
Housing units in structures - Owners - 2 (%)
Housing units in structures - Owners - 3 or 4 (%)
Housing units in structures - Owners - 5 to 9 (%)
Housing units in structures - Owners - 10 to 19 (%)
Housing units in structures - Owners - 20 to 49 (%)
Housing units in structures - Owners - 50 or more (%)
Housing units in structures - Owners - Mobile home (%)
Housing units in structures - Owners - Boat, RV, van, etc. (%)
Housing units in structures - Renters - 1, detached (%)
Housing units in structures - Renters - 1, attached (%)
Housing units in structures - Renters - 2 (%)
Housing units in structures - Renters - 3 or 4 (%)
Housing units in structures - Renters - 5 to 9 (%)
Housing units in structures - Renters - 10 to 19 (%)
Housing units in structures - Renters - 20 to 49 (%)
Housing units in structures - Renters - 50 or more (%)
Housing units in structures - Renters - Mobile home (%)
Housing units in structures - Renters - Boat, RV, van, etc. (%)
House/condo owner moved in on average (years ago)
Renter moved in on average (years ago)
Year householder moved into unit - Moved in 1999 to March 2000 (%)
Year householder moved into unit - Moved in 1999 to March 2000 (%) - White
Year householder moved into unit - Moved in 1999 to March 2000 (%) - Black or African American
Year householder moved into unit - Moved in 1999 to March 2000 (%) - Asian
Year householder moved into unit - Moved in 1999 to March 2000 (%) - Hispanic or Latino
Year householder moved into unit - Moved in 1999 to March 2000 (%) - American Indian and Alaska Native
Year householder moved into unit - Moved in 1999 to March 2000 (%) - Multirace
Year householder moved into unit - Moved in 1999 to March 2000 (%) - Other Race
Year householder moved into unit - Moved in 1995 to 1998 (%)
Year householder moved into unit - Moved in 1995 to 1998 (%) - White
Year householder moved into unit - Moved in 1995 to 1998 (%) - Black or African American
Year householder moved into unit - Moved in 1995 to 1998 (%) - Asian
Year householder moved into unit - Moved in 1995 to 1998 (%) - Hispanic or Latino
Year householder moved into unit - Moved in 1995 to 1998 (%) - American Indian and Alaska Native
Year householder moved into unit - Moved in 1995 to 1998 (%) - Multirace
Year householder moved into unit - Moved in 1995 to 1998 (%) - Other Race
Year householder moved into unit - Moved in 1990 to 1994 (%)
Year householder moved into unit - Moved in 1990 to 1994 (%) - White
Year householder moved into unit - Moved in 1990 to 1994 (%) - Black or African American
Year householder moved into unit - Moved in 1990 to 1994 (%) - Asian
Year householder moved into unit - Moved in 1990 to 1994 (%) - Hispanic or Latino
Year householder moved into unit - Moved in 1990 to 1994 (%) - American Indian and Alaska Native
Year householder moved into unit - Moved in 1990 to 1994 (%) - Multirace
Year householder moved into unit - Moved in 1990 to 1994 (%) - Other Race
Year householder moved into unit - Moved in 1980 to 1989 (%)
Year householder moved into unit - Moved in 1980 to 1989 (%) - White
Year householder moved into unit - Moved in 1980 to 1989 (%) - Black or African American
Year householder moved into unit - Moved in 1980 to 1989 (%) - Asian
Year householder moved into unit - Moved in 1980 to 1989 (%) - Hispanic or Latino
Year householder moved into unit - Moved in 1980 to 1989 (%) - American Indian and Alaska Native
Year householder moved into unit - Moved in 1980 to 1989 (%) - Multirace
Year householder moved into unit - Moved in 1980 to 1989 (%) - Other Race
Year householder moved into unit - Moved in 1970 to 1979 (%)
Year householder moved into unit - Moved in 1970 to 1979 (%) - White
Year householder moved into unit - Moved in 1970 to 1979 (%) - Black or African American
Year householder moved into unit - Moved in 1970 to 1979 (%) - Asian
Year householder moved into unit - Moved in 1970 to 1979 (%) - Hispanic or Latino
Year householder moved into unit - Moved in 1970 to 1979 (%) - American Indian and Alaska Native
Year householder moved into unit - Moved in 1970 to 1979 (%) - Multirace
Year householder moved into unit - Moved in 1970 to 1979 (%) - Other Race
Year householder moved into unit - Moved in 1969 or earlier (%)
Year householder moved into unit - Moved in 1969 or earlier (%) - White
Year householder moved into unit - Moved in 1969 or earlier (%) - Black or African American
Year householder moved into unit - Moved in 1969 or earlier (%) - Asian
Year householder moved into unit - Moved in 1969 or earlier (%) - Hispanic or Latino
Year householder moved into unit - Moved in 1969 or earlier (%) - American Indian and Alaska Native
Year householder moved into unit - Moved in 1969 or earlier (%) - Multirace
Year householder moved into unit - Moved in 1969 or earlier (%) - Other Race
Housing units lacking complete plumbing facilities (%)
Housing units lacking complete kitchen facilities (%)
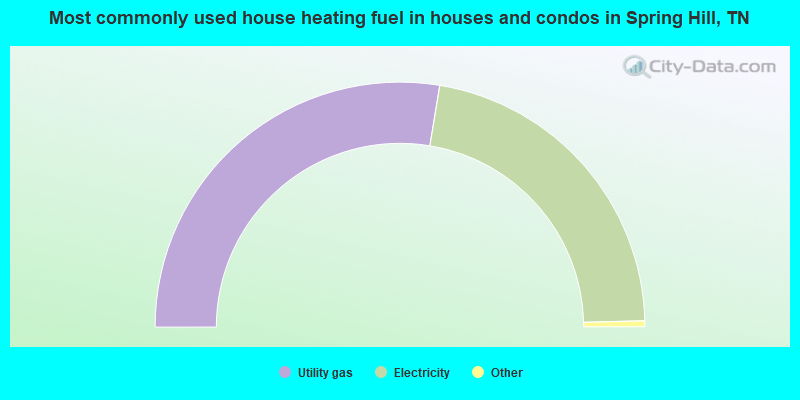
House heating fuel used in houses and condos - Utility gas (%)
House heating fuel used in houses and condos - Bottled, tank, or LP gas (%)
House heating fuel used in houses and condos - Electricity (%)
House heating fuel used in houses and condos - Fuel oil, kerosene, etc. (%)
House heating fuel used in houses and condos - Coal or coke (%)
House heating fuel used in houses and condos - Wood (%)
House heating fuel used in houses and condos - Solar energy (%)
House heating fuel used in houses and condos - Other fuel (%)
House heating fuel used in houses and condos - No fuel used (%)
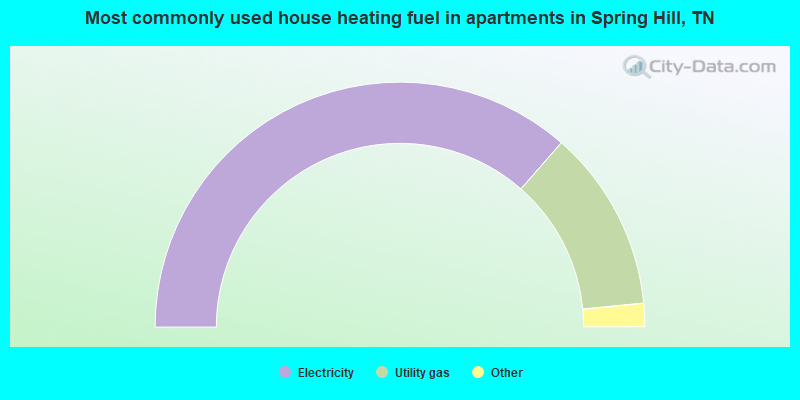
House heating fuel used in apartments - Utility gas (%)
House heating fuel used in apartments - Bottled, tank, or LP gas (%)
House heating fuel used in apartments - Electricity (%)
House heating fuel used in apartments - Fuel oil, kerosene, etc. (%)
House heating fuel used in apartments - Coal or coke (%)
House heating fuel used in apartments - Wood (%)
House heating fuel used in apartments - Solar energy (%)
House heating fuel used in apartments - Other fuel (%)
House heating fuel used in apartments - No fuel used (%)
Median year house/condo built: 2010Median year apartment built: 2004Household type by relationship:
Households: 54,416
Male householders: 10,659 (1,412 living alone ), Female householders: 8,285 (1,541 living alone )13,140 spouses (13,140 opposite-sex spouses ), 343 unmarried partners , (332 opposite-sex unmarried partners ), 19,144 children (18,516 natural , 220 adopted , 408 stepchildren ), 521 grandchildren , 287 brothers or sisters , 387 parents , 104 foster children , 445 other relatives , 992 non-relatives In group quarters: 103
Size of family households: 5,971 2-persons , 3,907 3-persons , 3,038 4-persons , 1,456 5-persons , 562 6-persons , 298 7-or-more-persons .
Size of nonfamily households: 3,200 1-person , 259 2-persons , 245 3-persons , 22 6-persons .
10,380 married couples with children. single-parent households (697 men , 1,464 women ).
92.6% of residents of Spring Hill speak English at home. of residents speak Spanish at home (69% speak English very well , 13% speak English well , 7% speak English not well , 12% don't speak English at all ).of residents speak other Indo-European language at home (56% speak English very well , 38% speak English well , 6% speak English not well ).of residents speak Asian or Pacific Island language at home (83% speak English very well , 6% speak English well , 11% speak English not well ).of residents speak other language at home (92% speak English very well , 8% speak English well ).
Foreign born population: 2,422 (4.5%)of them are naturalized citizens )
Median number of rooms in houses and condos:
Median number of rooms in apartments
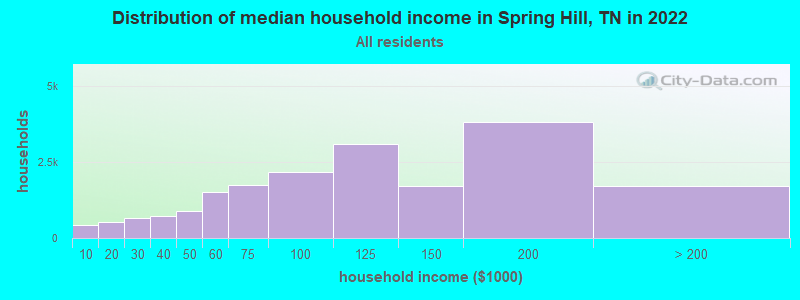
Spring Hill, TN household income distribution 422 Less than $10,000515 $10,000 to $19,999662 $20,000 to $29,999713 $30,000 to $39,999905 $40,000 to $49,9991,519 $50,000 to $59,9991,745 $60,000 to $74,9992,173 $75,000 to $99,9993,096 $100,000 to $124,9991,706 $125,000 to $149,9993,820 $150,000 to $199,9991,716 $200,000 or more
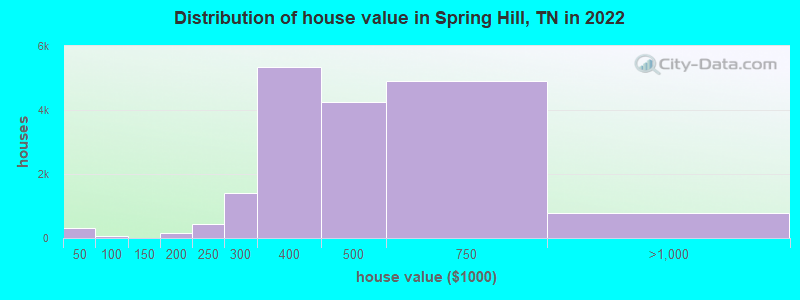
Home value of owner - occupied houses in 2022 in Spring Hill, TN 231 Less than $10,00047 $30,000 to $34,99943 $35,000 to $39,99962 $80,000 to $89,99913 $125,000 to $149,999133 $150,000 to $174,99912 $175,000 to $199,999441 $200,000 to $249,9991,420 $250,000 to $299,9995,329 $300,000 to $399,9994,254 $400,000 to $499,9994,915 $500,000 to $749,999699 $750,000 to $999,99974 $1,000,000 to $1,499,99917 $2,000,000 or moreRent paid by renters in 2022 in Spring Hill, TN 42 $150 to $19913 $200 to $24922 $300 to $34940 $350 to $39918 $450 to $49917 $600 to $64913 $750 to $799180 $900 to $999994 $1,000 to $1,249831 $1,250 to $1,4991,940 $1,500 to $1,9991,162 $2,000 to $2,49995 $2,500 to $2,99950 No cash rent
Percentage of workers working in this county: 70.0%Number of people working at home: 7,951 (28.6% of all workers )
Travel time to work (commute)
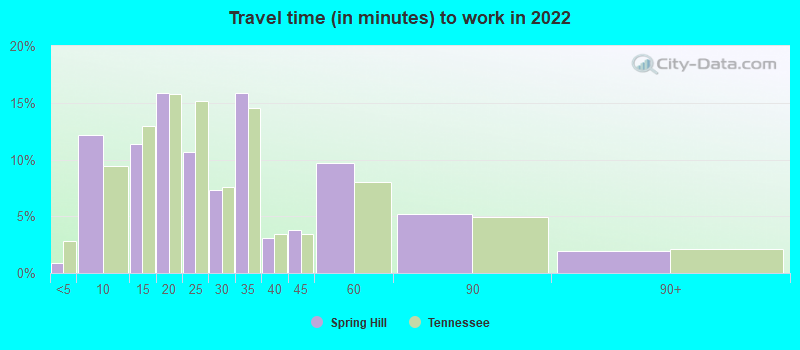
Less than 5 minutes: 1245 to 9 minutes: 1,92910 to 14 minutes: 2,07415 to 19 minutes: 1,68820 to 24 minutes: 1,78025 to 29 minutes: 2,35730 to 34 minutes: 5,27835 to 39 minutes: 2,04640 to 44 minutes: 1,18945 to 59 minutes: 2,51360 to 89 minutes: 1,03390 or more minutes: 78
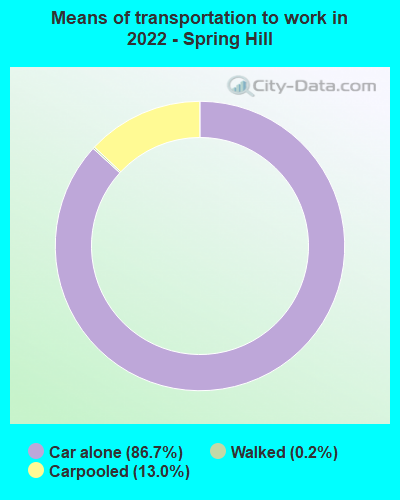
Means of transportation to work:
Drove a car alone: 8,447 (52.8%)Carpooled: 1,344 (8.4%)Walked: 23 (0.1%)Worked at home: 7,951 (49.7%)
Unemployment by race in 2022
Unemployment rate for White non-Hispanic residents 0.3% Males0.5% FemalesUnemployment rate for Black residents 5.1% FemalesUnemployment rate for other race residents 16.0% MalesUnemployment rate for two or more race residents 3.3% Males2.5% FemalesUnemployment rate for Hispanic or Latino residents 2.7% Males3.7% Females
Year of entry for the foreign-born population in Spring Hill, Tennessee
952 2010 or later 698 2000 to 2009 733 1990 to 1999 43 1980 to 1989 28 1970 to 1979 67 Before 1970
First ancestries reported:
American: 5,138 (22.6%)
English: 3,069 (13.5%)
Irish: 1,796 (7.9%)
German: 1,619 (7.1%)
European: 1,098 (4.8%)
Italian: 590 (2.6%)
African: 355 (1.6%)
Northern European: 333 (1.5%)
Polish: 298 (1.3%)
Scottish: 216 (0.9%)
British: 185 (0.8%)
Norwegian: 167 (0.7%)
Scotch-Irish: 159 (0.7%)
Canadian: 123 (0.5%)
Ukrainian: 121 (0.5%)
Czechoslovakian: 119 (0.5%)
Iraqi: 115 (0.5%)
Welsh: 97 (0.4%)
Lithuanian: 90 (0.4%)
Dutch: 81 (0.4%)
Czech: 77 (0.3%)
Macedonian: 71 (0.3%)
Croatian: 47 (0.2%)
Portuguese: 36 (0.2%)
French Canadian: 33 (0.1%)
Eastern European: 30 (0.1%)
French: 30 (0.1%)
Pennsylvania German: 30 (0.1%)
Greek: 28 (0.1%)
Scandinavian: 17 (0.07%)
Russian: 11 (0.05%)
Swedish: 11 (0.05%)
Swiss: 11 (0.05%)
Arab: 10 (0.04%)
Finnish: 6 (0.03%) Most common places of birth for foreign-born residents (%): Mexico Spring Hill:
29.9% (793)Tennessee:
23.0% (86,435)
Canada Spring Hill:
12.3% (326)Tennessee:
2.7% (10,295)
Venezuela Spring Hill:
10.4% (276)Tennessee:
1.6% (5,936)
Honduras Spring Hill:
8.5% (226)Tennessee:
4.6% (17,433)
India Spring Hill:
6.4% (169)Tennessee:
6.1% (23,079)
Colombia Spring Hill:
5.6% (148)Tennessee:
1.0% (3,879)
England Spring Hill:
4.5% (120)Tennessee:
1.2% (4,587)
Guatemala Spring Hill:
3.1% (83)Tennessee:
5.7% (21,286)
Ivory Coast Spring Hill:
3.0% (80)Tennessee:
0.0% (80)
United Kingdom, excluding England and Scotland Spring Hill:
2.6% (68)Tennessee:
1.0% (3,809)
Pakistan Spring Hill:
2.4% (64)Tennessee:
0.5% (2,053)
Iraq Spring Hill:
2.4% (63)Tennessee:
2.0% (7,701)
Other Eastern Europe Spring Hill:
1.8% (47)Tennessee:
0.4% (1,462)
Germany Spring Hill:
1.7% (44)Tennessee:
2.2% (8,261)
China, excluding Hong Kong and Taiwan Spring Hill:
1.6% (43)Tennessee:
3.3% (12,582)
Kenya Spring Hill:
1.5% (40)Tennessee:
0.2% (939)
Place of birth for U.S.-born residents:
This state: 17,320Other state: 33,782Northeast: 5,592Midwest: 11,271South: 11,869West: 5,022 84.1% of Spring Hill residents lived in the same house 1 years ago.
Out of people who lived in different houses, 15.4% lived in this county.
Out of people who lived in different counties, 35.6% lived in Tennessee.
Spring Hill:
84.1%State average:
87.0%
Education attainment for males 25 years and older:
No schooling: 310Nursery to 4th grade: 465th and 6th grade: 817th and 8th grade: 09th grade: 9310th grade: 211th grade: 4812th grade, no diploma: 381High school graduate (or equivalency): 3,508Less than 1 year of college: 454Some college more than 1 year, no degree: 2,507Associate degree: 1,067Bachelor's degree: 6,979Master's degree: 1,756Professional school degree: 447Doctorate degree: 219
Education attainment for females 25 years and older:
No schooling: 0Nursery to 4th grade: 625th and 6th grade: 297th and 8th grade: 149th grade: 4410th grade: 10411th grade: 7712th grade, no diploma: 239High school graduate (or equivalency): 3,138Less than 1 year of college: 2,204Some college more than 1 year, no degree: 1,331Associate degree: 2,055Bachelor's degree: 5,687Master's degree: 2,173Professional school degree: 431Doctorate degree: 184
Housing units in structures:
One, detached: 14,795One, attached: 1,863Two: 2043 or 4: 3555 to 9: 69510 to 19: 1,17120 to 49: 28050 or more: 344Mobile homes: 146Housing units lacking complete plumbing facilities in 2022: 0.7%Housing units lacking complete kitchen facilities in 2022: 0.7%House/condo owner moved in on average 4 years ago
Renter moved in on average 3 years ago
Private vs. public school enrollment:
Students in private schools in grades 1 to 8 (elementary and middle school): 954 Here:
10.2%Tennessee:
15.0%
Students in private schools in grades 9 to 12 (high school): 125 Students in private undergraduate colleges: 296 Here:
12.1%Tennessee:
23.5%