Spanaway, WA (Washington) Houses and Residents
| Spanaway: | $436,517 |
| Washington: | $569,500 |
Total population: 27,227 (Urban population: 21,447, Rural population: 0)
Houses: 12,089 (11,695 occupied: 8,491 owner occupied, 3,207 renter occupied)
| % of renters here: | 27% |
| State: | 36% |
Housing density: 1,451 houses/condos per square mile
Median price asked for vacant for-sale houses and condos in 2022: $245,367.
Median contract rent in 2022: $1,560 (lower quartile is $1,193, upper quartile is $1,965)
Median rent asked for vacant for-rent units in 2022: $2,145
Median gross rent in Spanaway, WA in 2022: $1,733
Housing units in Spanaway with a mortgage: 5,822 (572 second mortgage, 14 home equity loan, 455 both second mortgage and home equity loan)
Houses without a mortgage: 111
Median household income for houses/condos with a mortgage: $108,258
Median household income for apartments without a mortgage: $91,536
Median monthly housing costs: $1,683
Compare current foreclosures in Spanaway, WA:
| Photo | Address | Area | Beds / Baths | Price | Details |
|---|---|---|---|---|---|

|
#1
48th Avenue Ct E
Spanaway, WA 98387
|
972 sq. feet
|
1 baths 3 beds |
show details | |

|
#2
13th Avenue Ct E
Spanaway, WA 98387
|
5,465 sq. feet
|
3 baths 5 beds |
show details | |

|
#3
167th Street
Spanaway, WA 98387
|
1,812 sq. feet
|
2 baths 3 beds |
show details | |

|
#4
172nd St E
Spanaway, WA 98387
|
2,148 sq. feet
|
1 baths 3 beds |
show details | |

|
#5
11th Avenue Ct E
Spanaway, WA 98387
|
- sq. feet
|
2 baths 4 beds |
show details | |

|
#6
82nd Avenue Ct E
Spanaway, WA 98387
|
1,974 sq. feet
|
3 baths 3 beds |
show details | |

|
#7
205th Street Ct E
Spanaway, WA 98387
|
2,482 sq. feet
|
2 baths 4 beds |
show details | |

|
#8
30th Ave E
Spanaway, WA 98387
|
2,112 sq. feet
|
2 baths 4 beds |
show details | |

|
#9
45th Ave E
Spanaway, WA 98387
|
1,412 sq. feet
|
1 baths 3 beds |
show details | |

|
#10
205th Street Ct E
Spanaway, WA 98387
|
1,186 sq. feet
|
2 baths 3 beds |
show details |
| Photo | Address | Area | Beds / Baths | Price | Details |
|---|---|---|---|---|---|

|
#11
57th Ave E
Spanaway, WA 98387
|
2,357 sq. feet
|
3 baths 3 beds |
show details | |

|
#12
200th Street Ct E
Spanaway, WA 98387
|
1,248 sq. feet
|
2 baths 3 beds |
show details | |

|
#13
16th Avenue Ct E
Spanaway, WA 98387
|
2,213 sq. feet
|
3 baths 4 beds |
show details | |

|
#14
4th Avenue Ct E
Spanaway, WA 98387
|
1,425 sq. feet
|
2 baths 4 beds |
show details | |

|
#15
5th Avenue Ct E
Spanaway, WA 98387
|
2,169 sq. feet
|
2 baths 4 beds |
show details | |

|
#16
196th Street Ct E
Spanaway, WA 98387
|
2,852 sq. feet
|
2 baths 3 beds |
show details | |

|
#17
Park Ave S
Spanaway, WA 98387
|
1,462 sq. feet
|
1 baths 3 beds |
show details | |

|
#18
28th Ave E
Spanaway, WA 98387
|
1,374 sq. feet
|
2 baths 3 beds |
show details | |

|
#19
18th Avenue Ct E
Spanaway, WA 98387
|
1,929 sq. feet
|
2 baths 3 beds |
show details | |

|
#20
169th St E
Spanaway, WA 98387
|
1,216 sq. feet
|
1 baths 3 beds |
show details |
| Photo | Address | Area | Beds / Baths | Price | Details |
|---|---|---|---|---|---|

|
#21
43rd Avenue Ct E
Spanaway, WA 98387
|
2,532 sq. feet
|
2 baths 4 beds |
show details | |

|
#22
79th Avenue Ct E
Spanaway, WA 98387
|
2,082 sq. feet
|
2 baths 4 beds |
show details | |

|
#23
26th Avenue Ct E
Spanaway, WA 98387
|
2,397 sq. feet
|
2 baths 5 beds |
show details | |

|
#24
165th Street Ct E
Spanaway, WA 98387
|
1,473 sq. feet
|
2 baths 3 beds |
show details | |

|
#25
223rd St E
Spanaway, WA 98387
|
1,400 sq. feet
|
2 baths 3 beds |
show details | |

|
#26
182nd Street Ct E
Spanaway, WA 98387
|
2,082 sq. feet
|
2 baths 4 beds |
show details | |

|
#27
214th St E
Spanaway, WA 98387
|
1,660 sq. feet
|
2 baths 3 beds |
show details | |

|
#28
215th Street Ct E
Spanaway, WA 98387
|
3,045 sq. feet
|
2 baths 3 beds |
show details | |

|
#29
203rd Street Ct E
Spanaway, WA 98387
|
1,580 sq. feet
|
2 baths 3 beds |
show details | |

|
#30
Spanaway Ln E
Spanaway, WA 98387
|
1,532 sq. feet
|
1 baths 3 beds |
show details |
| Photo | Address | Area | Beds / Baths | Price | Details |
|---|---|---|---|---|---|

|
#31
Twinkle Dr E
Spanaway, WA 98387
|
1,344 sq. feet
|
1 baths 3 beds |
show details | |

|
#32
200th Street Ct E
Spanaway, WA 98387
|
2,099 sq. feet
|
3 baths 3 beds |
show details | |

|
#33
8th Ave E
Spanaway, WA 98387
|
1,056 sq. feet
|
1 baths 3 beds |
show details | |

|
#34
197th Street Ct E
Spanaway, WA 98387
|
2,352 sq. feet
|
2 baths 4 beds |
show details | |

|
#35
39th Ave E
Spanaway, WA 98387
|
2,047 sq. feet
|
2 baths 4 beds |
show details | |

|
#36
181st Street Ct E
Spanaway, WA 98387
|
2,036 sq. feet
|
2 baths 3 beds |
show details | |

|
#37
Park Ave S
Spanaway, WA 98387
|
1,774 sq. feet
|
2 baths 3 beds |
show details | |

|
#38
154th St S
Spanaway, WA 98387
|
1,773 sq. feet
|
2 baths 3 beds |
show details | |

|
#39
53rd Avenue Ct E
Spanaway, WA 98387
|
1,676 sq. feet
|
2 baths 4 beds |
show details | |

|
#40
174th St E
Spanaway, WA 98387
|
1,856 sq. feet
|
3 baths 4 beds |
show details |
| Photo | Address | Area | Beds / Baths | Price | Details |
|---|---|---|---|---|---|

|
#41
196th St E
Spanaway, WA 98387
|
2,466 sq. feet
|
2 baths 5 beds |
show details | |

|
#42
43rd Ave E
Spanaway, WA 98387
|
968 sq. feet
|
1 baths 3 beds |
show details | |

|
#43
199th Street Ct E
Spanaway, WA 98387
|
1,994 sq. feet
|
2 baths 3 beds |
show details | |

|
#44
250th Street Ct E
Spanaway, WA 98387
|
1,248 sq. feet
|
2 baths 3 beds |
show details | |

|
#45
193rd Street Ct E
Spanaway, WA 98387
|
2,490 sq. feet
|
2 baths 4 beds |
show details | |

|
#46
204th St E
Spanaway, WA 98387
|
1,592 sq. feet
|
2 baths 3 beds |
show details | |

|
#47
65th Ave E
Spanaway, WA 98387
|
- sq. feet
|
2 baths 4 beds |
show details | |

|
#48
201st Street Ct E
Spanaway, WA 98387
|
- sq. feet
|
- baths - beds |
show details | |

|
#49
206th Street Ct E
Spanaway, WA 98387
|
- sq. feet
|
- baths - beds |
show details | |

|
Check over 1 million property listings on Foreclosure.com!
|
browse all offers | |||

Latest news about housing in Spanaway, WA collected exclusively by city-data.com from local newspapers, TV, and radio stations

 | Good areas for Townhouses in W Wa (10 replies) |
| Frustrated tenant looking for an equally frustrated renter (37 replies) |
| Affordable housing in Western WA? (54 replies) |
| Affordable homes? (27 replies) |
| Looking to move to Spanaway (1 reply) |
| 3 homes in Tacoma I am looking at which area is nicer? (15 replies) |

Median year apartment built: 1988
Household type by relationship:
Households: 34,325- Male householders: 5,808 (1,132 living alone), Female householders: 5,665 (900 living alone)
6,001 spouses (5,915 opposite-sex spouses), 1,058 unmarried partners, (1,058 opposite-sex unmarried partners), 11,877 children (11,049 natural, 204 adopted, 622 stepchildren), 871 grandchildren, 344 brothers or sisters, 576 parents, 35 foster children, 952 other relatives, 1,072 non-relatives
- In group quarters: 61
Size of family households: 3,309 2-persons, 2,426 3-persons, 1,405 4-persons, 874 5-persons, 326 6-persons, 535 7-or-more-persons.
Size of nonfamily households: 2,069 1-person, 545 2-persons, 174 3-persons, 14 5-persons.
5,710 married couples with children.
2,910 single-parent households (994 men, 1,916 women).
74.0% of residents of Spanaway speak English at home.
9.8% of residents speak Spanish at home (76% speak English very well, 19% speak English well, 3% speak English not well, 2% don't speak English at all).
6.7% of residents speak other Indo-European language at home (65% speak English very well, 24% speak English well, 9% speak English not well, 3% don't speak English at all).
8.4% of residents speak Asian or Pacific Island language at home (62% speak English very well, 31% speak English well, 6% speak English not well, 1% don't speak English at all).
1.1% of residents speak other language at home (40% speak English very well, 60% speak English well).
Foreign born population: 5,497 (16.0%)
(51.2% of them are naturalized citizens)
| Here: | 6.1 |
| State: | 6.5 |
| Here: | 4.8 |
| State: | 3.9 |

- Bedrooms in owner-occupied houses and condos in Spanaway, Washington
- 0no bedroom
- 1021 bedroom
- 6542 bedrooms
- 5,2173 bedrooms
- 2,2214 bedrooms
- 2965+ bedrooms

- Bedrooms in renter-occupied apartments in Spanaway, Washington
- 13no bedroom
- 1951 bedroom
- 1,2492 bedrooms
- 1,4683 bedrooms
- 2384 bedrooms
- 435+ bedrooms

- Cars and other vehicles available in Spanaway in owner-occupied houses/condos
- 273no vehicle
- 1,6841 vehicle
- 3,3892 vehicles
- 1,9593 vehicles
- 6794 vehicles
- 5075+ vehicles

- Cars and other vehicles available in Spanaway in renter-occupied apartments
- 302no vehicle
- 8881 vehicle
- 1,3642 vehicles
- 4733 vehicles
- 1434 vehicles
- 365+ vehicles

- Rooms in owner-occupied houses in Spanaway, Washington
- 01 room
- 02 rooms
- 1343 rooms
- 6174 rooms
- 1,7505 rooms
- 2,5286 rooms
- 1,6747 rooms
- 7538 rooms
- 1,0359+ rooms

- Rooms in renter-occupied apartments in Spanaway, Washington
- 131 room
- 322 rooms
- 4113 rooms
- 9464 rooms
- 5585 rooms
- 5626 rooms
- 4367 rooms
- 1218 rooms
- 1299+ rooms


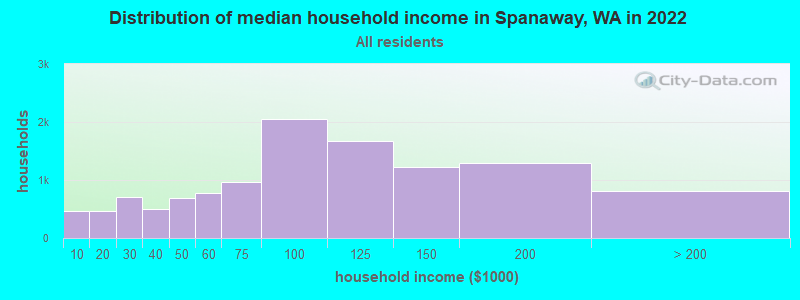
Spanaway, WA household income distribution

- 467Less than $10,000
- 472$10,000 to $19,999
- 712$20,000 to $29,999
- 496$30,000 to $39,999
- 684$40,000 to $49,999
- 773$50,000 to $59,999
- 960$60,000 to $74,999
- 2,049$75,000 to $99,999
- 1,670$100,000 to $124,999
- 1,229$125,000 to $149,999
- 1,296$150,000 to $199,999
- 817$200,000 or more
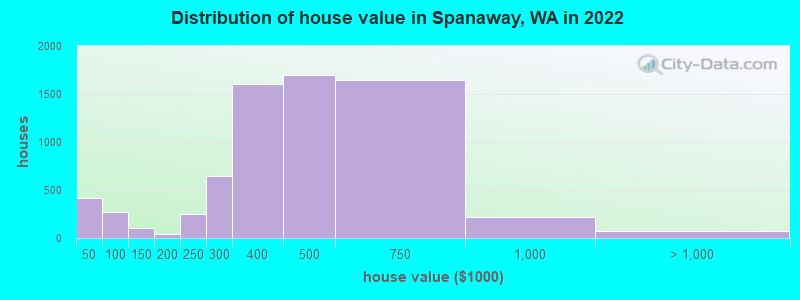
Home value of owner - occupied houses in 2022 in Spanaway, WA
-
- 219Less than $10,000
- 9$10,000 to $14,999
- 57$15,000 to $19,999
- 23$20,000 to $24,999
- 70$30,000 to $34,999
- 16$35,000 to $39,999
- 18$40,000 to $49,999
- 119$50,000 to $59,999
- 92$60,000 to $69,999
- 44$70,000 to $79,999
- 87$100,000 to $124,999
- 12$125,000 to $149,999
- 12$150,000 to $174,999
- 30$175,000 to $199,999
- 253$200,000 to $249,999
- 647$250,000 to $299,999
- 1,603$300,000 to $399,999
- 1,702$400,000 to $499,999
- 1,646$500,000 to $749,999
- 218$750,000 to $999,999
- 55$1,000,000 to $1,499,999
- 11$1,500,000 to $1,999,999
- 3$2,000,000 or more
Rent paid by renters in 2022 in Spanaway, WA
-
- 40$100 to $149
- 39$150 to $199
- 9$200 to $249
- 18$250 to $299
- 12$500 to $549
- 12$550 to $599
- 63$600 to $649
- 6$650 to $699
- 7$700 to $749
- 22$750 to $799
- 101$800 to $899
- 113$900 to $999
- 442$1,000 to $1,249
- 585$1,250 to $1,499
- 959$1,500 to $1,999
- 497$2,000 to $2,499
- 138$2,500 to $2,999
- 33$3,500 or more
- 82No cash rent


Percentage of workers working in this county: 80.1%
Number of people working at home: 1,753 (10.9% of all workers)
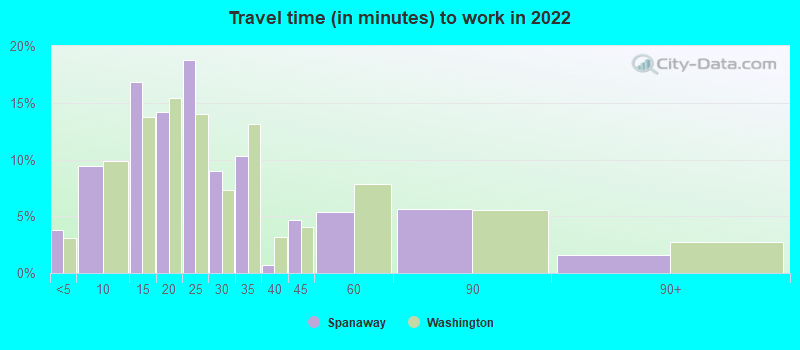
Travel time to work (commute)
- Less than 5 minutes: 184
- 5 to 9 minutes: 677
- 10 to 14 minutes: 1,052
- 15 to 19 minutes: 975
- 20 to 24 minutes: 1,810
- 25 to 29 minutes: 1,550
- 30 to 34 minutes: 2,310
- 35 to 39 minutes: 534
- 40 to 44 minutes: 437
- 45 to 59 minutes: 1,930
- 60 to 89 minutes: 1,616
- 90 or more minutes: 673
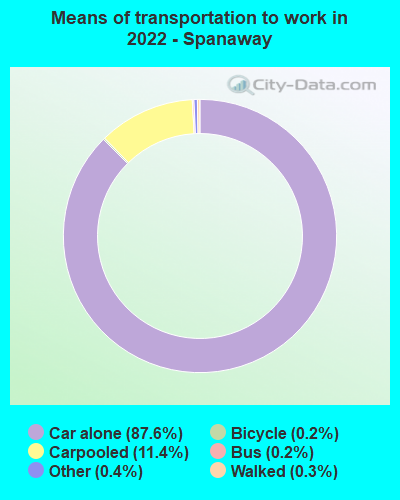
Means of transportation to work:
- Drove a car alone: 4,163 (65.4%)
- Carpooled: 561 (8.8%)
- Bus: 8 (0.1%)
- Taxi: 17 (0.3%)
- Bicycle: 12 (0.2%)
- Walked: 17 (0.3%)
- Worked at home: 1,753 (27.5%)

- Unemployment by race in 2022
- Unemployment rate for White non-Hispanic residents
- 3.1%Males
- 3.4%Females
- Unemployment rate for Black residents
- 10.9%Males
- 1.0%Females
- Unemployment rate for other race residents
- 8.2%Males
- 12.6%Females
- Unemployment rate for two or more race residents
- 19.0%Males
- 1.1%Females
- Unemployment rate for Hispanic or Latino residents
- 14.6%Males
- 6.6%Females

- Year of entry for the foreign-born population in Spanaway, Washington
- 1,5742010 or later
- 1,3312000 to 2009
- 1,1801990 to 1999
- 4381980 to 1989
- 4321970 to 1979
- 449Before 1970

First ancestries reported:
- English: 1,323 (8.4%)
- American: 996 (6.3%)
- German: 931 (5.9%)
- Ukrainian: 698 (4.4%)
- Irish: 586 (3.7%)
- European: 462 (2.9%)
- Brazilian: 362 (2.3%)
- Norwegian: 197 (1.2%)
- Hungarian: 128 (0.8%)
- Scottish: 126 (0.8%)
- French Canadian: 102 (0.6%)
- African: 89 (0.6%)
- Polish: 74 (0.5%)
- Welsh: 63 (0.4%)
- Scandinavian: 58 (0.4%)
- Ugandan: 56 (0.4%)
- Portuguese: 54 (0.3%)
- Italian: 53 (0.3%)
- Romanian: 49 (0.3%)
- Jamaican: 40 (0.3%)
- Australian: 37 (0.2%)
- Finnish: 36 (0.2%)
- Northern European: 34 (0.2%)
- Swedish: 34 (0.2%)
- Dutch: 29 (0.2%)
- Greek: 27 (0.2%)
- Danish: 23 (0.1%)
- Pennsylvania German: 20 (0.1%)
- Czech: 17 (0.1%)
- French: 11 (0.07%)
- Russian: 11 (0.07%)
- Slavic: 6 (0.04%)
- British: 6 (0.04%)
- Scotch-Irish: 4 (0.03%)
- Czechoslovakian: 4 (0.03%)
Most common places of birth for foreign-born residents (%):
| Spanaway: | 21.5% (1,147) |
| Washington: | 21.1% (241,655) |
| Spanaway: | 12.5% (665) |
| Washington: | 3.1% (35,872) |
| Spanaway: | 11.9% (636) |
| Washington: | 6.3% (71,661) |
| Spanaway: | 10.1% (539) |
| Washington: | 0.4% (4,177) |
| Spanaway: | 8.5% (455) |
| Washington: | 4.3% (48,886) |
| Spanaway: | 6.0% (319) |
| Washington: | 0.7% (8,049) |
| Spanaway: | 4.0% (213) |
| Washington: | 1.6% (17,761) |
| Spanaway: | 3.6% (193) |
| Washington: | 0.9% (9,937) |
| Spanaway: | 2.8% (152) |
| Washington: | 0.7% (8,540) |
| Spanaway: | 1.7% (92) |
| Washington: | 0.6% (6,500) |
Place of birth for U.S.-born residents:
- This state: 16,541
- Other state: 10,914
- Northeast: 945
- Midwest: 1,586
- South: 2,866
- West: 5,508
86.8% of Spanaway residents lived in the same house 1 years ago.
Out of people who lived in different houses, 41.3% lived in this county.
Out of people who lived in different counties, 56.8% lived in Washington.
| Spanaway: | 86.8% |
| State average: | 85.2% |
Education attainment for males 25 years and older:
- No schooling: 215
- Nursery to 4th grade: 84
- 5th and 6th grade: 0
- 7th and 8th grade: 45
- 9th grade: 86
- 10th grade: 90
- 11th grade: 251
- 12th grade, no diploma: 433
- High school graduate (or equivalency): 4,550
- Less than 1 year of college: 1,123
- Some college more than 1 year, no degree: 1,425
- Associate degree: 1,516
- Bachelor's degree: 835
- Master's degree: 262
- Professional school degree: 2
- Doctorate degree: 33

Education attainment for females 25 years and older:
- No schooling: 206
- Nursery to 4th grade: 23
- 5th and 6th grade: 60
- 7th and 8th grade: 97
- 9th grade: 101
- 10th grade: 129
- 11th grade: 156
- 12th grade, no diploma: 237
- High school graduate (or equivalency): 3,176
- Less than 1 year of college: 1,607
- Some college more than 1 year, no degree: 1,721
- Associate degree: 1,394
- Bachelor's degree: 1,163
- Master's degree: 508
- Professional school degree: 77
- Doctorate degree: 115


Housing units in structures:
- One, detached: 9,454
- One, attached: 865
- Two: 330
- 3 or 4: 199
- 5 to 9: 103
- 10 to 19: 152
- 20 to 49: 90
- 50 or more: 86
- Mobile homes: 788
- Boats, RVs, vans, etc.: 18
Median worth of mobile homes: $83,651
Housing units lacking complete kitchen facilities in 2022: 0.5%
House/condo owner moved in on average 9 years ago
Renter moved in on average 3 years ago

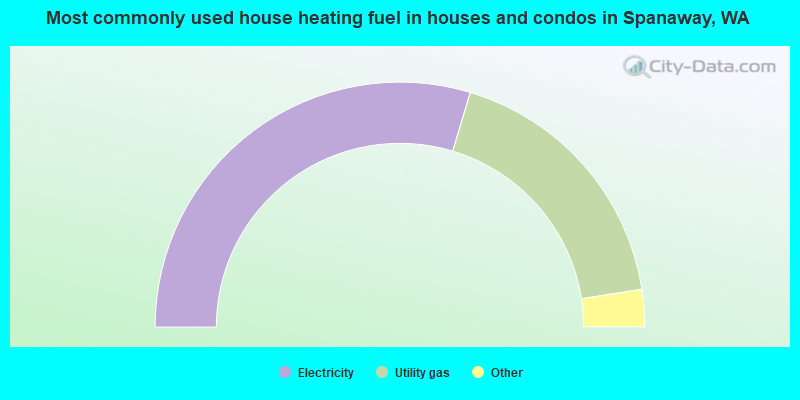
- 59.3%Electricity
- 35.8%Utility gas
- 2.7%Wood
- 0.9%Bottled, tank, or LP gas
- 0.7%Fuel oil, kerosene, etc.
- 0.5%No fuel used
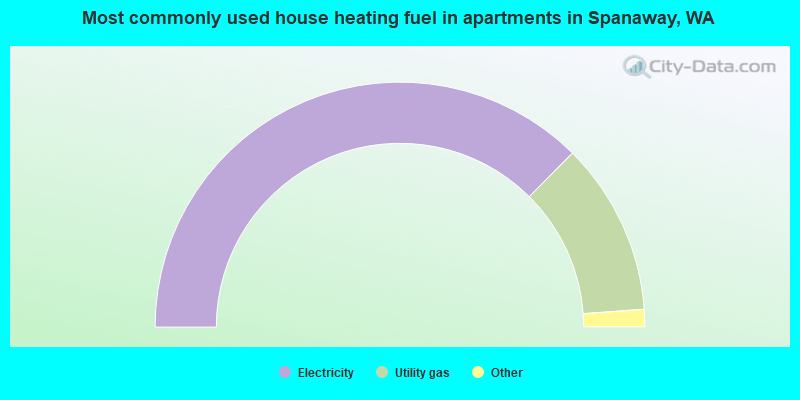
- 74.9%Electricity
- 22.8%Utility gas
- 1.4%No fuel used
- 0.5%Bottled, tank, or LP gas
- 0.3%Other fuel
Private vs. public school enrollment:
| Here: | 4.5% |
| Washington: | 12.4% |
| Here: | 4.8% |
| Washington: | 9.2% |
| Here: | 6.0% |
| Washington: | 16.5% |


