South Orange, NJ (New Jersey) Houses and Residents
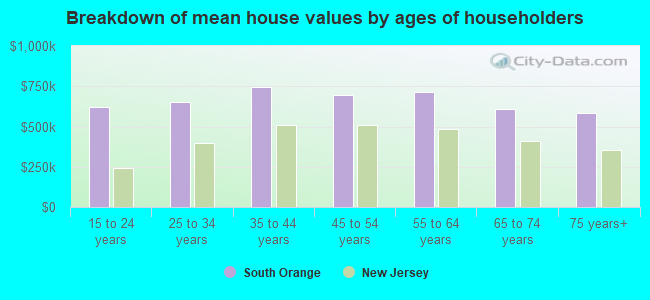
| South Orange: | $691,320 |
| New Jersey: | $428,900 |
Total population: 16,468 (All urban)
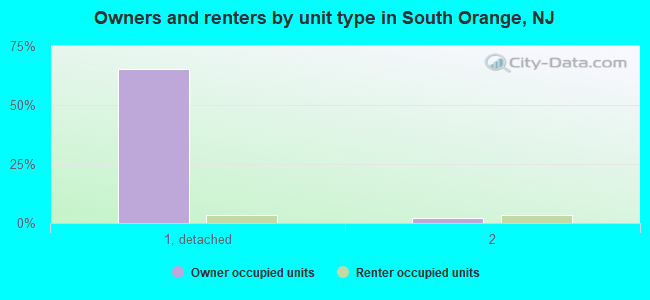
Houses: 5,671 (5,522 occupied: 3,985 owner occupied, 1,537 renter occupied)
| % of renters here: | 28% |
| State: | 35% |
Housing density: 1,988 houses/condos per square mile
Median price asked for vacant for-sale houses and condos in 2022 in this county: $231,294.
Median contract rent in 2022: $1,656 (lower quartile is $1,375, upper quartile is over $2,000)
Median rent asked for vacant for-rent units in 2022: $1,537
Median gross rent in South Orange, NJ in 2022: $1,791
Housing units in South Orange with a mortgage: 2,786 (354 second mortgage, 438 home equity loan, 8 both second mortgage and home equity loan)
Houses without a mortgage: 811
Compare current foreclosures in South Orange, NJ:
| Photo | Address | Area | Beds / Baths | Price | Details |
|---|---|---|---|---|---|

|
#1
Waverly Pl
South Orange, NJ 07079
|
1,664 sq. feet
|
- baths - beds |
show details | |

|
#2
Vose Ave Apt 1
South Orange, NJ 07079
|
- sq. feet
|
- baths - beds |
show details | |

|
#3
S Kingman Rd
South Orange, NJ 07079
|
- sq. feet
|
- baths - beds |
show details | |

|
#4
Milton Pl
South Orange, NJ 07079
|
1,858 sq. feet
|
- baths - beds |
show details | |

|
#5
Church St Apt 10
South Orange, NJ 07079
|
1,186 sq. feet
|
- baths - beds |
show details | |

|
#6
Eder Ter
South Orange, NJ 07079
|
1,324 sq. feet
|
- baths - beds |
show details | |

|
#7
Church St Apt 10
South Orange, NJ 07079
|
1,186 sq. feet
|
- baths - beds |
show details | |

|
#8
W South Orange Ave Apt 2-N
South Orange, NJ 07079
|
- sq. feet
|
- baths - beds |
show details | |

|
#9
Sinclair Ter
South Orange, NJ 07079
|
1,888 sq. feet
|
- baths - beds |
show details | |

|
#10
Berkeley Ave
South Orange, NJ 07079
|
- sq. feet
|
- baths - beds |
show details |
| Photo | Address | Area | Beds / Baths | Price | Details |
|---|---|---|---|---|---|

|
#11
Irvington Ave # 2
South Orange, NJ 07079
|
- sq. feet
|
- baths - beds |
show details | |

|
#12
S Ridgewood Rd
South Orange, NJ 07079
|
2,426 sq. feet
|
- baths - beds |
show details | |

|
#13
Ridgewood Rd
South Orange, NJ 07079
|
2,426 sq. feet
|
- baths - beds |
show details | |

|
#14
Irving Ave
South Orange, NJ 07079
|
2,636 sq. feet
|
- baths - beds |
show details | |

|
#15
S Orange Ave # 347
South Orange, NJ 07079
|
- sq. feet
|
- baths - beds |
show details | |

|
#16
Academy St # 2
South Orange, NJ 07079
|
3,392 sq. feet
|
- baths - beds |
show details | |

|
#17
Cameron Rd
South Orange, NJ 07079
|
- sq. feet
|
- baths - beds |
show details | |

|
#18
Mews Ln
South Orange, NJ 07079
|
1,012 sq. feet
|
- baths - beds |
show details | |

|
#19
Mercer Pl
South Orange, NJ 07079
|
2,622 sq. feet
|
- baths - beds |
show details | |

|
#20
Redmond Rd
South Orange, NJ 07079
|
4,191 sq. feet
|
- baths - beds |
show details |
| Photo | Address | Area | Beds / Baths | Price | Details |
|---|---|---|---|---|---|

|
#21
S Centre St
South Orange, NJ 07079
|
2,688 sq. feet
|
- baths - beds |
show details | |

|
#22
Waverly Rd And 737 S Center St
South Orange, NJ Array
|
- sq. feet
|
- baths - beds |
show details | |

|
#23
Irvington Ave Apt 7a
South Orange, NJ 07079
|
- sq. feet
|
- baths - beds |
show details | |

|
#24
Tillou Rd
South Orange, NJ 07079
|
4,401 sq. feet
|
- baths - beds |
show details | |

|
#25
Richmond Ave
South Orange, NJ 07079
|
2,403 sq. feet
|
- baths - beds |
show details | |

|
#26
W Orange Ave
South Orange, NJ 07079
|
- sq. feet
|
- baths - beds |
show details | |

|
#27
Kenneth Ter
South Orange, NJ 07079
|
1,568 sq. feet
|
- baths - beds |
show details | |

|
#28
Ward Pl
South Orange, NJ 07079
|
1,556 sq. feet
|
- baths - beds |
show details | |

|
#29
Stirling Ave
South Orange, NJ 07079
|
2,016 sq. feet
|
- baths - beds |
show details | |

|
#30
W South Orange Ave Apt 2h
South Orange, NJ 07079
|
- sq. feet
|
- baths - beds |
show details |
| Photo | Address | Area | Beds / Baths | Price | Details |
|---|---|---|---|---|---|

|
#31
Scotland Rd # 7
South Orange, NJ 07079
|
- sq. feet
|
- baths - beds |
show details | |

|
#32
Holland Rd
South Orange, NJ 07079
|
1,671 sq. feet
|
- baths - beds |
show details | |

|
#33
W South Orange Ave Apt 2n
South Orange, NJ 07079
|
- sq. feet
|
- baths - beds |
show details | |

|
#34
Valley St Apt G2
South Orange, NJ 07079
|
- sq. feet
|
- baths - beds |
show details | |

|
#35
S Orange Ave
South Orange, NJ 07079
|
- sq. feet
|
- baths - beds |
show details | |

|
Check over 1 million property listings on Foreclosure.com!
|
browse all offers | |||


Household type by relationship:
Households: 760,197- In family households: 645,040 (104,343 male householders, 84,996 female householders)
113,673 spouses, 245,726 children (232,723 natural, 5,793 adopted, 7,210 stepchildren), 20,627 grandchildren, 15,422 brothers or sisters, 11,923 parents, foster children, 19,910 other relatives, 22,762 non-relatives
- In nonfamily households: 115,157 (42,135 male householders (33,262 living alone)), 52,238 female householders (45,266 living alone)), 20,784 nonrelatives
- In group quarters: 23,772 (12,126 institutionalized population)
108,634 married couples with children.
65,899 single-parent households (10,059 men, 55,840 women).
80.5% of residents of South Orange speak English at home.
5.4% of residents speak Spanish at home (74% speak English very well, 11% speak English well, 10% speak English not well, 5% don't speak English at all).
9.1% of residents speak other Indo-European language at home (69% speak English very well, 18% speak English well, 12% speak English not well).
2.3% of residents speak Asian or Pacific Island language at home (64% speak English very well, 24% speak English well, 10% speak English not well, 2% don't speak English at all).
2.6% of residents speak other language at home (94% speak English very well, 6% speak English well).
Foreign born population: 4,248 (23.4%)
(58.7% of them are naturalized citizens)
| Here: | 8.9 |
| State: | 6.8 |
| Here: | 4.1 |
| State: | 3.9 |
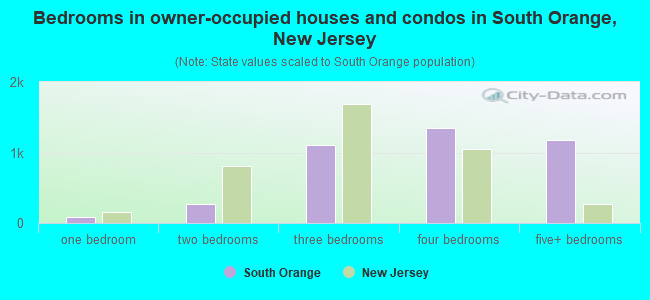
- Bedrooms in owner-occupied houses and condos in South Orange, New Jersey
- 0no bedroom
- 901 bedroom
- 2672 bedrooms
- 1,1103 bedrooms
- 1,3424 bedrooms
- 1,1765+ bedrooms
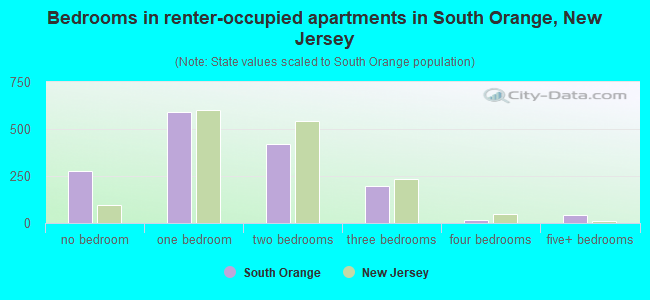
- Bedrooms in renter-occupied apartments in South Orange, New Jersey
- 279no bedroom
- 5881 bedroom
- 4192 bedrooms
- 1953 bedrooms
- 154 bedrooms
- 415+ bedrooms
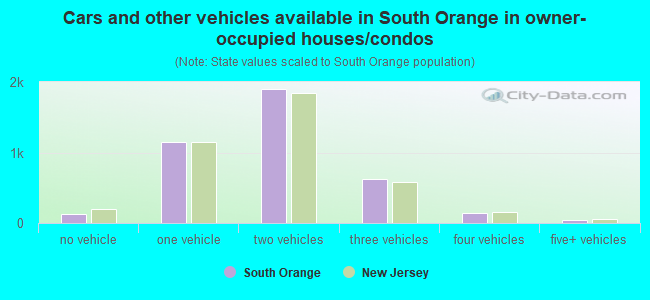
- Cars and other vehicles available in South Orange in owner-occupied houses/condos
- 127no vehicle
- 1,1461 vehicle
- 1,8982 vehicles
- 6273 vehicles
- 1424 vehicles
- 455+ vehicles
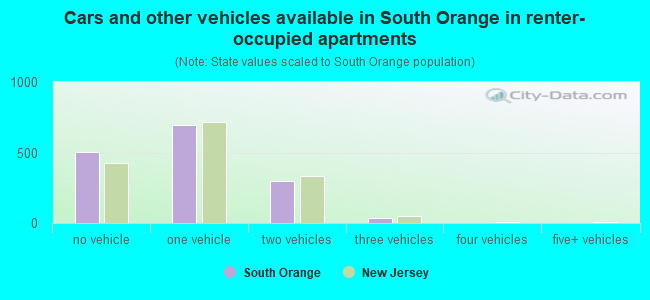
- Cars and other vehicles available in South Orange in renter-occupied apartments
- 507no vehicle
- 6981 vehicle
- 2992 vehicles
- 333 vehicles
- 04 vehicles
- 05+ vehicles
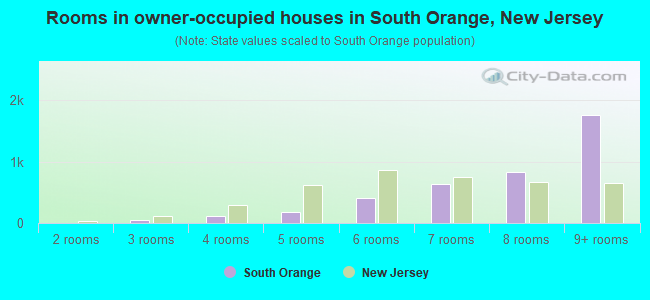
- Rooms in owner-occupied houses in South Orange, New Jersey
- 01 room
- 72 rooms
- 453 rooms
- 1204 rooms
- 1865 rooms
- 4036 rooms
- 6297 rooms
- 8348 rooms
- 1,7619+ rooms
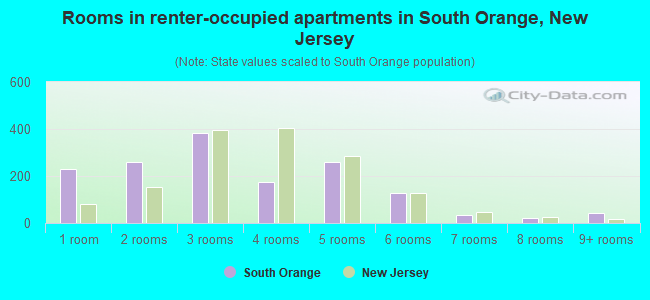
- Rooms in renter-occupied apartments in South Orange, New Jersey
- 2291 room
- 2592 rooms
- 3853 rooms
- 1754 rooms
- 2615 rooms
- 1266 rooms
- 367 rooms
- 238 rooms
- 439+ rooms
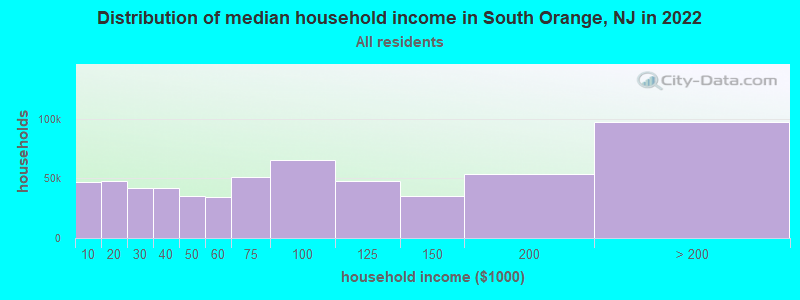
South Orange, NJ household income distribution

- 47,096Less than $10,000
- 47,835$10,000 to $19,999
- 42,195$20,000 to $29,999
- 41,796$30,000 to $39,999
- 35,097$40,000 to $49,999
- 34,225$50,000 to $59,999
- 50,707$60,000 to $74,999
- 65,689$75,000 to $99,999
- 47,448$100,000 to $124,999
- 35,259$125,000 to $149,999
- 53,301$150,000 to $199,999
- 97,212$200,000 or more
Percentage of workers working in this county: 56.1%
Number of people working at home: 1,675 (15.4% of all workers)
Travel time to work (commute)
- Less than 5 minutes: 396
- 5 to 9 minutes: 860
- 10 to 14 minutes: 703
- 15 to 19 minutes: 935
- 20 to 24 minutes: 1,200
- 25 to 29 minutes: 480
- 30 to 34 minutes: 896
- 35 to 39 minutes: 272
- 40 to 44 minutes: 371
- 45 to 59 minutes: 673
- 60 to 89 minutes: 1,146
- 90 or more minutes: 272
Means of transportation to work:
- Drove a car alone: 4,723 (53.6%)
- Carpooled: 625 (7.1%)
- Bus or trolley bus: 252 (2.9%)
- Subway or elevated: 133 (1.5%)
- Railroad: 1,480 (16.8%)
- Walked: 935 (10.6%)
- Other means: 56 (0.6%)
- Worked at home: 601 (6.8%)
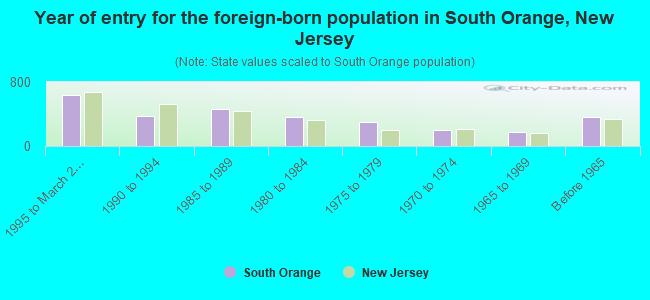
- Year of entry for the foreign-born population in South Orange, New Jersey
- 6351995 to March 2000
- 3811990 to 1994
- 4621985 to 1989
- 3581980 to 1984
- 3041975 to 1979
- 1941970 to 1974
- 1761965 to 1969
- 359Before 1965
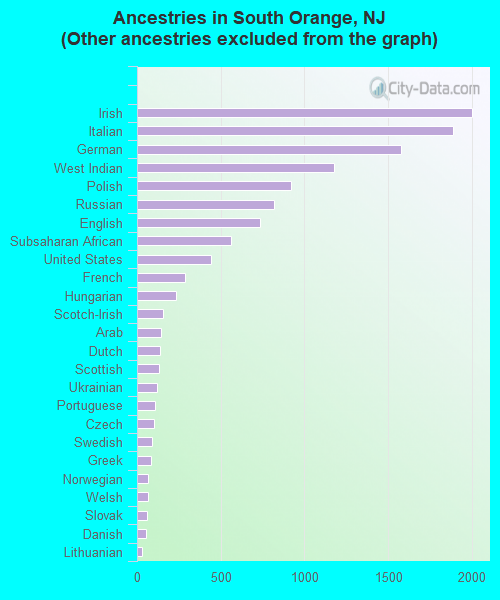
First ancestries reported:
- Other: 6,518 (35.1%)
- Irish: 2,003 (10.8%)
- Italian: 1,887 (10.2%)
- German: 1,580 (8.5%)
- West Indian: 1,177 (6.3%)
- Polish: 921 (5.0%)
- Russian: 819 (4.4%)
- English: 736 (4.0%)
- Subsaharan African: 560 (3.0%)
- United States: 442 (2.4%)
- French: 285 (1.5%)
- Hungarian: 235 (1.3%)
- Scotch-Irish: 154 (0.8%)
- Arab: 145 (0.8%)
- Dutch: 140 (0.8%)
- Scottish: 132 (0.7%)
- Ukrainian: 120 (0.6%)
- Portuguese: 110 (0.6%)
- Czech: 100 (0.5%)
- Swedish: 92 (0.5%)
- Greek: 81 (0.4%)
- Norwegian: 67 (0.4%)
- Welsh: 63 (0.3%)
- Slovak: 58 (0.3%)
- Danish: 53 (0.3%)
- Lithuanian: 27 (0.1%)
- Swiss: 21 (0.1%)
- French Canadian: 19 (0.1%)
Most common places of birth for foreign-born residents (%):
| South Orange: | 13.7% (394) |
| New Jersey: | 2.2% (31,963) |
| South Orange: | 9.7% (277) |
| New Jersey: | 2.5% (36,443) |
| South Orange: | 5.8% (165) |
| New Jersey: | 0.6% (8,389) |
| South Orange: | 4.9% (140) |
| New Jersey: | 1.2% (17,746) |
| South Orange: | 4.0% (116) |
| New Jersey: | 4.6% (67,667) |
| South Orange: | 4.0% (115) |
| New Jersey: | 2.3% (33,531) |
| South Orange: | 3.7% (106) |
| New Jersey: | 2.1% (30,355) |
| South Orange: | 3.6% (103) |
| New Jersey: | 4.0% (58,395) |
| South Orange: | 3.1% (88) |
| New Jersey: | 0.9% (13,289) |
| South Orange: | 2.8% (79) |
| New Jersey: | 1.1% (16,333) |
| South Orange: | 2.6% (76) |
| New Jersey: | 4.7% (69,773) |
| South Orange: | 2.5% (71) |
| New Jersey: | 1.2% (18,066) |
| South Orange: | 2.3% (67) |
| New Jersey: | 8.1% (119,497) |
| South Orange: | 1.7% (48) |
| New Jersey: | 1.5% (22,097) |
| South Orange: | 1.6% (45) |
| New Jersey: | 2.7% (40,092) |
Place of birth for U.S.-born residents:
- This state: 7,639
- Other state: 6,286
- Northeast: 4,184
- Midwest: 680
- South: 1,123
- West: 299
60% of South Orange residents lived in the same house 5 years ago.
Out of people who lived in different houses, 46% lived in this county.
Out of people who lived in different counties, 41% lived in New Jersey.
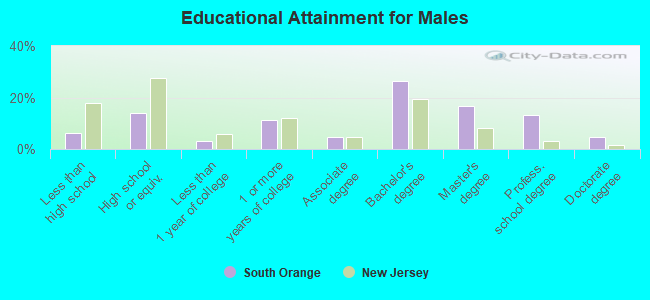
Education attainment for males 25 years and older:
- No schooling: 18
- Nursery to 4th grade: 19
- 5th and 6th grade: 14
- 7th and 8th grade: 57
- 9th grade: 43
- 10th grade: 47
- 11th grade: 36
- 12th grade, no diploma: 70
- High school graduate (or equivalency): 680
- Less than 1 year of college: 143
- Some college more than 1 year, no degree: 552
- Associate degree: 225
- Bachelor's degree: 1,294
- Master's degree: 813
- Professional school degree: 641
- Doctorate degree: 226
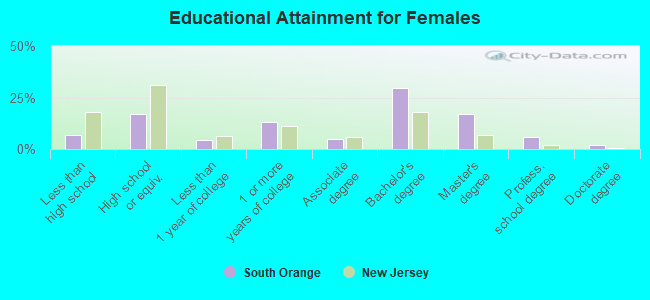
Education attainment for females 25 years and older:
- No schooling: 27
- Nursery to 4th grade: 11
- 5th and 6th grade: 39
- 7th and 8th grade: 63
- 9th grade: 25
- 10th grade: 85
- 11th grade: 42
- 12th grade, no diploma: 83
- High school graduate (or equivalency): 930
- Less than 1 year of college: 231
- Some college more than 1 year, no degree: 719
- Associate degree: 254
- Bachelor's degree: 1,621
- Master's degree: 918
- Professional school degree: 320
- Doctorate degree: 105


Housing units in structures:
- One, detached: 3,841
- One, attached: 104
- Two: 292
- 3 or 4: 131
- 5 to 9: 91
- 10 to 19: 253
- 20 to 49: 635
- 50 or more: 311
- Mobile homes: 13
Housing units lacking complete kitchen facilities: 0.4%
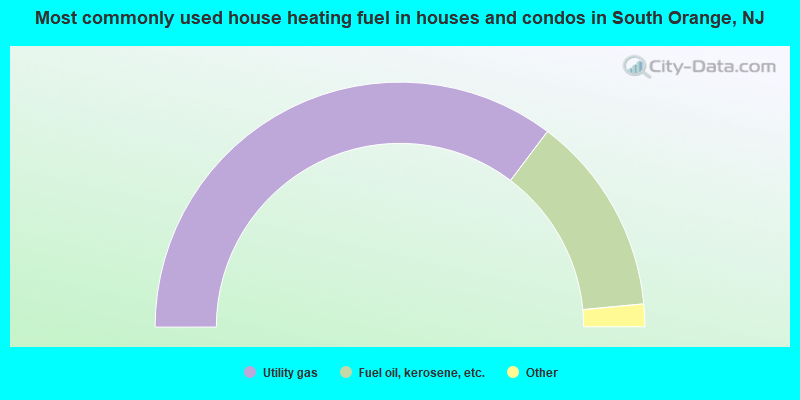
- 70.6%Utility gas
- 26.4%Fuel oil, kerosene, etc.
- 2.4%Electricity
- 0.4%Other fuel
- 0.3%Bottled, tank, or LP gas
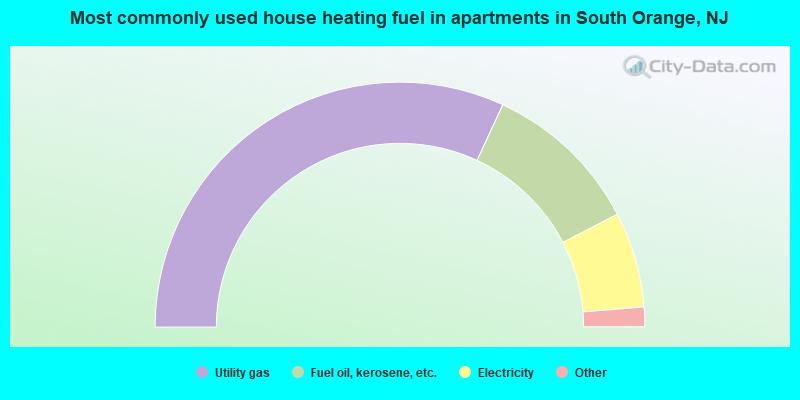
- 63.8%Utility gas
- 21.0%Fuel oil, kerosene, etc.
- 12.6%Electricity
- 1.3%Bottled, tank, or LP gas
- 0.8%No fuel used
- 0.5%Other fuel
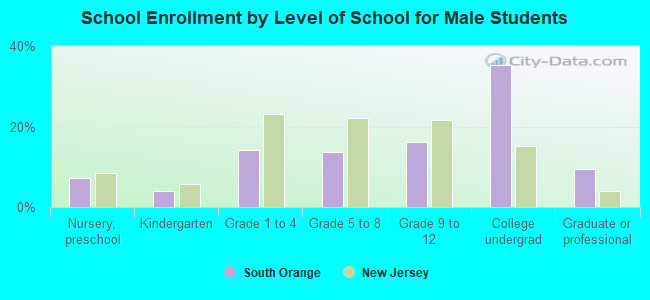
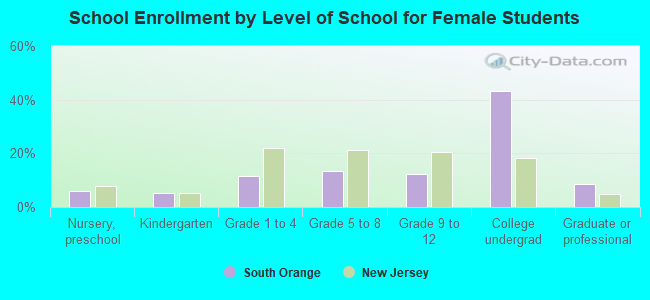
Private vs. public school enrollment:
| Here: | 12.0% |
| New Jersey: | 13.2% |
| Here: | 17.6% |
| New Jersey: | 13.0% |
| Here: | 79.8% |
| New Jersey: | 30.1% |