South Hill, WA (Washington) Houses and Residents
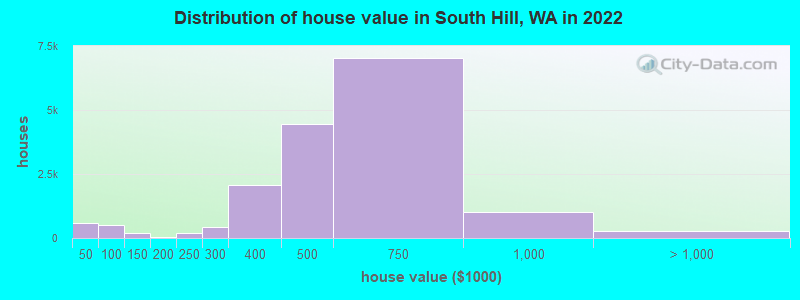
Estimated median house or condo value in 2022: $554,200 (it was $161,100 in 2000 )
South Hill:
$554,200Washington:
$569,500
Lower value quartile - upper value quartile: $431,000 - $672,800Total population: 52,431 (Urban population: 31,551, Rural population: 280 (all nonfarm) )
Houses: 22,594 (22,170 occupied: 15,546 owner occupied, 6,624 renter occupied )
% of renters here:
30%State:
36%
Housing density: 1,255 houses/condos per square mile
Median price asked for vacant for-sale houses and condos in 2022: $512,317.
Median contract rent in 2022: $1,802 (lower quartile is $1,348, upper quartile is over $2,000)
Median rent asked for vacant for-rent units in 2022: $1,510
Median gross rent in South Hill, WA in 2022: $1,922
Housing units in South Hill with a mortgage: 11,952 (799 second mortgage, 71 home equity loan, 728 both second mortgage and home equity loan )Houses without a mortgage: 271
Median household income for houses/condos with a mortgage: $123,579
Median household income for apartments without a mortgage: $137,222
Median monthly housing costs: $1,986
Data:
Median house or condo value ($)
Median house or condo value ($ change since 2000)
Median house or condo value ($) - White
Median house or condo value ($) - Black or African American
Median house or condo value ($) - Asian
Median house or condo value ($) - Hispanic or Latino
Median house or condo value ($) - American Indian and Alaska Native
Median house or condo value ($) - Multirace
Median house or condo value ($) - Other Race
Median price asked for mobile homes ($)
Household density (households per square mile)
Mean house or condo value by units in structure - 1, detached ($)
Mean house or condo value by units in structure - 1, attached ($)
Mean house or condo value by units in structure - 2 ($)
Mean house or condo value by units in structure by units in structure - 3 or 4 ($)
Mean house or condo value by units in structure - 5 or more ($)
Mean house or condo value by units in structure - Boat, RV, van, etc. ($)
Mean house or condo value by units in structure - Mobile home ($)
Median contract rent ($)
Median contract rent - Lower quartile ($)
Median contract rent - Upper quartile ($)
Median gross rent ($)
Urban houses (%)
Rural houses (%)
Houses occupied (%)
Houses occupied (% change since 2000)
Houses owner occupied (%)
Houses owner occupied (% change since 2000)
Houses renter occupied (%)
Houses renter occupied (% change since 2000)
Vacant housing units - For rent (%)
Vacant housing units - For rent (% change since 2000)
Vacant housing units - For sale only (%)
Vacant housing units - For sale only (% change since 2000)
Vacant housing units - Rented or sold, not occupied (%)
Vacant housing units - Rented or sold, not occupied (% change since 2000)
Vacant housing units - For seasonal, recreational, or occasional use (%)
Vacant housing units - For seasonal, recreational, or occasional use (% change since 2000)
Vacant housing units - For migrant workers (%)
Vacant housing units - For migrant workers (% change since 2000)
Vacant housing units - Other vacant (%)
Vacant housing units - Other vacant (% change since 2000)
Median monthly housing costs ($)
Median household income for houses/condos with a mortgage ($)
Median household income for houses/condos without a mortgage ($)
Median household income ($)
Median household income ($) - White
Median household income ($) - Black or African American
Median household income ($) - Asian
Median household income ($) - Hispanic or Latino
Median household income ($) - American Indian and Alaska Native
Median household income ($) - Multirace
Median household income ($) - Other Race
Mortgage status - with mortgage (%)
Mortgage status - with second mortgage (%)
Mortgage status - with home equity loan (%)
Mortgage status - with both second mortgage and home equity loan (%)
Mortgage status - without a mortgage (%)
Median year house/condo built
Median year apartment built
Household type by relationship - Male householder living alone (%)
Household type by relationship - Male householder not living alone (%)
Household type by relationship - Female householder living alone (%)
Household type by relationship - Female householder not living alone (%)
Household type by relationship - Opposite-Sex spouse (%)
Household type by relationship - Same-Sex spouse (%)
Household type by relationship - Opposite-Sex unmarried partner (%)
Household type by relationship - Same-Sex unmarried partner (%)
Household type by relationship - In group quarters (%)
Size of family households - 2-person household (%)
Size of family households - 3-person household (%)
Size of family households - 4-person household (%)
Size of family households - 5-person household (%)
Size of family households - 6-person household (%)
Size of family households - 7-or-more-person household (%)
Size of nonfamily households - 1-person household (%)
Size of nonfamily households - 2-person household (%)
Size of nonfamily households - 3-person household (%)
Size of nonfamily households - 4-person household (%)
Size of nonfamily households - 5-person household (%)
Size of nonfamily households - 6-person household (%)
Size of nonfamily households - 7-or-moreperson household (%)
Year house built - Built 2010 or later (%)
Year house built - Built 2000 to 2009 (%)
Year house built - Built 1990 to 1999 (%)
Year house built - Built 1980 to 1989 (%)
Year house built - Built 1970 to 1979 (%)
Year house built - Built 1960 to 1969 (%)
Year house built - Built 1950 to 1959 (%)
Year house built - Built 1940 to 1949 (%)
Year house built - Built 1939 or earlier (%)
Median number of rooms in houses and condos
Median number of rooms in apartments
Median number of bedrooms in owner occupied houses
Mean number of bedrooms in owner occupied houses
Median number of bedrooms in renter occupied houses
Mean number of bedrooms in renter occupied houses
Median number of vehichles in owner occupied houses
Mean number of vehichles in owner occupied houses
Median number of vehichles in renter occupied houses
Mean number of vehichles in renter occupied houses
Rooms in owner-occupied houses - 1 room (%)
Rooms in owner-occupied houses - 2 rooms (%)
Rooms in owner-occupied houses - 3 rooms (%)
Rooms in owner-occupied houses - 4 rooms (%)
Rooms in owner-occupied houses - 5 rooms (%)
Rooms in owner-occupied houses - 6 rooms (%)
Rooms in owner-occupied houses - 7 rooms (%)
Rooms in owner-occupied houses - 8 rooms (%)
Rooms in owner-occupied houses - 9+ rooms (%)
Rooms in renter-occupied houses - 1 room (%)
Rooms in renter-occupied houses - 2 rooms (%)
Rooms in renter-occupied houses - 3 rooms (%)
Rooms in renter-occupied houses - 4 rooms (%)
Rooms in renter-occupied houses - 5 rooms (%)
Rooms in renter-occupied houses - 6 rooms (%)
Rooms in renter-occupied houses - 7 rooms (%)
Rooms in renter-occupied houses - 8 rooms (%)
Rooms in renter-occupied houses - 9+ rooms (%)
Bedrooms in owner-occupied houses - no bedrooms (%)
Bedrooms in owner-occupied houses - 1 bedroom (%)
Bedrooms in owner-occupied houses - 2 bedrooms (%)
Bedrooms in owner-occupied houses - 3 bedrooms (%)
Bedrooms in owner-occupied houses - 4 bedrooms (%)
Bedrooms in owner-occupied houses - 5+ bedrooms (%)
Bedrooms in renter-occupied houses - no bedrooms (%)
Bedrooms in renter-occupied houses - 1 bedroom (%)
Bedrooms in renter-occupied houses - 2 bedrooms (%)
Bedrooms in renter-occupied houses - 3 bedrooms (%)
Bedrooms in renter-occupied houses - 4 bedrooms (%)
Bedrooms in renter-occupied houses - 5+ bedrooms (%)
Vehicles available in owner-occupied houses - no vehicle available (%)
Vehicles available in owner-occupied houses - 1 vehicle available(%)
Vehicles available in owner-occupied houses - 2 Vehicles available (%)
Vehicles available in owner-occupied houses - 3 Vehicles available (%)
Vehicles available in owner-occupied houses - 4 Vehicles available (%)
Vehicles available in owner-occupied houses - 5+ Vehicles available (%)
Vehicles available in renter-occupied houses - no vehicle available (%)
Vehicles available in renter-occupied houses - 1 vehicle available (%)
Vehicles available in renter-occupied houses - 2 Vehicles available (%)
Vehicles available in renter-occupied houses - 3 Vehicles available (%)
Vehicles available in renter-occupied houses - 4 Vehicles available (%)
Vehicles available in renter-occupied houses - 5+ Vehicles available (%)
Housing units in structures - 1, detached (%)
Housing units in structures - 1, attached (%)
Housing units in structures - 2 (%)
Housing units in structures - 3 or 4 (%)
Housing units in structures - 5 to 9 (%)
Housing units in structures - 10 to 19 (%)
Housing units in structures - 20 to 49 (%)
Housing units in structures - 50 or more (%)
Housing units in structures - Mobile home (%)
Housing units in structures - Boat, RV, van, etc. (%)
Housing units in structures - Owners - 1, detached (%)
Housing units in structures - Owners - 1, attached (%)
Housing units in structures - Owners - 2 (%)
Housing units in structures - Owners - 3 or 4 (%)
Housing units in structures - Owners - 5 to 9 (%)
Housing units in structures - Owners - 10 to 19 (%)
Housing units in structures - Owners - 20 to 49 (%)
Housing units in structures - Owners - 50 or more (%)
Housing units in structures - Owners - Mobile home (%)
Housing units in structures - Owners - Boat, RV, van, etc. (%)
Housing units in structures - Renters - 1, detached (%)
Housing units in structures - Renters - 1, attached (%)
Housing units in structures - Renters - 2 (%)
Housing units in structures - Renters - 3 or 4 (%)
Housing units in structures - Renters - 5 to 9 (%)
Housing units in structures - Renters - 10 to 19 (%)
Housing units in structures - Renters - 20 to 49 (%)
Housing units in structures - Renters - 50 or more (%)
Housing units in structures - Renters - Mobile home (%)
Housing units in structures - Renters - Boat, RV, van, etc. (%)
House/condo owner moved in on average (years ago)
Renter moved in on average (years ago)
Year householder moved into unit - Moved in 1999 to March 2000 (%)
Year householder moved into unit - Moved in 1999 to March 2000 (%) - White
Year householder moved into unit - Moved in 1999 to March 2000 (%) - Black or African American
Year householder moved into unit - Moved in 1999 to March 2000 (%) - Asian
Year householder moved into unit - Moved in 1999 to March 2000 (%) - Hispanic or Latino
Year householder moved into unit - Moved in 1999 to March 2000 (%) - American Indian and Alaska Native
Year householder moved into unit - Moved in 1999 to March 2000 (%) - Multirace
Year householder moved into unit - Moved in 1999 to March 2000 (%) - Other Race
Year householder moved into unit - Moved in 1995 to 1998 (%)
Year householder moved into unit - Moved in 1995 to 1998 (%) - White
Year householder moved into unit - Moved in 1995 to 1998 (%) - Black or African American
Year householder moved into unit - Moved in 1995 to 1998 (%) - Asian
Year householder moved into unit - Moved in 1995 to 1998 (%) - Hispanic or Latino
Year householder moved into unit - Moved in 1995 to 1998 (%) - American Indian and Alaska Native
Year householder moved into unit - Moved in 1995 to 1998 (%) - Multirace
Year householder moved into unit - Moved in 1995 to 1998 (%) - Other Race
Year householder moved into unit - Moved in 1990 to 1994 (%)
Year householder moved into unit - Moved in 1990 to 1994 (%) - White
Year householder moved into unit - Moved in 1990 to 1994 (%) - Black or African American
Year householder moved into unit - Moved in 1990 to 1994 (%) - Asian
Year householder moved into unit - Moved in 1990 to 1994 (%) - Hispanic or Latino
Year householder moved into unit - Moved in 1990 to 1994 (%) - American Indian and Alaska Native
Year householder moved into unit - Moved in 1990 to 1994 (%) - Multirace
Year householder moved into unit - Moved in 1990 to 1994 (%) - Other Race
Year householder moved into unit - Moved in 1980 to 1989 (%)
Year householder moved into unit - Moved in 1980 to 1989 (%) - White
Year householder moved into unit - Moved in 1980 to 1989 (%) - Black or African American
Year householder moved into unit - Moved in 1980 to 1989 (%) - Asian
Year householder moved into unit - Moved in 1980 to 1989 (%) - Hispanic or Latino
Year householder moved into unit - Moved in 1980 to 1989 (%) - American Indian and Alaska Native
Year householder moved into unit - Moved in 1980 to 1989 (%) - Multirace
Year householder moved into unit - Moved in 1980 to 1989 (%) - Other Race
Year householder moved into unit - Moved in 1970 to 1979 (%)
Year householder moved into unit - Moved in 1970 to 1979 (%) - White
Year householder moved into unit - Moved in 1970 to 1979 (%) - Black or African American
Year householder moved into unit - Moved in 1970 to 1979 (%) - Asian
Year householder moved into unit - Moved in 1970 to 1979 (%) - Hispanic or Latino
Year householder moved into unit - Moved in 1970 to 1979 (%) - American Indian and Alaska Native
Year householder moved into unit - Moved in 1970 to 1979 (%) - Multirace
Year householder moved into unit - Moved in 1970 to 1979 (%) - Other Race
Year householder moved into unit - Moved in 1969 or earlier (%)
Year householder moved into unit - Moved in 1969 or earlier (%) - White
Year householder moved into unit - Moved in 1969 or earlier (%) - Black or African American
Year householder moved into unit - Moved in 1969 or earlier (%) - Asian
Year householder moved into unit - Moved in 1969 or earlier (%) - Hispanic or Latino
Year householder moved into unit - Moved in 1969 or earlier (%) - American Indian and Alaska Native
Year householder moved into unit - Moved in 1969 or earlier (%) - Multirace
Year householder moved into unit - Moved in 1969 or earlier (%) - Other Race
Housing units lacking complete plumbing facilities (%)
Housing units lacking complete kitchen facilities (%)
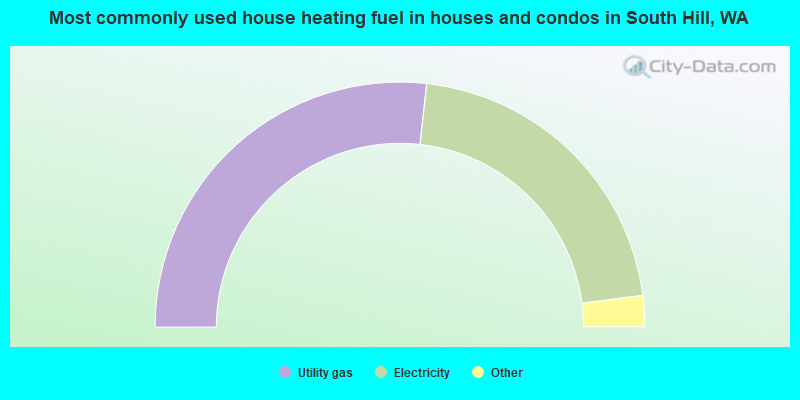
House heating fuel used in houses and condos - Utility gas (%)
House heating fuel used in houses and condos - Bottled, tank, or LP gas (%)
House heating fuel used in houses and condos - Electricity (%)
House heating fuel used in houses and condos - Fuel oil, kerosene, etc. (%)
House heating fuel used in houses and condos - Coal or coke (%)
House heating fuel used in houses and condos - Wood (%)
House heating fuel used in houses and condos - Solar energy (%)
House heating fuel used in houses and condos - Other fuel (%)
House heating fuel used in houses and condos - No fuel used (%)
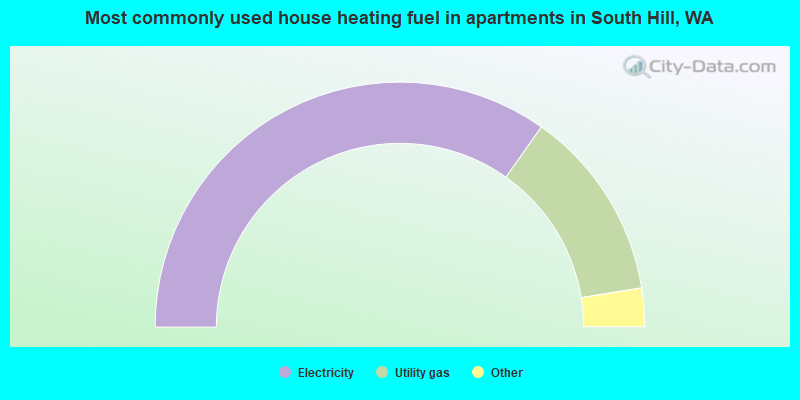
House heating fuel used in apartments - Utility gas (%)
House heating fuel used in apartments - Bottled, tank, or LP gas (%)
House heating fuel used in apartments - Electricity (%)
House heating fuel used in apartments - Fuel oil, kerosene, etc. (%)
House heating fuel used in apartments - Coal or coke (%)
House heating fuel used in apartments - Wood (%)
House heating fuel used in apartments - Solar energy (%)
House heating fuel used in apartments - Other fuel (%)
House heating fuel used in apartments - No fuel used (%)
Median year house/condo built: 1996Median year apartment built: 1996Household type by relationship:
Households: 64,623
Male householders: 12,732 (1,321 living alone ), Female householders: 9,438 (1,356 living alone )12,113 spouses (12,113 opposite-sex spouses ), 2,369 unmarried partners , (2,323 opposite-sex unmarried partners ), 21,456 children (19,015 natural , 884 adopted , 1,557 stepchildren ), 772 grandchildren , 738 brothers or sisters , 1,754 parents , 95 foster children , 805 other relatives , 2,200 non-relatives In group quarters: 151
Size of family households: 6,291 2-persons , 3,903 3-persons , 4,520 4-persons , 1,903 5-persons , 768 6-persons , 290 7-or-more-persons .
Size of nonfamily households: 2,677 1-person , 1,601 2-persons , 217 3-persons .
12,129 married couples with children. single-parent households (1,824 men , 3,027 women ).
83.8% of residents of South Hill speak English at home. of residents speak Spanish at home (68% speak English very well , 23% speak English well , 8% speak English not well , 2% don't speak English at all ).of residents speak other Indo-European language at home (68% speak English very well , 27% speak English well , 3% speak English not well , 2% don't speak English at all ).of residents speak Asian or Pacific Island language at home (59% speak English very well , 28% speak English well , 12% speak English not well , 1% don't speak English at all ).of residents speak other language at home (83% speak English very well , 17% speak English well ).
Foreign born population: 6,948 (10.8%)of them are naturalized citizens )
Median number of rooms in houses and condos:
Median number of rooms in apartments
Owner-occupied Renter-occupied
Rooms in owner-occupied houses in South Hill, Washington
0 1 room 0 2 rooms 52 3 rooms 1,076 4 rooms 2,055 5 rooms 3,778 6 rooms 2,325 7 rooms 3,141 8 rooms 3,119 9+ rooms
Rooms in renter-occupied apartments in South Hill, Washington
40 1 room 363 2 rooms 1,665 3 rooms 2,047 4 rooms 1,048 5 rooms 423 6 rooms 44 7 rooms 302 8 rooms 692 9+ rooms
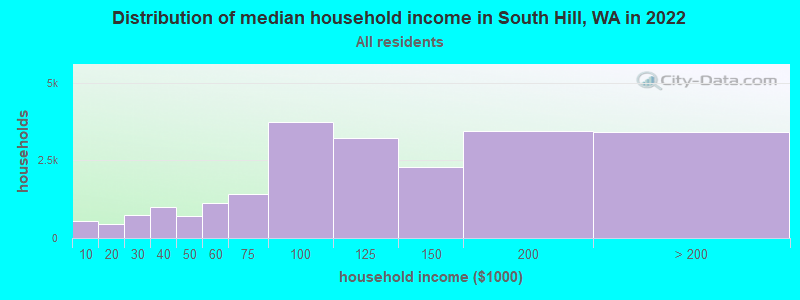
South Hill, WA household income distribution 558 Less than $10,000459 $10,000 to $19,999746 $20,000 to $29,9991,013 $30,000 to $39,999710 $40,000 to $49,9991,134 $50,000 to $59,9991,426 $60,000 to $74,9993,738 $75,000 to $99,9993,235 $100,000 to $124,9992,281 $125,000 to $149,9993,457 $150,000 to $199,9993,413 $200,000 or more
Home value of owner - occupied houses in 2022 in South Hill, WA 90 Less than $10,000121 $15,000 to $19,99964 $25,000 to $29,999137 $30,000 to $34,99967 $35,000 to $39,999121 $40,000 to $49,99978 $50,000 to $59,999128 $60,000 to $69,99955 $70,000 to $79,9994 $80,000 to $89,999116 $90,000 to $99,999132 $100,000 to $124,99973 $125,000 to $149,9999 $150,000 to $174,99937 $175,000 to $199,999207 $200,000 to $249,999417 $250,000 to $299,9992,051 $300,000 to $399,9994,458 $400,000 to $499,9997,045 $500,000 to $749,9991,030 $750,000 to $999,999192 $1,000,000 to $1,499,99914 $1,500,000 to $1,999,99953 $2,000,000 or moreRent paid by renters in 2022 in South Hill, WA 1 $100 to $1497 $450 to $49931 $500 to $54919 $600 to $64919 $800 to $89978 $900 to $999741 $1,000 to $1,249993 $1,250 to $1,4992,838 $1,500 to $1,9991,174 $2,000 to $2,499772 $2,500 to $2,99994 $3,000 to $3,499172 $3,500 or more191 No cash rent
Percentage of workers working in this county: 76.4%Number of people working at home: 5,057 (14.9% of all workers )
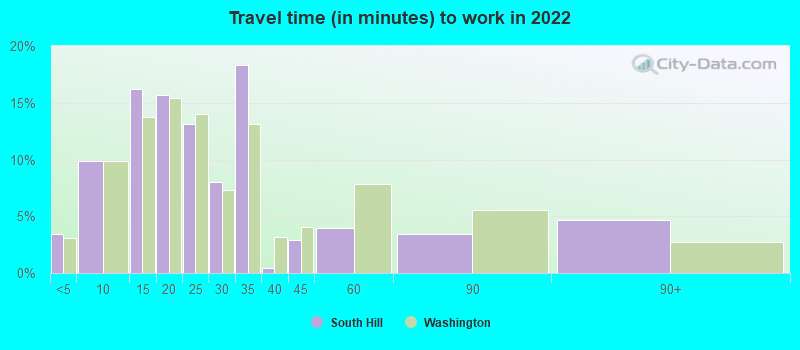
Travel time to work (commute)
Less than 5 minutes: 5245 to 9 minutes: 1,06610 to 14 minutes: 2,44715 to 19 minutes: 2,65420 to 24 minutes: 2,44925 to 29 minutes: 3,36030 to 34 minutes: 4,45335 to 39 minutes: 1,63240 to 44 minutes: 2,42545 to 59 minutes: 4,09260 to 89 minutes: 2,12090 or more minutes: 1,757
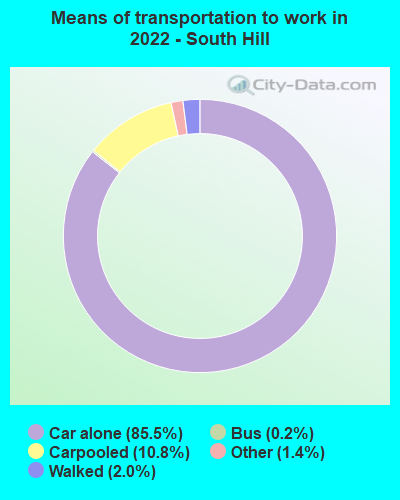
Means of transportation to work:
Drove a car alone: 7,027 (56.2%)Carpooled: 924 (7.4%)Bus : 12 (0.1%)Taxi: 107 (0.9%)Bicycle: 7 (0.1%)Walked: 214 (1.7%)Worked at home: 5,057 (40.5%)
Unemployment by race in 2022
Unemployment rate for White non-Hispanic residents 4.1% MalesUnemployment rate for Black residents 4.5% Males2.8% FemalesUnemployment rate for Asian residents 7.3% Males2.9% FemalesUnemployment rate for other race residents 2.8% Males1.2% FemalesUnemployment rate for two or more race residents 8.1% Males2.8% FemalesUnemployment rate for Hispanic or Latino residents 2.6% Males2.6% Females
Year of entry for the foreign-born population in South Hill, Washington
2,020 2010 or later 1,715 2000 to 2009 2,042 1990 to 1999 402 1980 to 1989 307 1970 to 1979 572 Before 1970
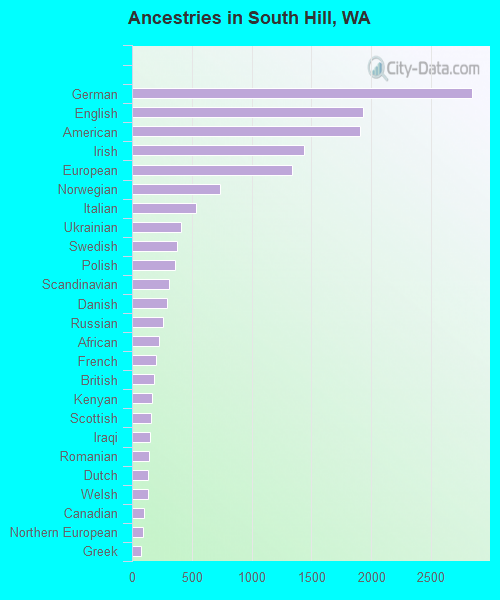
First ancestries reported:
German: 2,845 (10.6%)
English: 1,937 (7.2%)
American: 1,905 (7.1%)
Irish: 1,443 (5.4%)
European: 1,341 (5.0%)
Norwegian: 733 (2.7%)
Italian: 532 (2.0%)
Ukrainian: 409 (1.5%)
Swedish: 373 (1.4%)
Polish: 358 (1.3%)
Scandinavian: 313 (1.2%)
Danish: 295 (1.1%)
Russian: 263 (1.0%)
African: 227 (0.8%)
French: 203 (0.8%)
British: 186 (0.7%)
Kenyan: 169 (0.6%)
Scottish: 159 (0.6%)
Iraqi: 147 (0.5%)
Romanian: 141 (0.5%)
Dutch: 138 (0.5%)
Welsh: 130 (0.5%)
Canadian: 102 (0.4%)
Northern European: 94 (0.4%)
Greek: 79 (0.3%)
Somali: 71 (0.3%)
Scotch-Irish: 63 (0.2%)
Eastern European: 50 (0.2%)
Lebanese: 47 (0.2%)
Belgian: 46 (0.2%)
Finnish: 45 (0.2%)
Brazilian: 40 (0.1%)
French Canadian: 38 (0.1%)
Swiss: 34 (0.1%)
Iranian: 31 (0.1%)
Czechoslovakian: 29 (0.1%)
South African: 29 (0.1%)
Portuguese: 24 (0.09%)
Czech: 21 (0.08%)
Trinidadian and Tobagonian: 20 (0.07%)
Austrian: 14 (0.05%)
Hungarian: 13 (0.05%)
Haitian: 12 (0.04%)
Slovak: 12 (0.04%)
Latvian: 10 (0.04%)
Sierra Leonean: 9 (0.03%)
Slavic: 9 (0.03%)
Slovene: 8 (0.03%)
Croatian: 7 (0.03%)
Lithuanian: 4 (0.01%)
Pennsylvania German: 3 (0.01%)
Most common places of birth for foreign-born residents (%): Mexico South Hill:
19.9% (1,413)Washington:
21.1% (241,655)
Korea South Hill:
8.0% (571)Washington:
4.3% (48,886)
Philippines South Hill:
7.4% (528)Washington:
6.3% (71,661)
Ukraine South Hill:
4.7% (332)Washington:
3.1% (35,872)
Canada South Hill:
4.3% (306)Washington:
4.1% (47,238)
India South Hill:
4.0% (288)Washington:
8.9% (101,353)
Cambodia South Hill:
3.5% (251)Washington:
1.0% (10,993)
Moldova South Hill:
3.4% (244)Washington:
0.4% (4,536)
Japan South Hill:
3.3% (232)Washington:
1.5% (17,453)
China, excluding Hong Kong and Taiwan South Hill:
3.2% (227)Washington:
7.4% (84,470)
Jamaica South Hill:
3.0% (213)Washington:
0.3% (3,471)
Germany South Hill:
2.8% (198)Washington:
1.6% (17,761)
Kenya South Hill:
2.7% (193)Washington:
1.1% (12,735)
Vietnam South Hill:
2.3% (165)Washington:
5.4% (62,003)
Honduras South Hill:
2.2% (160)Washington:
0.6% (6,500)
Russia South Hill:
1.9% (136)Washington:
1.9% (21,540)
Uganda South Hill:
1.8% (131)Washington:
0.2% (1,754)
Iraq South Hill:
1.8% (131)Washington:
0.5% (6,259)
Other Western Africa South Hill:
1.7% (120)Washington:
0.3% (3,638)
Place of birth for U.S.-born residents:
This state: 33,085Other state: 22,710Northeast: 1,112Midwest: 4,696South: 5,648West: 11,254 86.0% of South Hill residents lived in the same house 1 years ago.
Out of people who lived in different houses, 37.0% lived in this county.
Out of people who lived in different counties, 64.1% lived in Washington.
South Hill:
86.0%State average:
85.2%
Education attainment for males 25 years and older:
No schooling: 0Nursery to 4th grade: 05th and 6th grade: 07th and 8th grade: 09th grade: 6910th grade: 29411th grade: 4412th grade, no diploma: 917High school graduate (or equivalency): 4,626Less than 1 year of college: 2,237Some college more than 1 year, no degree: 4,137Associate degree: 1,716Bachelor's degree: 3,797Master's degree: 1,870Professional school degree: 402Doctorate degree: 223
Education attainment for females 25 years and older:
No schooling: 88Nursery to 4th grade: 05th and 6th grade: 07th and 8th grade: 459th grade: 010th grade: 20111th grade: 012th grade, no diploma: 332High school graduate (or equivalency): 5,933Less than 1 year of college: 1,508Some college more than 1 year, no degree: 2,728Associate degree: 2,343Bachelor's degree: 5,327Master's degree: 1,814Professional school degree: 110Doctorate degree: 406
Housing units in structures:
One, detached: 16,518One, attached: 1,265Two: 4483 or 4: 1,2335 to 9: 52310 to 19: 91320 to 49: 16250 or more: 591Mobile homes: 941Median worth of mobile homes: $112,800
Housing units lacking complete plumbing facilities in 2022: 0.2%Housing units lacking complete kitchen facilities in 2022: 0.5%House/condo owner moved in on average 8 years ago
Renter moved in on average 2 years ago
Private vs. public school enrollment:
Students in private schools in grades 1 to 8 (elementary and middle school): 728 Here:
9.0%Washington:
12.4%
Students in private schools in grades 9 to 12 (high school): 468 Here:
11.9%Washington:
9.2%
Students in private undergraduate colleges: 551 Here:
18.3%Washington:
16.5%