Housing density: 1,121 houses/condos per square mile
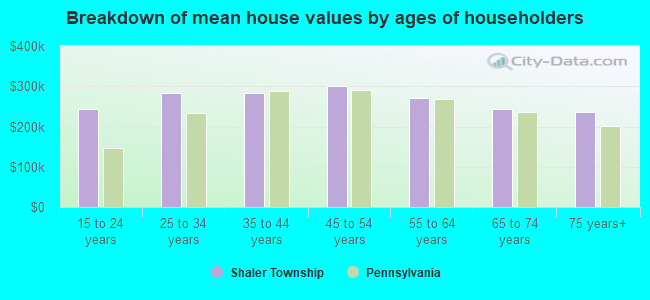
Median price asked for vacant for-sale houses and condos in 2022 in this county: $195,117.
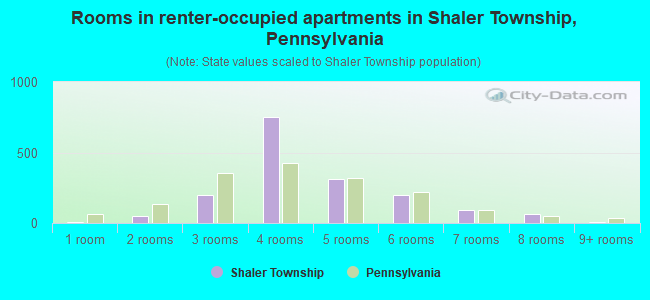
Median contract rent in 2022: $1,018 (lower quartile is $804, upper quartile is $1,219)
Median rent asked for vacant for-rent units in 2022: $1,147
Median gross rent in Shaler Township, PA in 2022: $1,209
Housing units in Shaler Township with a mortgage: 5,748 (627 second mortgage, 1,106 home equity loan, 36 both second mortgage and home equity loan) Houses without a mortgage: 4,098
Compare current foreclosures near Shaler Township, PA:
In family households: 913,516 (208,635 male householders, 99,374 female householders)
222,332 spouses, 315,393 children (298,168 natural, 7,619 adopted, 9,606 stepchildren), 18,457 grandchildren, 9,985 brothers or sisters, 8,652 parents, foster children, 7,846 other relatives, 18,452 non-relatives
In nonfamily households: 274,778 (100,758 male householders (79,382 living alone)), 125,193 female householders (107,576 living alone)), 48,827 nonrelatives
In group quarters: 35,054 (13,287 institutionalized population)
186,963 married couples with children.
71,829 single-parent households (11,403 men, 60,426 women).
94.3% of residents of Shaler Township speak English at home.
1.4% of residents speak Spanish at home (76% speak English very well, 17% speak English well, 6% speak English not well).
3.4% of residents speak other Indo-European language at home (75% speak English very well, 18% speak English well, 6% speak English not well).
0.6% of residents speak Asian or Pacific Island language at home (70% speak English very well, 10% speak English well, 15% speak English not well, 6% don't speak English at all).
0.2% of residents speak other language at home (90% speak English very well, 10% speak English well).
Foreign born population: 1,108 (3.9%)
(66.5% of them are naturalized citizens)
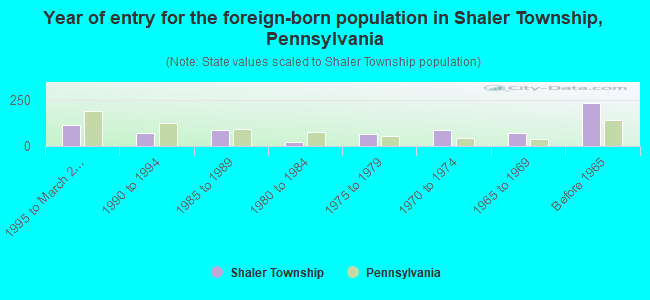
Year of entry for the foreign-born population in Shaler Township, Pennsylvania
1141995 to March 2000
681990 to 1994
881985 to 1989
241980 to 1984
661975 to 1979
871970 to 1974
721965 to 1969
231Before 1965
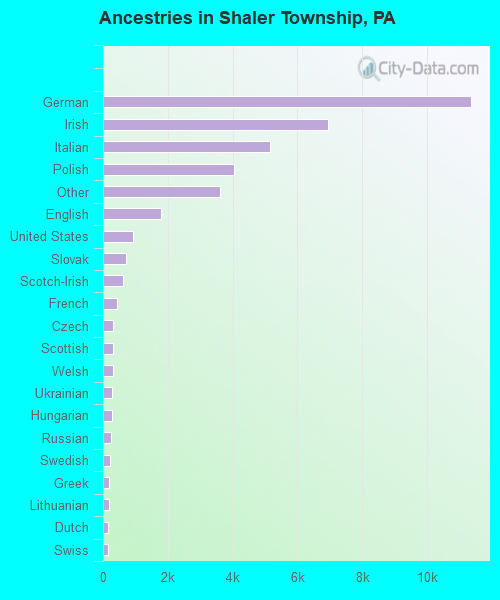
First ancestries reported:
German: 11,348 (29.5%)
Irish: 6,937 (18.1%)
Italian: 5,169 (13.5%)
Polish: 4,059 (10.6%)
Other: 3,618 (9.4%)
English: 1,798 (4.7%)
United States: 918 (2.4%)
Slovak: 711 (1.9%)
Scotch-Irish: 612 (1.6%)
French: 417 (1.1%)
Czech: 324 (0.8%)
Scottish: 320 (0.8%)
Welsh: 294 (0.8%)
Ukrainian: 288 (0.7%)
Hungarian: 274 (0.7%)
Russian: 251 (0.7%)
Swedish: 211 (0.5%)
Greek: 191 (0.5%)
Lithuanian: 190 (0.5%)
Dutch: 157 (0.4%)
Swiss: 147 (0.4%)
Arab: 83 (0.2%)
French Canadian: 40 (0.1%)
Norwegian: 28 (0.07%)
Subsaharan African: 14 (0.04%)
Portuguese: 10 (0.03%)
West Indian: 6 (0.02%)
Danish: 5 (0.01%)
Most common places of birth for foreign-born residents (%):
Italy
Shaler Township:
23.9% (179)
Pennsylvania:
6.0% (30,559)
India
Shaler Township:
12.8% (96)
Pennsylvania:
7.4% (37,541)
Canada
Shaler Township:
6.8% (51)
Pennsylvania:
3.0% (15,200)
Taiwan
Shaler Township:
5.5% (41)
Pennsylvania:
1.1% (5,442)
Cuba
Shaler Township:
4.0% (30)
Pennsylvania:
0.8% (3,914)
Korea
Shaler Township:
3.7% (28)
Pennsylvania:
5.3% (26,703)
United Kingdom
Shaler Township:
3.7% (28)
Pennsylvania:
4.6% (23,171)
Yugoslavia
Shaler Township:
3.7% (28)
Pennsylvania:
0.7% (3,328)
Germany
Shaler Township:
3.3% (25)
Pennsylvania:
5.1% (25,685)
Argentina
Shaler Township:
3.2% (24)
Pennsylvania:
0.5% (2,409)
Spain
Shaler Township:
3.1% (23)
Pennsylvania:
0.3% (1,422)
Asia, n.e.c.
Shaler Township:
1.9% (14)
Pennsylvania:
0.1% (695)
Pakistan
Shaler Township:
1.7% (13)
Pennsylvania:
0.8% (4,160)
Hungary
Shaler Township:
1.6% (12)
Pennsylvania:
0.7% (3,762)
Russia
Shaler Township:
1.6% (12)
Pennsylvania:
2.7% (13,885)
Other South Central Asia
Shaler Township:
1.6% (12)
Pennsylvania:
0.3% (1,772)
Place of birth for U.S.-born residents:
This state: 26,231
Other state: 2,596
Northeast: 662
Midwest: 953
South: 710
West: 271
73% of Shaler Township residents lived in the same house 5 years ago. Out of people who lived in different houses, 81% lived in this county. Out of people who lived in different counties, 48% lived in Pennsylvania.
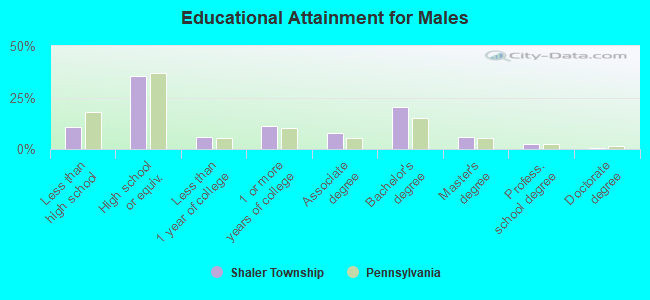
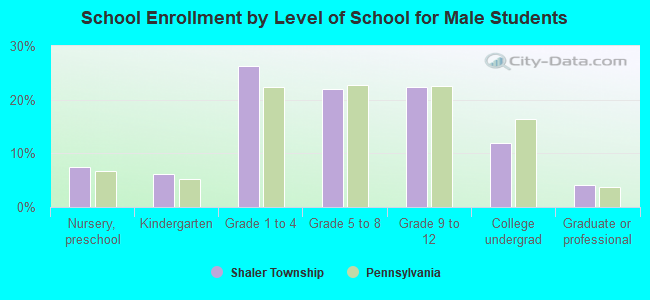
Education attainment for males 25 years and older:
No schooling: 93
Nursery to 4th grade: 7
5th and 6th grade: 41
7th and 8th grade: 165
9th grade: 123
10th grade: 236
11th grade: 140
12th grade, no diploma: 256
High school graduate (or equivalency): 3,591
Less than 1 year of college: 593
Some college more than 1 year, no degree: 1,105
Associate degree: 764
Bachelor's degree: 2,072
Master's degree: 609
Professional school degree: 227
Doctorate degree: 52
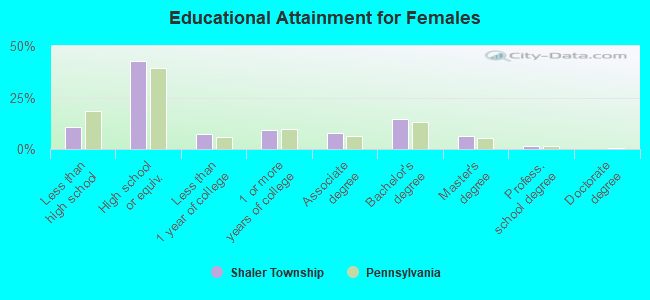
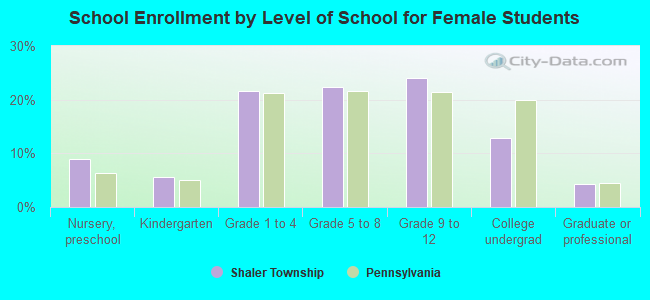
Education attainment for females 25 years and older:
No schooling: 71
Nursery to 4th grade: 0
5th and 6th grade: 79
7th and 8th grade: 237
9th grade: 112
10th grade: 266
11th grade: 208
12th grade, no diploma: 239
High school graduate (or equivalency): 4,943
Less than 1 year of college: 855
Some college more than 1 year, no degree: 1,035
Associate degree: 887
Bachelor's degree: 1,697
Master's degree: 709
Professional school degree: 156
Doctorate degree: 23
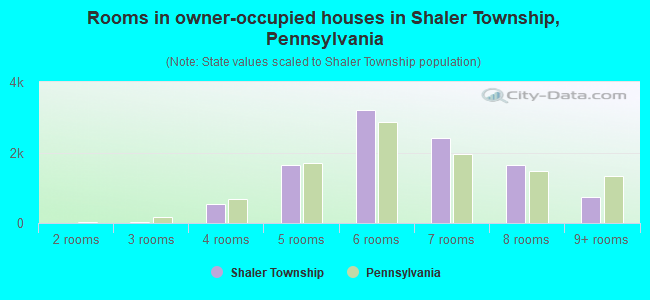
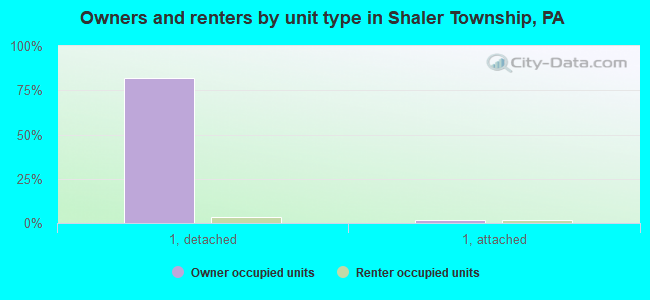
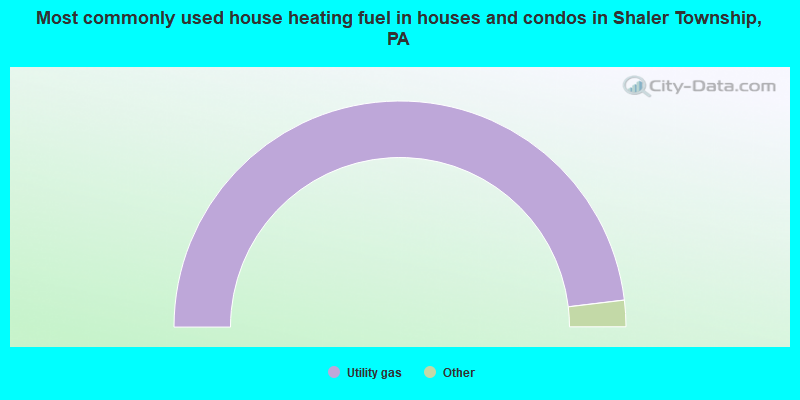
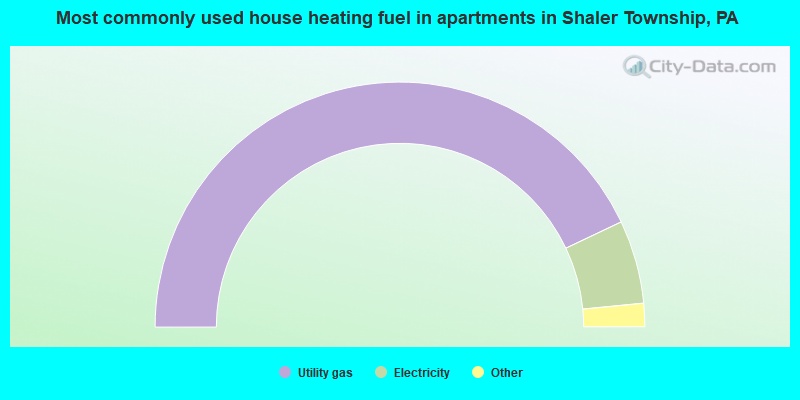
Housing units in structures:
One, detached: 10,458
One, attached: 476
Two: 314
3 or 4: 350
5 to 9: 178
10 to 19: 300
20 to 49: 141
50 or more: 23
Mobile homes: 85
Boats, RVs, vans, etc.: 9
Median worth of mobile homes: $31,173
Housing units lacking complete plumbing facilities: 0.1%
Housing units lacking complete kitchen facilities: 0.1%