Searcy, AR (Arkansas) Houses and Residents
| Searcy: | $178,771 |
| Arkansas: | $179,800 |
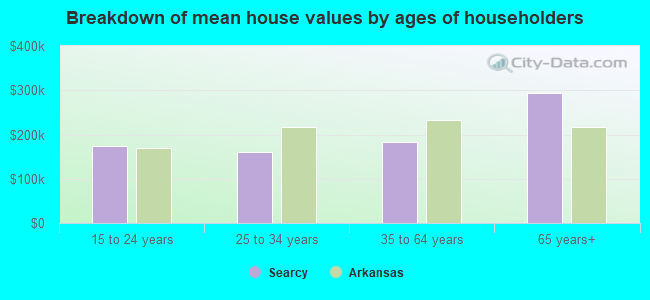
Mean price in 2022:
Detached houses: $297,471
Here: $297,471 State: $243,881 Townhouses or other attached units: $184,160
Here: $184,160 State: $244,376 In 3-to-4-unit structures: $156,733
Here: $156,733 State: $216,658 Mobile homes: $86,543
Here: $86,543 State: $79,566
Total population: 23,983 (Urban population: 18,904 (all inside urban clusters), Rural population: 91 (all nonfarm))
Houses: 9,753 (8,431 occupied: 4,372 owner occupied, 4,272 renter occupied)
| % of renters here: | 49% |
| State: | 34% |
Housing density: 663 houses/condos per square mile
Median price asked for vacant for-sale houses and condos in 2022: $65,843.
Median contract rent in 2022: $687 (lower quartile is $526, upper quartile is $802)
Median rent asked for vacant for-rent units in 2022: $468
Median gross rent in Searcy, AR in 2022: $843
Housing units in Searcy with a mortgage: 2,709 (99 second mortgage, 0 home equity loan, 73 both second mortgage and home equity loan)
Houses without a mortgage: 33
Median household income for houses/condos with a mortgage: $76,415
Median household income for apartments without a mortgage: $49,820
Median monthly housing costs: $873
Compare current foreclosures in Searcy, AR:
| Photo | Address | Area | Beds / Baths | Price | Details |
|---|---|---|---|---|---|

|
#1
Smith Rd
Searcy, AR 72143
|
1,842 sq. feet
|
3 baths 4 beds |
show details | |

|
#2
Julner Dr
Searcy, AR 72143
|
1,736 sq. feet
|
2 baths 3 beds |
show details | |

|
#3
Billy Davis Dr
Searcy, AR 72143
|
2,345 sq. feet
|
3 baths 4 beds |
show details | |

|
#4
Sibley Trl
Searcy, AR 72143
|
1,970 sq. feet
|
3 baths 3 beds |
show details | |

|
#5
W Woodruff Ave
Searcy, AR 72143
|
- sq. feet
|
- baths - beds |
$54,900
|
show details |

|
#6
Whippoorwill Dr
Searcy, AR 72143
|
1,572 sq. feet
|
2 baths 3 beds |
show details | |

|
#7
N Spring St
Searcy, AR 72143
|
1,906 sq. feet
|
2 baths - beds |
show details | |

|
#8
Indian Trl
Searcy, AR 72143
|
2,173 sq. feet
|
2 baths - beds |
show details | |

|
#9
Randall Cv
Searcy, AR 72143
|
2,360 sq. feet
|
1 baths - beds |
show details | |

|
#10
Laura Ln
Searcy, AR 72143
|
1,400 sq. feet
|
2 baths - beds |
show details |
| Photo | Address | Area | Beds / Baths | Price | Details |
|---|---|---|---|---|---|

|
#11
Country Squire Ln
Searcy, AR 72143
|
997 sq. feet
|
2 baths - beds |
show details | |

|
#12
Lynwood Dr
Searcy, AR 72143
|
1,626 sq. feet
|
2 baths - beds |
show details | |

|
#13
Golf Course Dr
Searcy, AR 72143
|
4,458 sq. feet
|
4 baths - beds |
show details | |

|
#14
Clara St
Searcy, AR 72143
|
1,895 sq. feet
|
2 baths - beds |
show details | |

|
#15
Audley Bolton Dr
Searcy, AR 72143
|
1,845 sq. feet
|
2 baths - beds |
show details | |

|
#16
Cloverdale Blvd
Searcy, AR 72143
|
1,605 sq. feet
|
2 baths - beds |
show details | |

|
#17
W Country Club Rd
Searcy, AR 72143
|
1,815 sq. feet
|
2 baths - beds |
show details | |

|
#18
Collins Rd
Searcy, AR 72143
|
1,963 sq. feet
|
2 baths - beds |
show details | |

|
#19
N Oak St
Searcy, AR 72143
|
1,260 sq. feet
|
1 baths - beds |
show details | |

|
#20
Fernhill Pl
Searcy, AR 72143
|
1,335 sq. feet
|
1 baths - beds |
show details |
| Photo | Address | Area | Beds / Baths | Price | Details |
|---|---|---|---|---|---|

|
#21
Vineyard Pl
Searcy, AR 72143
|
1,624 sq. feet
|
2 baths - beds |
show details | |

|
#22
Deer Ridge Dr
Searcy, AR 72143
|
1,379 sq. feet
|
2 baths - beds |
show details | |

|
#23
Live Oak Dr
Searcy, AR 72143
|
2,080 sq. feet
|
3 baths - beds |
show details | |

|
#24
Ethel Dr
Searcy, AR 72143
|
1,356 sq. feet
|
1 baths - beds |
show details | |

|
#25
Sherwood Loop
Searcy, AR 72143
|
1,346 sq. feet
|
2 baths - beds |
show details | |

|
#26
Hartwell Pl
Searcy, AR 72143
|
1,122 sq. feet
|
1 baths - beds |
show details | |

|
#27
Brookhaven Rd
Searcy, AR 72143
|
1,300 sq. feet
|
1 baths - beds |
show details | |

|
#28
King Ave
Searcy, AR 72143
|
1,056 sq. feet
|
1 baths - beds |
show details | |

|
#29
S Pyeatt St
Searcy, AR 72143
|
1,892 sq. feet
|
1 baths - beds |
show details | |

|
#30
W Highway 36
Searcy, AR 72143
|
800 sq. feet
|
1 baths - beds |
show details |
| Photo | Address | Area | Beds / Baths | Price | Details |
|---|---|---|---|---|---|

|
#31
Koa Rd
Searcy, AR 72143
|
860 sq. feet
|
1 baths - beds |
show details | |

|
#32
Lelia Ln
Searcy, AR 72143
|
1,306 sq. feet
|
2 baths - beds |
show details | |

|
#33
N Sowell St
Searcy, AR 72143
|
1,112 sq. feet
|
1 baths - beds |
show details | |

|
#34
W Baker St
Searcy, AR 72143
|
- sq. feet
|
- baths - beds |
show details | |

|
#35
Garden Dr
Searcy, AR 72143
|
- sq. feet
|
- baths - beds |
show details | |

|
#36
Roundabout Cir
Searcy, AR 72143
|
- sq. feet
|
- baths - beds |
show details | |

|
#37
Wild Cat Loop
Searcy, AR 72143
|
- sq. feet
|
- baths - beds |
show details | |

|
#38
Highway 267 S
Searcy, AR 72143
|
- sq. feet
|
- baths - beds |
show details | |

|
#39
E Race Ave Apt A24
Searcy, AR 72143
|
- sq. feet
|
- baths - beds |
show details | |

|
#40
Mohawk Dr
Searcy, AR 72143
|
- sq. feet
|
- baths - beds |
show details |
| Photo | Address | Area | Beds / Baths | Price | Details |
|---|---|---|---|---|---|

|
#41
Natalie Cir
Searcy, AR 72143
|
- sq. feet
|
- baths - beds |
show details | |

|
#42
N Sowell St
Searcy, AR 72143
|
- sq. feet
|
- baths - beds |
show details | |

|
#43
N Locust St
Searcy, AR 72143
|
862 sq. feet
|
- baths - beds |
show details | |

|
#44
Headlee Heights Dr
Searcy, AR 72143
|
- sq. feet
|
- baths - beds |
show details | |

|
#45
Dustin Ct
Searcy, AR 72143
|
- sq. feet
|
- baths - beds |
show details | |

|
#46
Holmes Rd
Searcy, AR 72143
|
- sq. feet
|
- baths - beds |
show details | |

|
#47
Morris School Rd
Searcy, AR 72143
|
- sq. feet
|
- baths - beds |
show details | |

|
#48
Highway 367 S
Searcy, AR 72143
|
- sq. feet
|
- baths - beds |
show details | |

|
#49
Mountain View Cir
Searcy, AR 72143
|
1,560 sq. feet
|
- baths - beds |
show details | |

|
Check over 1 million property listings on Foreclosure.com!
|
browse all offers | |||

Latest news about housing in Searcy, AR collected exclusively by city-data.com from local newspapers, TV, and radio stations

 | Searcy and Meadow Lake apartments (0 replies) |
| Searcy (21 replies) |
| Historic weather event (54 replies) |
| searching for unique towns in Arkansas to settle (33 replies) |
| Possible job relocation to Searcy (0 replies) |
| Moving to Arkadelphia (11 replies) |

Median year apartment built: 1997
Household type by relationship:
Households: 23,150- Male householders: 3,735 (1,188 living alone), Female householders: 4,683 (1,787 living alone)
3,077 spouses (3,043 opposite-sex spouses), 242 unmarried partners, (207 opposite-sex unmarried partners), 5,751 children (5,328 natural, 154 adopted, 268 stepchildren), 412 grandchildren, 173 brothers or sisters, 363 parents, 31 foster children, 394 other relatives, 1,176 non-relatives
- In group quarters: 3,108
Size of family households: 2,299 2-persons, 1,138 3-persons, 1,040 4-persons, 297 5-persons, 172 6-persons, 177 7-or-more-persons.
Size of nonfamily households: 3,019 1-person, 265 2-persons, 85 3-persons, 11 4-persons, 44 5-persons, 7 6-persons.
2,649 married couples with children.
1,841 single-parent households (413 men, 1,428 women).
92.7% of residents of Searcy speak English at home.
5.2% of residents speak Spanish at home (91% speak English very well, 5% speak English well, 1% speak English not well, 3% don't speak English at all).
1.8% of residents speak other Indo-European language at home (82% speak English very well, 9% speak English well, 9% speak English not well).
0.5% of residents speak Asian or Pacific Island language at home (47% speak English very well, 53% speak English well).
0.1% of residents speak other language at home (100% speak English very well).
Foreign born population: 693 (3.0%)
(35.9% of them are naturalized citizens)
| Here: | 5.9 |
| State: | 6.1 |
| Here: | 4.2 |
| State: | 4.3 |
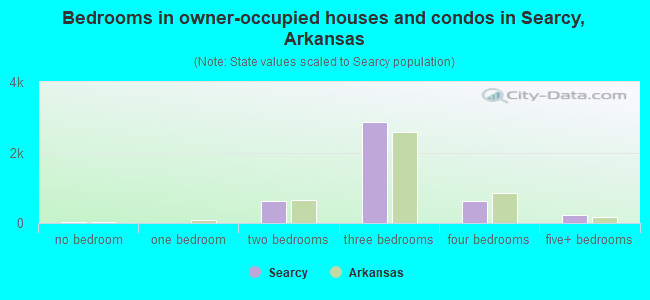
- Bedrooms in owner-occupied houses and condos in Searcy, Arkansas
- 35no bedroom
- 131 bedroom
- 6132 bedrooms
- 2,8793 bedrooms
- 6104 bedrooms
- 2225+ bedrooms
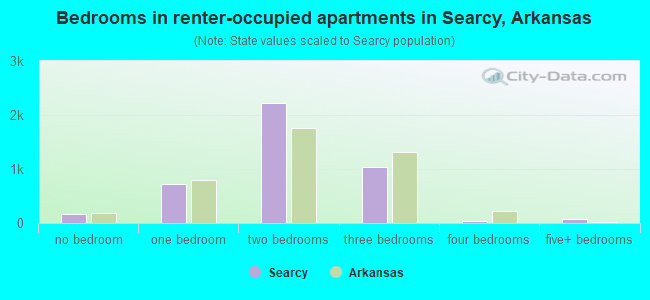
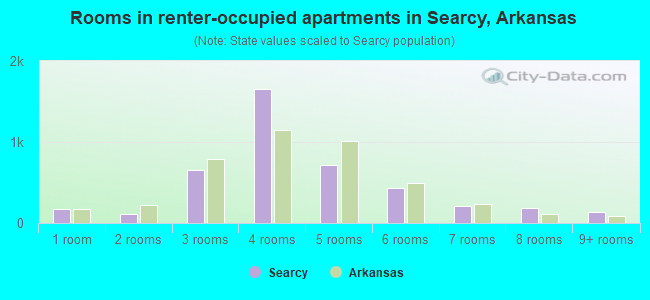
- Bedrooms in renter-occupied apartments in Searcy, Arkansas
- 172no bedroom
- 7201 bedroom
- 2,2172 bedrooms
- 1,0463 bedrooms
- 394 bedrooms
- 805+ bedrooms
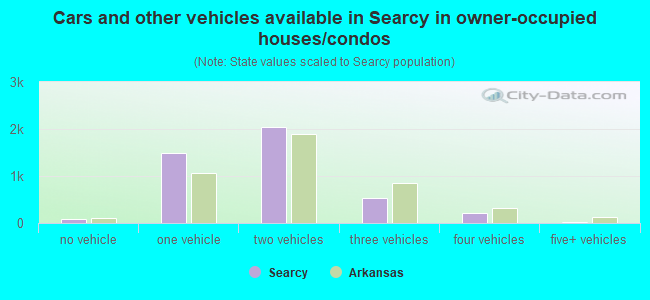
- Cars and other vehicles available in Searcy in owner-occupied houses/condos
- 79no vehicle
- 1,4811 vehicle
- 2,0502 vehicles
- 5253 vehicles
- 2124 vehicles
- 265+ vehicles
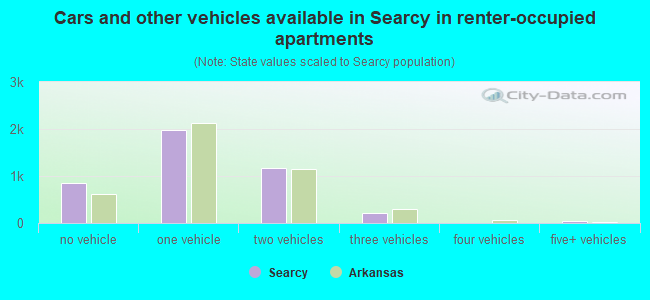
- Cars and other vehicles available in Searcy in renter-occupied apartments
- 848no vehicle
- 1,9871 vehicle
- 1,1782 vehicles
- 2173 vehicles
- 04 vehicles
- 425+ vehicles
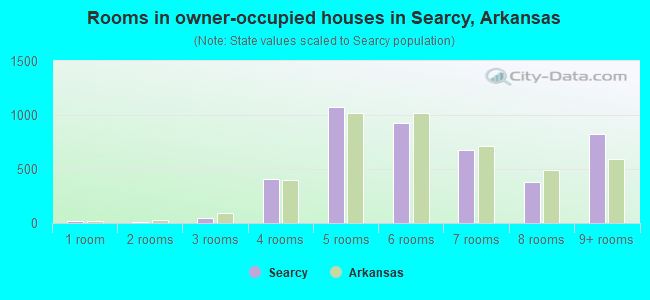
- Rooms in owner-occupied houses in Searcy, Arkansas
- 211 room
- 132 rooms
- 493 rooms
- 4034 rooms
- 1,0775 rooms
- 9296 rooms
- 6757 rooms
- 3788 rooms
- 8289+ rooms
- Rooms in renter-occupied apartments in Searcy, Arkansas
- 1721 room
- 1122 rooms
- 6493 rooms
- 1,6604 rooms
- 7195 rooms
- 4266 rooms
- 2137 rooms
- 1898 rooms
- 1349+ rooms
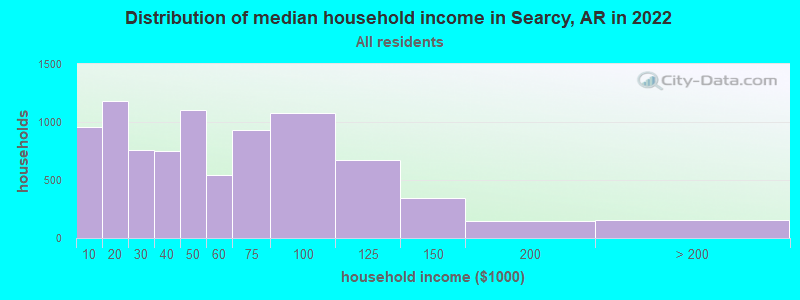
Searcy, AR household income distribution

- 953Less than $10,000
- 1,181$10,000 to $19,999
- 762$20,000 to $29,999
- 747$30,000 to $39,999
- 1,100$40,000 to $49,999
- 541$50,000 to $59,999
- 935$60,000 to $74,999
- 1,074$75,000 to $99,999
- 672$100,000 to $124,999
- 349$125,000 to $149,999
- 145$150,000 to $199,999
- 159$200,000 or more
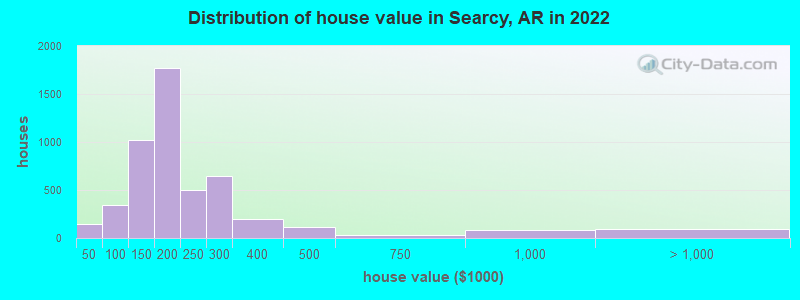
Home value of owner - occupied houses in 2022 in Searcy, AR
-
- 66Less than $10,000
- 7$10,000 to $14,999
- 48$15,000 to $19,999
- 10$20,000 to $24,999
- 9$40,000 to $49,999
- 8$50,000 to $59,999
- 11$60,000 to $69,999
- 93$70,000 to $79,999
- 111$80,000 to $89,999
- 109$90,000 to $99,999
- 866$100,000 to $124,999
- 151$125,000 to $149,999
- 924$150,000 to $174,999
- 847$175,000 to $199,999
- 505$200,000 to $249,999
- 651$250,000 to $299,999
- 195$300,000 to $399,999
- 113$400,000 to $499,999
- 34$500,000 to $749,999
- 79$750,000 to $999,999
- 69$1,000,000 to $1,499,999
- 26$2,000,000 or more
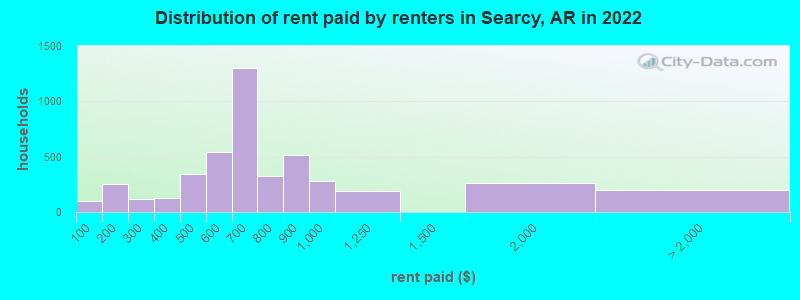
Rent paid by renters in 2022 in Searcy, AR
-
- 101Less than $100
- 61$100 to $149
- 188$150 to $199
- 92$200 to $249
- 21$250 to $299
- 13$300 to $349
- 115$350 to $399
- 159$400 to $449
- 182$450 to $499
- 258$500 to $549
- 281$550 to $599
- 379$600 to $649
- 926$650 to $699
- 99$700 to $749
- 226$750 to $799
- 512$800 to $899
- 275$900 to $999
- 192$1,000 to $1,249
- 265$1,500 to $1,999
- 15$2,000 to $2,499
- 23$2,500 to $2,999
- 21$3,500 or more
- 142No cash rent
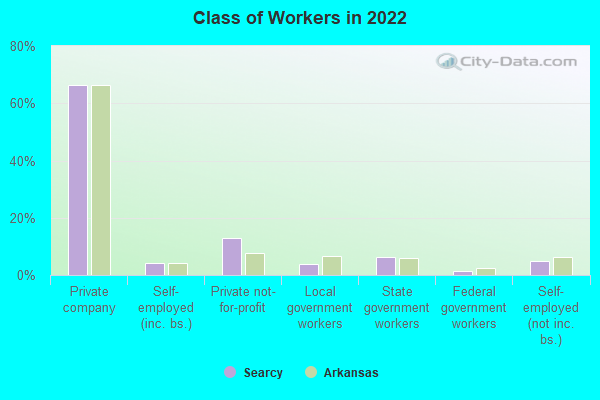
Percentage of workers working in this county: 92.5%
Number of people working at home: 396 (4.6% of all workers)
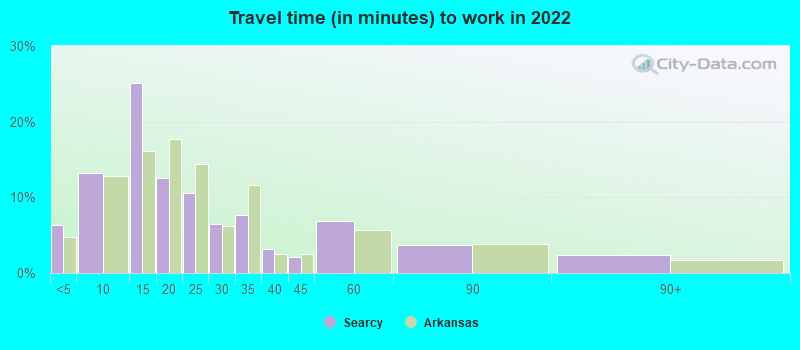
Travel time to work (commute)
- Less than 5 minutes: 1,006
- 5 to 9 minutes: 2,150
- 10 to 14 minutes: 2,297
- 15 to 19 minutes: 825
- 20 to 24 minutes: 317
- 25 to 29 minutes: 109
- 30 to 34 minutes: 134
- 35 to 39 minutes: 78
- 40 to 44 minutes: 164
- 45 to 59 minutes: 332
- 60 to 89 minutes: 832
- 90 or more minutes: 57
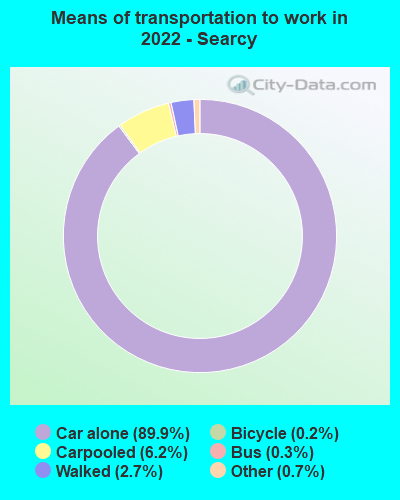
Means of transportation to work:
- Drove a car alone: 16,887 (87.6%)
- Carpooled: 1,015 (5.3%)
- Bus: 64 (0.3%)
- Taxi: 133 (0.7%)
- Bicycle: 26 (0.1%)
- Walked: 542 (2.8%)
- Worked at home: 396 (2.1%)
- Unemployment by race in 2022
- Unemployment rate for White non-Hispanic residents
- 7.6%Males
- 8.4%Females
- Unemployment rate for Black residents
- 1.0%Males
- 12.7%Females
- Unemployment rate for American Indian and Alaska Native residents
- 100.0%Males
- Unemployment rate for two or more race residents
- 11.7%Males
- 10.0%Females
- Unemployment rate for Hispanic or Latino residents
- 31.0%Males
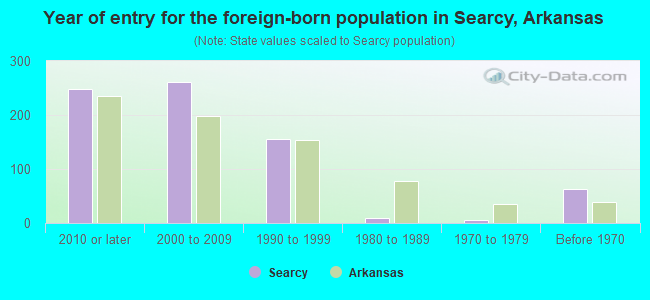
- Year of entry for the foreign-born population in Searcy, Arkansas
- 2482010 or later
- 2612000 to 2009
- 1551990 to 1999
- 91980 to 1989
- 51970 to 1979
- 63Before 1970
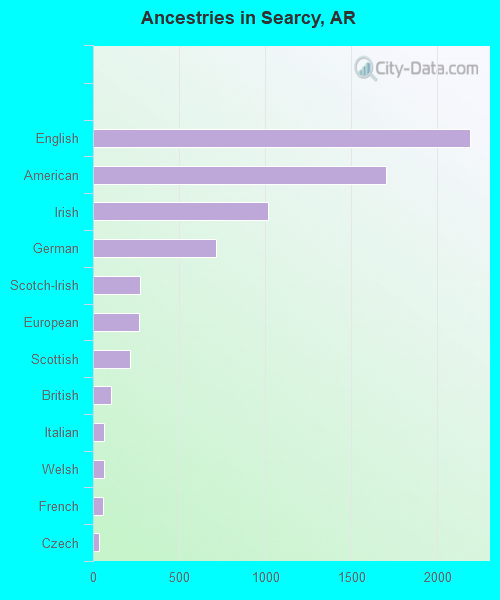
First ancestries reported:
- English: 2,191 (23.1%)
- American: 1,701 (17.9%)
- Irish: 1,017 (10.7%)
- German: 715 (7.5%)
- Scotch-Irish: 271 (2.9%)
- European: 267 (2.8%)
- Scottish: 217 (2.3%)
- British: 106 (1.1%)
- Italian: 66 (0.7%)
- Welsh: 61 (0.6%)
- French: 58 (0.6%)
- Czech: 32 (0.3%)
- African: 18 (0.2%)
- Dutch: 15 (0.2%)
- French Canadian: 14 (0.1%)
- Russian: 12 (0.1%)
- Nigerian: 12 (0.1%)
- Northern European: 10 (0.1%)
- Scandinavian: 10 (0.1%)
- Icelander: 9 (0.09%)
- Polish: 1 (0.01%)
- Swedish: 1 (0.01%)
Most common places of birth for foreign-born residents (%):
| Searcy: | 38.0% (289) |
| Arkansas: | 40.2% (61,075) |
| Searcy: | 13.1% (100) |
| Arkansas: | 0.8% (1,236) |
| Searcy: | 10.1% (77) |
| Arkansas: | 2.3% (3,503) |
| Searcy: | 3.9% (30) |
| Arkansas: | 0.2% (317) |
| Searcy: | 3.3% (25) |
| Arkansas: | 0.3% (451) |
| Searcy: | 3.2% (24) |
| Arkansas: | 0.0% (52) |
| Searcy: | 3.2% (24) |
| Arkansas: | 0.3% (486) |
| Searcy: | 2.6% (20) |
| Arkansas: | 0.4% (563) |
| Searcy: | 2.5% (19) |
| Arkansas: | 1.4% (2,174) |
| Searcy: | 2.4% (18) |
| Arkansas: | 0.3% (469) |
| Searcy: | 2.1% (16) |
| Arkansas: | 0.2% (360) |
| Searcy: | 2.0% (15) |
| Arkansas: | 3.5% (5,376) |
| Searcy: | 1.8% (14) |
| Arkansas: | 10.7% (16,210) |
| Searcy: | 1.7% (13) |
| Arkansas: | 0.9% (1,434) |
| Searcy: | 1.7% (13) |
| Arkansas: | 1.2% (1,813) |
Place of birth for U.S.-born residents:
- This state: 13,704
- Other state: 8,256
- Northeast: 257
- Midwest: 3,026
- South: 4,069
- West: 940
81.3% of Searcy residents lived in the same house 1 years ago.
Out of people who lived in different houses, 35.2% lived in this county.
Out of people who lived in different counties, 24.1% lived in Arkansas.
| Searcy: | 81.3% |
| State average: | 87.0% |
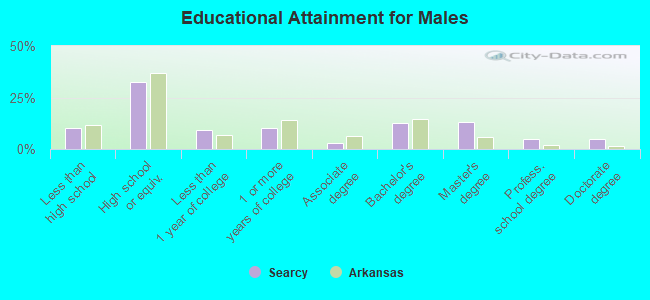
Education attainment for males 25 years and older:
- No schooling: 98
- Nursery to 4th grade: 0
- 5th and 6th grade: 0
- 7th and 8th grade: 60
- 9th grade: 83
- 10th grade: 147
- 11th grade: 107
- 12th grade, no diploma: 117
- High school graduate (or equivalency): 1,944
- Less than 1 year of college: 545
- Some college more than 1 year, no degree: 598
- Associate degree: 167
- Bachelor's degree: 737
- Master's degree: 790
- Professional school degree: 280
- Doctorate degree: 278
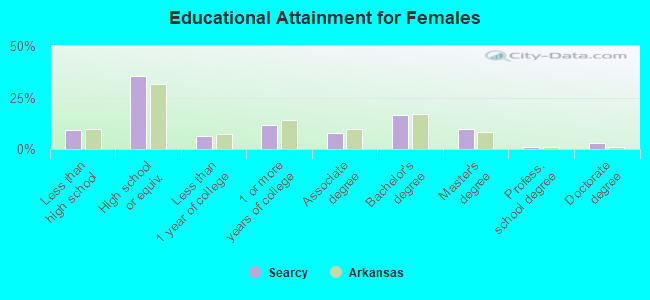
Education attainment for females 25 years and older:
- No schooling: 54
- Nursery to 4th grade: 0
- 5th and 6th grade: 55
- 7th and 8th grade: 95
- 9th grade: 156
- 10th grade: 49
- 11th grade: 161
- 12th grade, no diploma: 97
- High school graduate (or equivalency): 2,495
- Less than 1 year of college: 434
- Some college more than 1 year, no degree: 813
- Associate degree: 539
- Bachelor's degree: 1,154
- Master's degree: 689
- Professional school degree: 74
- Doctorate degree: 217


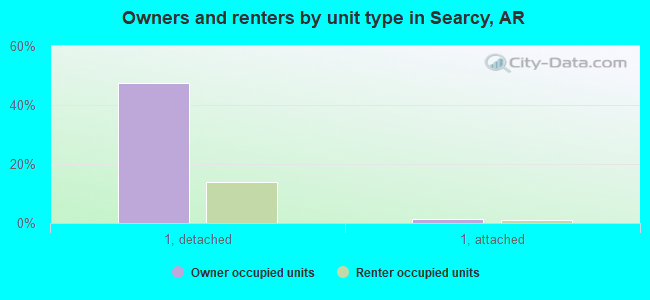
Housing units in structures:
- One, detached: 6,073
- One, attached: 207
- Two: 355
- 3 or 4: 726
- 5 to 9: 503
- 10 to 19: 838
- 20 to 49: 452
- 50 or more: 304
- Mobile homes: 291
Median worth of mobile homes: $98,648
Housing units lacking complete kitchen facilities in 2022: 3.8%
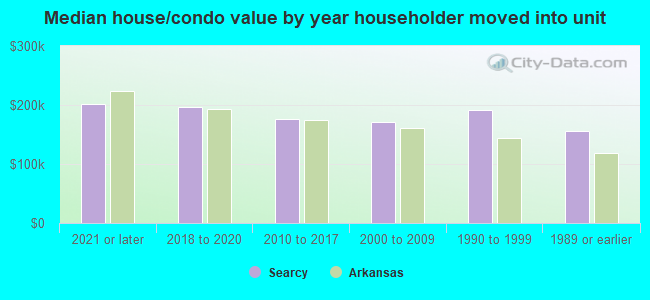
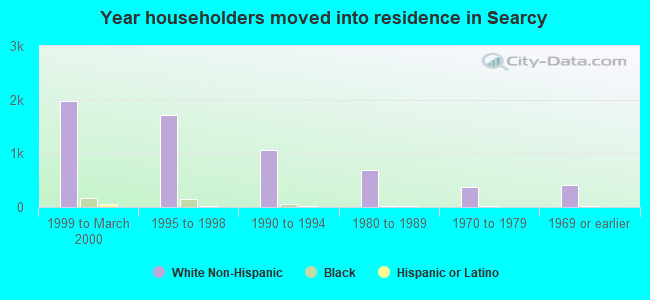
House/condo owner moved in on average 7 years ago
Renter moved in on average 1 years ago
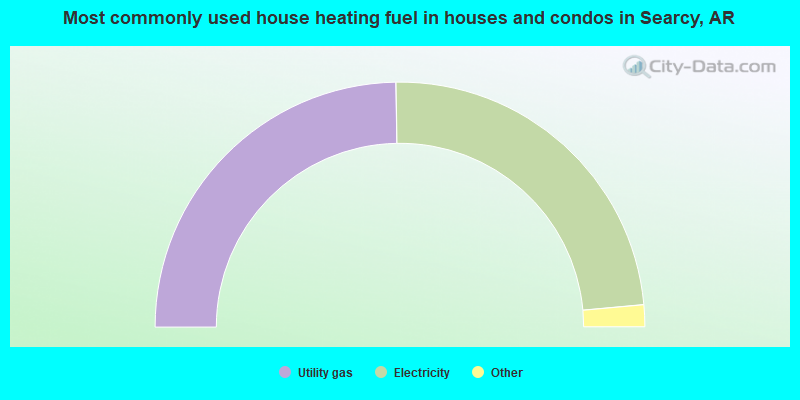
- 49.5%Utility gas
- 47.6%Electricity
- 1.9%Bottled, tank, or LP gas
- 0.5%No fuel used
- 0.3%Wood
- 0.2%Solar energy
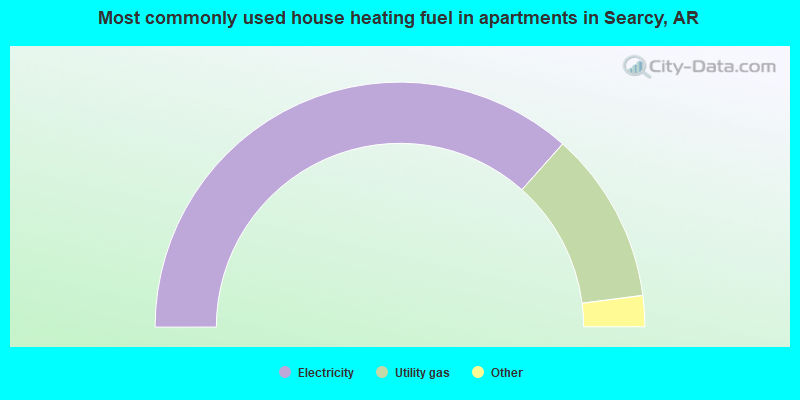
- 73.2%Electricity
- 22.8%Utility gas
- 1.9%Bottled, tank, or LP gas
- 1.2%Wood
- 0.6%No fuel used
- 0.4%Fuel oil, kerosene, etc.
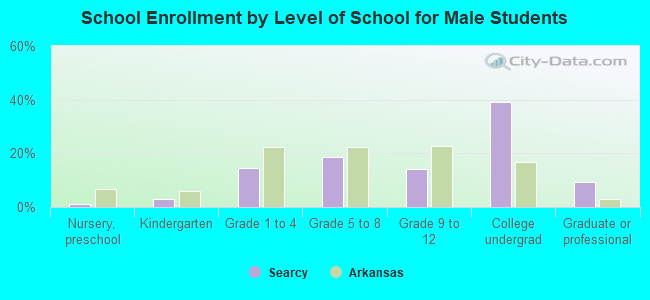
Private vs. public school enrollment:
| Here: | 12.5% |
| Arkansas: | 10.5% |
| Here: | 31.6% |
| Arkansas: | 8.7% |
| Here: | 69.0% |
| Arkansas: | 19.4% |