Housing density: 757 houses/condos per square mile
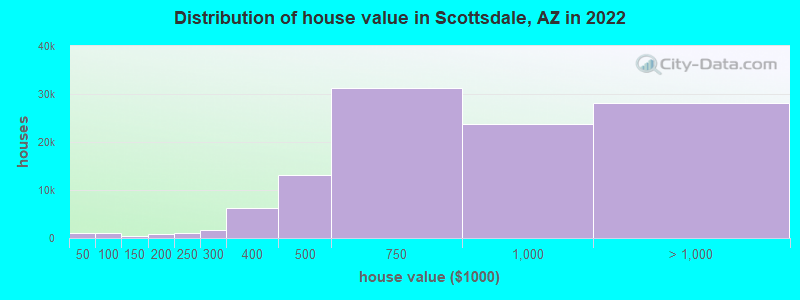
Median price asked for vacant for-sale houses and condos in 2022: $730,953.
Median contract rent in 2022: $1,811 (lower quartile is $1,487, upper quartile is over $2,000)
Median rent asked for vacant for-rent units in 2022: $1,568
Median gross rent in Scottsdale, AZ in 2022: $1,926
Housing units in Scottsdale with a mortgage: 47,952 (5,506 second mortgage, 429 home equity loan, 4,772 both second mortgage and home equity loan) Houses without a mortgage: 1,242
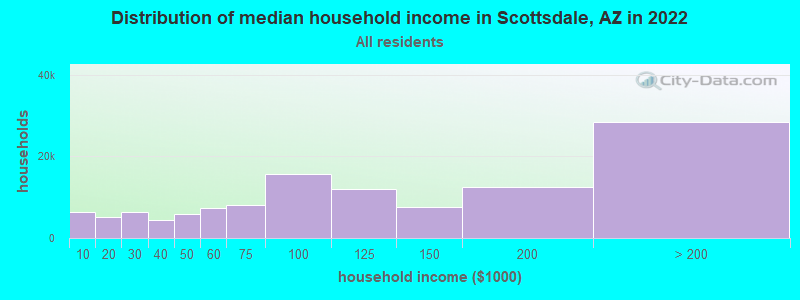
Median household income for houses/condos with a mortgage: $141,884
Median household income for apartments without a mortgage: $88,600
Size of family households: 37,561 2-persons, 12,904 3-persons, 9,150 4-persons, 3,036 5-persons, 391 6-persons, 159 7-or-more-persons.
Size of nonfamily households: 44,323 1-person, 10,727 2-persons, 1,645 3-persons.
23,404 married couples with children.
8,778 single-parent households (1,926 men, 6,852 women).
87.1% of residents of Scottsdale speak English at home.
5.8% of residents speak Spanish at home (76% speak English very well, 13% speak English well, 9% speak English not well, 2% don't speak English at all).
3.9% of residents speak other Indo-European language at home (89% speak English very well, 8% speak English well, 3% speak English not well).
2.4% of residents speak Asian or Pacific Island language at home (74% speak English very well, 16% speak English well, 10% speak English not well).
1.0% of residents speak other language at home (79% speak English very well, 12% speak English well, 9% speak English not well).
Foreign born population: 24,262 (10.0%)
(62.1% of them are naturalized citizens)
Percentage of workers working in this county: 98.5% Number of people working at home: 43,272 (34.0% of all workers)
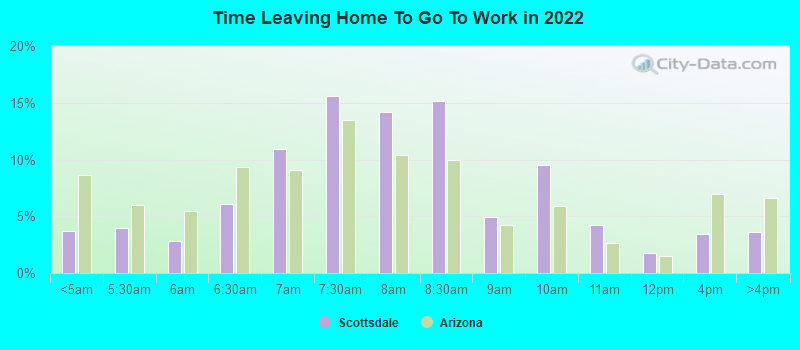
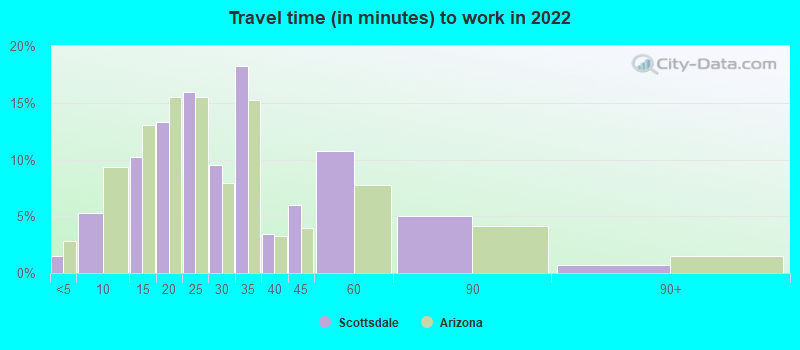
Travel time to work (commute)
Less than 5 minutes: 1,837
5 to 9 minutes: 7,431
10 to 14 minutes: 15,746
15 to 19 minutes: 13,359
20 to 24 minutes: 13,533
25 to 29 minutes: 8,991
30 to 34 minutes: 10,726
35 to 39 minutes: 1,819
40 to 44 minutes: 2,202
45 to 59 minutes: 5,225
60 to 89 minutes: 1,789
90 or more minutes: 1,238
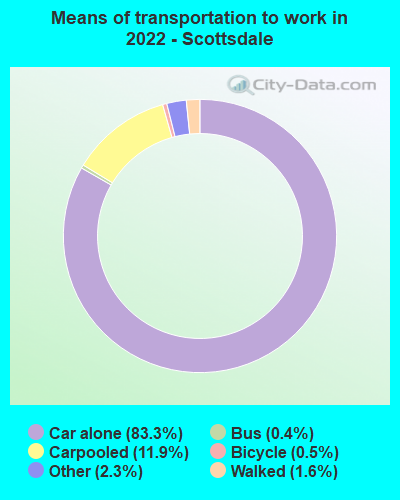
Means of transportation to work:
Drove a car alone: 130,824 (65.3%)
Carpooled: 18,696 (9.3%)
Bus: 563 (0.3%)
Light rail, streetcar or trolley: 65 (0.0%)
Taxi: 3,585 (1.8%)
Bicycle: 807 (0.4%)
Walked: 2,434 (1.2%)
Worked at home: 43,272 (21.6%)
Unemployment by race in 2022
Unemployment rate for White non-Hispanic residents
3.1%Males
2.6%Females
Unemployment rate for Black residents
4.9%Males
Unemployment rate for American Indian and Alaska Native residents
1.9%Females
Unemployment rate for Asian residents
3.7%Males
1.6%Females
Unemployment rate for other race residents
1.6%Males
1.9%Females
Unemployment rate for two or more race residents
7.9%Females
Unemployment rate for Hispanic or Latino residents
0.8%Females
Year of entry for the foreign-born population in Scottsdale, Arizona
9,1012010 or later
6,1872000 to 2009
4,9661990 to 1999
3,9531980 to 1989
2,4731970 to 1979
4,882Before 1970
First ancestries reported:
American: 11,419 (9.8%)
English: 11,244 (9.7%)
German: 11,168 (9.6%)
Irish: 8,870 (7.7%)
Italian: 7,299 (6.3%)
European: 5,636 (4.9%)
Polish: 3,356 (2.9%)
Norwegian: 1,847 (1.6%)
Russian: 1,654 (1.4%)
Scottish: 1,530 (1.3%)
Swedish: 1,447 (1.2%)
Eastern European: 1,332 (1.1%)
French: 1,123 (1.0%)
Iranian: 1,115 (1.0%)
Greek: 1,043 (0.9%)
Dutch: 908 (0.8%)
Czech: 888 (0.8%)
Canadian: 748 (0.6%)
British: 725 (0.6%)
Northern European: 684 (0.6%)
Scotch-Irish: 623 (0.5%)
Ukrainian: 584 (0.5%)
Ethiopian: 560 (0.5%)
Portuguese: 555 (0.5%)
Scandinavian: 510 (0.4%)
Lebanese: 456 (0.4%)
Hungarian: 447 (0.4%)
French Canadian: 425 (0.4%)
Welsh: 389 (0.3%)
Armenian: 376 (0.3%)
Lithuanian: 375 (0.3%)
African: 365 (0.3%)
Croatian: 341 (0.3%)
Austrian: 290 (0.3%)
Romanian: 265 (0.2%)
Danish: 262 (0.2%)
Albanian: 252 (0.2%)
Czechoslovakian: 245 (0.2%)
Australian: 226 (0.2%)
Syrian: 224 (0.2%)
Palestinian: 213 (0.2%)
Serbian: 207 (0.2%)
Jordanian: 192 (0.2%)
Nigerian: 174 (0.2%)
Swiss: 172 (0.1%)
Slovak: 166 (0.1%)
Finnish: 141 (0.1%)
Haitian: 135 (0.1%)
Assyrian: 134 (0.1%)
Celtic: 129 (0.1%)
Arab: 128 (0.1%)
Kenyan: 121 (0.1%)
Brazilian: 112 (0.10%)
Bulgarian: 110 (0.09%)
Iraqi: 93 (0.08%)
Macedonian: 88 (0.08%)
Turkish: 82 (0.07%)
Yugoslavian: 77 (0.07%)
Icelander: 59 (0.05%)
Cypriot: 55 (0.05%)
Israeli: 48 (0.04%)
Moroccan: 44 (0.04%)
Latvian: 37 (0.03%)
Afghan: 36 (0.03%)
South African: 36 (0.03%)
Basque: 35 (0.03%)
Slavic: 33 (0.03%)
Trinidadian and Tobagonian: 29 (0.03%)
Slovene: 28 (0.02%)
Belgian: 21 (0.02%)
Barbadian: 20 (0.02%)
Pennsylvania German: 19 (0.02%)
Egyptian: 18 (0.02%)
New Zealander: 14 (0.01%)
Maltese: 13 (0.01%)
Cajun: 12 (0.01%)
Luxembourger: 11 (0.01%)
Jamaican: 8 (0.01%)
Most common places of birth for foreign-born residents (%):
Mexico
Scottsdale:
12.0% (3,504)
Arizona:
53.4% (500,086)
Canada
Scottsdale:
11.4% (3,327)
Arizona:
4.3% (40,102)
India
Scottsdale:
11.4% (3,318)
Arizona:
4.5% (41,719)
Korea
Scottsdale:
3.7% (1,064)
Arizona:
1.2% (11,275)
Iran
Scottsdale:
3.4% (984)
Arizona:
0.6% (5,893)
Germany
Scottsdale:
2.9% (845)
Arizona:
1.5% (14,058)
Philippines
Scottsdale:
2.6% (771)
Arizona:
3.2% (30,378)
Israel
Scottsdale:
2.3% (663)
Arizona:
0.2% (1,439)
Vietnam
Scottsdale:
2.1% (625)
Arizona:
2.1% (19,199)
Russia
Scottsdale:
2.1% (615)
Arizona:
0.4% (3,763)
England
Scottsdale:
2.0% (573)
Arizona:
1.1% (9,889)
United Kingdom, excluding England and Scotland
Scottsdale:
2.0% (569)
Arizona:
0.7% (6,565)
China, excluding Hong Kong and Taiwan
Scottsdale:
1.9% (556)
Arizona:
2.3% (21,275)
Colombia
Scottsdale:
1.8% (522)
Arizona:
0.6% (6,030)
Place of birth for U.S.-born residents:
This state: 57,668
Other state: 157,587
Northeast: 29,985
Midwest: 64,712
South: 22,379
West: 40,511
84.1% of Scottsdale residents lived in the same house 1 years ago. Out of people who lived in different houses, 37.1% lived in this county. Out of people who lived in different counties, 9.7% lived in Arizona.
Scottsdale:
84.1%
State average:
86.0%
Education attainment for males 25 years and older:
No schooling: 296
Nursery to 4th grade: 97
5th and 6th grade: 703
7th and 8th grade: 259
9th grade: 11
10th grade: 64
11th grade: 220
12th grade, no diploma: 504
High school graduate (or equivalency): 9,159
Less than 1 year of college: 3,129
Some college more than 1 year, no degree: 11,180
Associate degree: 4,246
Bachelor's degree: 37,416
Master's degree: 12,241
Professional school degree: 7,936
Doctorate degree: 3,809
Education attainment for females 25 years and older:
No schooling: 1,357
Nursery to 4th grade: 0
5th and 6th grade: 942
7th and 8th grade: 507
9th grade: 55
10th grade: 284
11th grade: 275
12th grade, no diploma: 745
High school graduate (or equivalency): 10,605
Less than 1 year of college: 4,894
Some college more than 1 year, no degree: 12,791
Associate degree: 7,503
Bachelor's degree: 38,693
Master's degree: 15,574
Professional school degree: 5,318
Doctorate degree: 1,662
Housing units in structures:
One, detached: 73,230
One, attached: 16,020
Two: 2,077
3 or 4: 3,862
5 to 9: 7,861
10 to 19: 7,294
20 to 49: 4,534
50 or more: 23,164
Mobile homes: 731
Boats, RVs, vans, etc.: 607
Median worth of mobile homes: $144,548
Housing units lacking complete plumbing facilities in 2022: 0.3%
Housing units lacking complete kitchen facilities in 2022: 1.3%