Savoy, IL (Illinois) Houses and Residents
| Savoy: | $269,602 |
| Illinois: | $251,600 |
Mean price in 2022:
Detached houses: $341,660
Here: $341,660 State: $310,164 Townhouses or other attached units: $197,061
Here: $197,061 State: $286,230 In 3-to-4-unit structures: $219,770
Here: $219,770 State: $330,907 In 5-or-more-unit structures: $161,321
Here: $161,321 State: $318,887
Total population: 7,879 (Urban population: 4,307, Rural population: 0)
Houses: 3,862 (3,531 occupied: 2,043 owner occupied, 1,516 renter occupied)
| % of renters here: | 43% |
| State: | 33% |
Housing density: 2,502 houses/condos per square mile
Median price asked for vacant for-sale houses and condos in 2022: $393,769.
Median contract rent in 2022: $871 (lower quartile is $687, upper quartile is $1,390)
Median rent asked for vacant for-rent units in 2022: $1,747
Median gross rent in Savoy, IL in 2022: $981
Housing units in Savoy with a mortgage: 1,482 (47 second mortgage, 32 home equity loan, 25 both second mortgage and home equity loan)
Houses without a mortgage: 14
Median household income for houses/condos with a mortgage: $149,820
Median household income for apartments without a mortgage: $103,651
Median monthly housing costs: $1,348
Compare current foreclosures near Savoy, IL:
| Photo | Address | Area | Beds / Baths | Price | Details |
|---|---|---|---|---|---|

|
#1
Quail Run Dr
Savoy, IL 61874
|
- sq. feet
|
- baths - beds |
show details | |

|
#2
W Bradley Ave
Champaign, IL 61820
|
1,202 sq. feet
|
1 baths 2 beds |
$139,000
|
show details |

|
#3
W Green St
Savoy, IL 61874
|
- sq. feet
|
- baths - beds |
show details | |

|
#4
S Hickory St
Pesotum, IL 61863
|
1,155 sq. feet
|
1 baths 3 beds |
show details | |

|
#5
W Hill St
Champaign, IL 61820
|
918 sq. feet
|
2 baths - beds |
show details | |

|
#6
E Hancock St
Longview, IL 61852
|
2 sq. feet
|
1 baths 3 beds |
show details | |

|
#7
S Spruce St
Villa Grove, IL 61956
|
1,200 sq. feet
|
1 baths 4 beds |
show details | |

|
#8
S Walnut St
Pesotum, IL 61863
|
1,010 sq. feet
|
1 baths - beds |
show details | |

|
#9
N Pine St
Villa Grove, IL 61956
|
1,077 sq. feet
|
1 baths 2 beds |
show details | |

|
#10
Lantern Hill Dr
Urbana, IL 61802
|
912 sq. feet
|
2 baths - beds |
show details |
| Photo | Address | Area | Beds / Baths | Price | Details |
|---|---|---|---|---|---|

|
#11
E Elm St
Villa Grove, IL 61956
|
1 sq. feet
|
1 baths 2 beds |
show details | |

|
#12
Garden Hills Dr
Champaign, IL 61821
|
1,479 sq. feet
|
1 baths - beds |
show details | |

|
#13
Boulder Ridge Dr
Champaign, IL 61822
|
- sq. feet
|
- baths - beds |
show details | |

|
#14
Boulder Ridge Dr
Champaign, IL 61822
|
- sq. feet
|
- baths - beds |
show details | |

|
#15
E High St
Urbana, IL 61802
|
- sq. feet
|
- baths - beds |
show details | |

|
#16
Baytowne Dr Apt 13
Champaign, IL 61822
|
- sq. feet
|
- baths - beds |
show details | |

|
#17
W Bradley Ave
Champaign, IL 61821
|
- sq. feet
|
- baths - beds |
show details | |

|
#18
Garden Hills Dr
Champaign, IL 61821
|
- sq. feet
|
- baths - beds |
show details | |

|
#19
Baytowne Dr Apt 11
Champaign, IL 61822
|
- sq. feet
|
- baths - beds |
show details | |

|
#20
Moreland Blvd Unit 102
Champaign, IL 61822
|
- sq. feet
|
- baths - beds |
show details |
| Photo | Address | Area | Beds / Baths | Price | Details |
|---|---|---|---|---|---|

|
#21
N Eastern Ave
Urbana, IL 61802
|
- sq. feet
|
- baths - beds |
show details | |

|
#22
E Main St Apt C
Tolono, IL 61880
|
- sq. feet
|
- baths - beds |
show details | |

|
#23
Moreland Blvd Unit 203
Champaign, IL 61822
|
- sq. feet
|
- baths - beds |
show details | |

|
#24
Sedgegrass Dr
Champaign, IL 61822
|
- sq. feet
|
- baths - beds |
show details | |

|
#25
N Champaign St
Champaign, IL 61820
|
- sq. feet
|
- baths - beds |
show details | |

|
#26
W Bradley Ave Apt E104
Champaign, IL 61821
|
- sq. feet
|
- baths - beds |
show details | |

|
#27
Carver Dr
Champaign, IL 61820
|
- sq. feet
|
- baths - beds |
show details | |

|
#28
Shemauger Trl
Urbana, IL 61802
|
- sq. feet
|
- baths - beds |
show details | |

|
#29
W Austin St
Tolono, IL 61880
|
- sq. feet
|
- baths - beds |
show details | |

|
#30
E Marshall St
Tolono, IL 61880
|
- sq. feet
|
- baths 3 beds |
show details |
| Photo | Address | Area | Beds / Baths | Price | Details |
|---|---|---|---|---|---|

|
#31
Jennifer Dr # A
Mahomet, IL 61853
|
- sq. feet
|
- baths - beds |
show details | |

|
#32
County Road O E
Mahomet, IL 61853
|
- sq. feet
|
- baths - beds |
show details | |

|
#33
Willow St
Ogden, IL 61859
|
- sq. feet
|
- baths - beds |
show details | |

|
#34
W Lincoln Ave
Ogden, IL 61859
|
- sq. feet
|
- baths - beds |
show details | |

|
#35
Collier Ave
Rantoul, IL 61866
|
- sq. feet
|
- baths - beds |
show details | |

|
#36
E Lincoln Ave
Ogden, IL 61859
|
- sq. feet
|
- baths - beds |
show details | |

|
#37
N West St
Homer, IL 61849
|
- sq. feet
|
- baths - beds |
show details | |

|
#38
County Road 1900 N
Saint Joseph, IL 61873
|
- sq. feet
|
- baths - beds |
show details | |

|
#39
Tilton St
Ivesdale, IL 61851
|
- sq. feet
|
- baths - beds |
show details | |

|
#40
County Road 1050 N
Homer, IL 61849
|
- sq. feet
|
- baths - beds |
show details |
| Photo | Address | Area | Beds / Baths | Price | Details |
|---|---|---|---|---|---|

|
#41
Peach Tree St
Urbana, IL 61802
|
- sq. feet
|
- baths - beds |
show details | |

|
#42
Pheasant Ridge Rd
Mahomet, IL 61853
|
- sq. feet
|
- baths - beds |
show details | |

|
#43
E Franklin St
Mahomet, IL 61853
|
- sq. feet
|
- baths - beds |
show details | |

|
#44
E Woodland Dr
Saint Joseph, IL 61873
|
- sq. feet
|
- baths - beds |
show details | |

|
#45
County Road 2200 E
Saint Joseph, IL 61873
|
- sq. feet
|
- baths - beds |
show details | |

|
#46
Macon St
Mahomet, IL 61853
|
- sq. feet
|
- baths - beds |
show details | |

|
#47
John Jay St
Urbana, IL 61802
|
- sq. feet
|
- baths - beds |
show details | |

|
#48
Waterview Way Apt B
Champaign, IL 61822
|
- sq. feet
|
- baths - beds |
show details | |

|
#49
W Park St
Urbana, IL 61801
|
- sq. feet
|
- baths - beds |
show details | |

|
Check over 1 million property listings on Foreclosure.com!
|
browse all offers | |||

Latest news about housing in Savoy, IL collected exclusively by city-data.com from local newspapers, TV, and radio stations

 | Savoy Champaign Urbana Area / Cannabis (1 reply) |
| Champaign-Urbana relocation (16 replies) |
| Liberal Southern Illinois Cities? (23 replies) |
| Urbana-Champaign Area Renting (4 replies) |
| Moving to Champaign - Urbana - best/safest areas to look for rental housing (15 replies) |
| Apartments in St.Joseph, IL (0 replies) |

Median year apartment built: 1986
Household type by relationship:
Households: 8,682- Male householders: 1,461 (279 living alone), Female householders: 2,004 (823 living alone)
1,580 spouses (1,568 opposite-sex spouses), 324 unmarried partners, (257 opposite-sex unmarried partners), 2,402 children (2,390 natural, 0 adopted, 12 stepchildren), 0 grandchildren, 35 brothers or sisters, 116 parents, 0 foster children, 81 other relatives, 538 non-relatives
- In group quarters: 141
Size of family households: 906 2-persons, 405 3-persons, 294 4-persons, 206 5-persons, 47 6-persons, 12 7-or-more-persons.
Size of nonfamily households: 1,169 1-person, 333 2-persons, 27 3-persons, 136 4-persons.
1,924 married couples with children.
294 single-parent households (198 men, 96 women).
77.5% of residents of Savoy speak English at home.
3.2% of residents speak Spanish at home (55% speak English very well, 19% speak English well, 26% speak English not well).
7.9% of residents speak other Indo-European language at home (85% speak English very well, 2% speak English well, 13% speak English not well).
8.9% of residents speak Asian or Pacific Island language at home (66% speak English very well, 26% speak English well, 8% speak English not well).
2.6% of residents speak other language at home (61% speak English very well, 33% speak English well, 6% speak English not well).
Foreign born population: 1,685 (19.4%)
(55.1% of them are naturalized citizens)
| Here: | 7.4 |
| State: | 6.4 |
| Here: | 4.0 |
| State: | 4.1 |

- Bedrooms in owner-occupied houses and condos in Savoy, Illinois
- 0no bedroom
- 231 bedroom
- 2542 bedrooms
- 7743 bedrooms
- 8074 bedrooms
- 1865+ bedrooms

- Bedrooms in renter-occupied apartments in Savoy, Illinois
- 25no bedroom
- 4671 bedroom
- 6672 bedrooms
- 3023 bedrooms
- 504 bedrooms
- 55+ bedrooms

- Cars and other vehicles available in Savoy in owner-occupied houses/condos
- 62no vehicle
- 4501 vehicle
- 1,0912 vehicles
- 4043 vehicles
- 374 vehicles
- 05+ vehicles

- Cars and other vehicles available in Savoy in renter-occupied apartments
- 212no vehicle
- 9521 vehicle
- 2812 vehicles
- 453 vehicles
- 264 vehicles
- 05+ vehicles

- Rooms in owner-occupied houses in Savoy, Illinois
- 01 room
- 02 rooms
- 553 rooms
- 1664 rooms
- 2475 rooms
- 2046 rooms
- 4427 rooms
- 4068 rooms
- 5239+ rooms

- Rooms in renter-occupied apartments in Savoy, Illinois
- 251 room
- 1112 rooms
- 3103 rooms
- 6854 rooms
- 1995 rooms
- 1306 rooms
- 07 rooms
- 308 rooms
- 269+ rooms


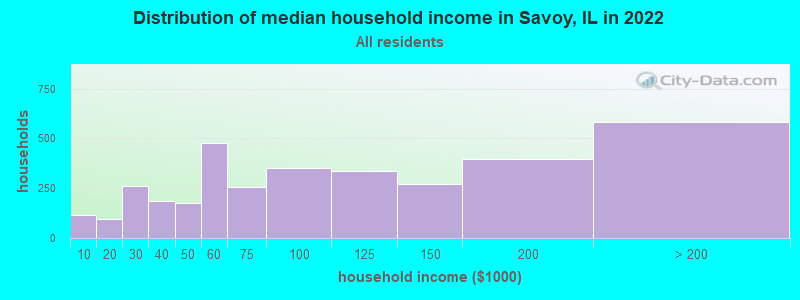
Savoy, IL household income distribution

- 115Less than $10,000
- 94$10,000 to $19,999
- 262$20,000 to $29,999
- 188$30,000 to $39,999
- 174$40,000 to $49,999
- 479$50,000 to $59,999
- 258$60,000 to $74,999
- 350$75,000 to $99,999
- 335$100,000 to $124,999
- 270$125,000 to $149,999
- 394$150,000 to $199,999
- 582$200,000 or more
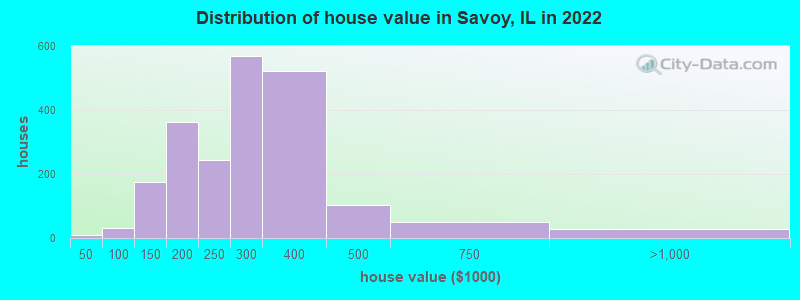
Home value of owner - occupied houses in 2022 in Savoy, IL
-
- 9$25,000 to $29,999
- 14$50,000 to $59,999
- 16$70,000 to $79,999
- 35$100,000 to $124,999
- 140$125,000 to $149,999
- 192$150,000 to $174,999
- 170$175,000 to $199,999
- 243$200,000 to $249,999
- 570$250,000 to $299,999
- 523$300,000 to $399,999
- 104$400,000 to $499,999
- 49$500,000 to $749,999
- 26$750,000 to $999,999
Rent paid by renters in 2022 in Savoy, IL
-
- 54$300 to $349
- 19$350 to $399
- 30$400 to $449
- 7$450 to $499
- 35$500 to $549
- 31$550 to $599
- 125$600 to $649
- 150$650 to $699
- 126$700 to $749
- 107$750 to $799
- 164$800 to $899
- 56$900 to $999
- 190$1,000 to $1,249
- 173$1,250 to $1,499
- 96$1,500 to $1,999
- 28$2,000 to $2,499
- 56$2,500 to $2,999
- 46$3,000 to $3,499
- 82$3,500 or more
- 3No cash rent


Percentage of workers working in this county: 90.3%
Number of people working at home: 945 (22.6% of all workers)
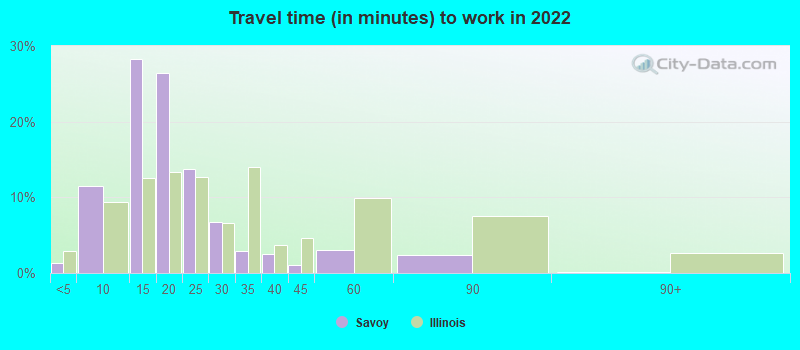
Travel time to work (commute)
- Less than 5 minutes: 61
- 5 to 9 minutes: 578
- 10 to 14 minutes: 961
- 15 to 19 minutes: 849
- 20 to 24 minutes: 403
- 25 to 29 minutes: 149
- 30 to 34 minutes: 84
- 35 to 39 minutes: 18
- 40 to 44 minutes: 47
- 45 to 59 minutes: 114
- 60 to 89 minutes: 64
- 90 or more minutes: 10
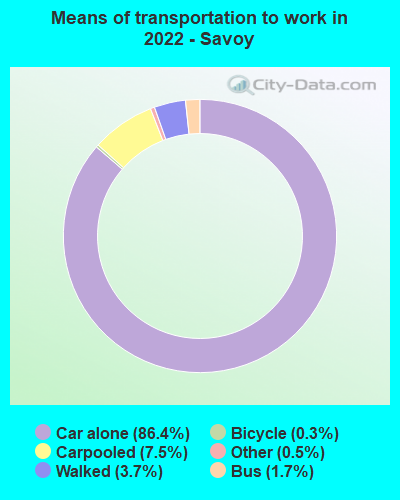
Means of transportation to work:
- Drove a car alone: 2,208 (65.9%)
- Carpooled: 186 (5.5%)
- Bus: 57 (1.7%)
- Taxi: 9 (0.3%)
- Bicycle: 6 (0.2%)
- Walked: 87 (2.6%)
- Worked at home: 945 (28.2%)

- Unemployment by race in 2022
- Unemployment rate for White non-Hispanic residents
- 2.9%Males
- 1.2%Females
- Unemployment rate for two or more race residents
- 2.2%Females
- Unemployment rate for Hispanic or Latino residents
- 2.6%Females

- Year of entry for the foreign-born population in Savoy, Illinois
- 7612010 or later
- 4372000 to 2009
- 3101990 to 1999
- 1181980 to 1989
- 271970 to 1979
- 19Before 1970
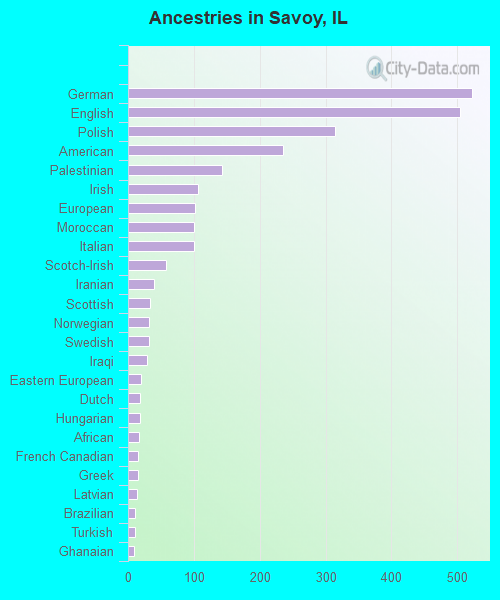
First ancestries reported:
- German: 522 (12.2%)
- English: 504 (11.8%)
- Polish: 315 (7.4%)
- American: 236 (5.5%)
- Palestinian: 142 (3.3%)
- Irish: 107 (2.5%)
- European: 101 (2.4%)
- Moroccan: 100 (2.3%)
- Italian: 100 (2.3%)
- Scotch-Irish: 58 (1.4%)
- Iranian: 40 (0.9%)
- Scottish: 34 (0.8%)
- Norwegian: 32 (0.8%)
- Swedish: 32 (0.8%)
- Iraqi: 29 (0.7%)
- Eastern European: 20 (0.5%)
- Dutch: 18 (0.4%)
- Hungarian: 18 (0.4%)
- African: 16 (0.4%)
- French Canadian: 15 (0.4%)
- Greek: 15 (0.4%)
- Latvian: 13 (0.3%)
- Brazilian: 11 (0.3%)
- Turkish: 10 (0.2%)
- Ghanaian: 9 (0.2%)
- British: 8 (0.2%)
- Czechoslovakian: 8 (0.2%)
- Russian: 3 (0.07%)
Most common places of birth for foreign-born residents (%):
| Savoy: | 15.5% (245) |
| Illinois: | 2.2% (40,393) |
| Savoy: | 15.2% (240) |
| Illinois: | 9.2% (166,409) |
| Savoy: | 11.4% (180) |
| Illinois: | 6.9% (124,474) |
| Savoy: | 7.0% (111) |
| Illinois: | 0.1% (2,465) |
| Savoy: | 5.9% (94) |
| Illinois: | 1.1% (19,306) |
| Savoy: | 5.8% (91) |
| Illinois: | 0.2% (3,363) |
| Savoy: | 4.9% (78) |
| Illinois: | 4.1% (74,364) |
| Savoy: | 4.9% (77) |
| Illinois: | 0.2% (2,731) |
| Savoy: | 4.0% (64) |
| Illinois: | 5.2% (93,003) |
| Savoy: | 3.7% (59) |
| Illinois: | 34.7% (626,958) |
| Savoy: | 3.5% (56) |
| Illinois: | 0.0% (670) |
| Savoy: | 2.0% (32) |
| Illinois: | 0.7% (13,214) |
| Savoy: | 2.0% (32) |
| Illinois: | 0.9% (16,308) |
| Savoy: | 2.0% (31) |
| Illinois: | 1.2% (22,269) |
| Savoy: | 1.8% (29) |
| Illinois: | 1.6% (29,316) |
| Savoy: | 1.6% (25) |
| Illinois: | 0.2% (4,177) |
Place of birth for U.S.-born residents:
- This state: 5,307
- Other state: 1,657
- Northeast: 239
- Midwest: 723
- South: 427
- West: 246
87.4% of Savoy residents lived in the same house 1 years ago.
Out of people who lived in different houses, 41.1% lived in this county.
Out of people who lived in different counties, 37.3% lived in Illinois.
| Savoy: | 87.4% |
| State average: | 88.3% |
Education attainment for males 25 years and older:
- No schooling: 45
- Nursery to 4th grade: 0
- 5th and 6th grade: 0
- 7th and 8th grade: 44
- 9th grade: 9
- 10th grade: 0
- 11th grade: 0
- 12th grade, no diploma: 0
- High school graduate (or equivalency): 494
- Less than 1 year of college: 87
- Some college more than 1 year, no degree: 145
- Associate degree: 91
- Bachelor's degree: 711
- Master's degree: 402
- Professional school degree: 240
- Doctorate degree: 269

Education attainment for females 25 years and older:
- No schooling: 32
- Nursery to 4th grade: 0
- 5th and 6th grade: 0
- 7th and 8th grade: 5
- 9th grade: 0
- 10th grade: 20
- 11th grade: 9
- 12th grade, no diploma: 7
- High school graduate (or equivalency): 718
- Less than 1 year of college: 109
- Some college more than 1 year, no degree: 424
- Associate degree: 176
- Bachelor's degree: 897
- Master's degree: 668
- Professional school degree: 73
- Doctorate degree: 156


Housing units in structures:
- One, detached: 1,640
- One, attached: 481
- Two: 114
- 3 or 4: 201
- 5 to 9: 376
- 10 to 19: 333
- 20 to 49: 129
- 50 or more: 586
House/condo owner moved in on average 8 years ago
Renter moved in on average 2 years ago

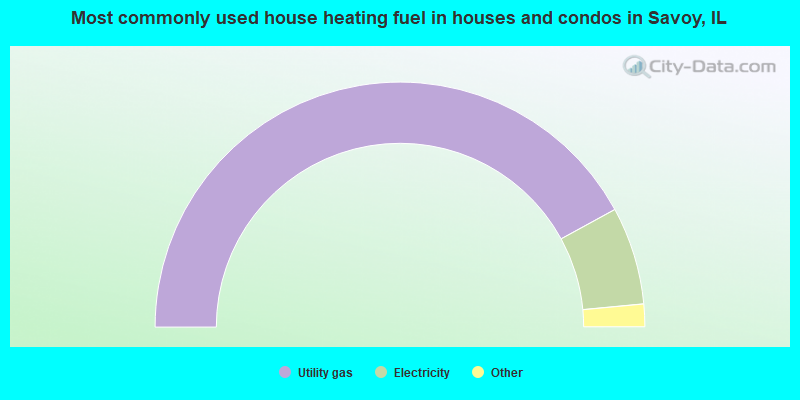
- 84.1%Utility gas
- 12.9%Electricity
- 1.7%Other fuel
- 1.4%Bottled, tank, or LP gas
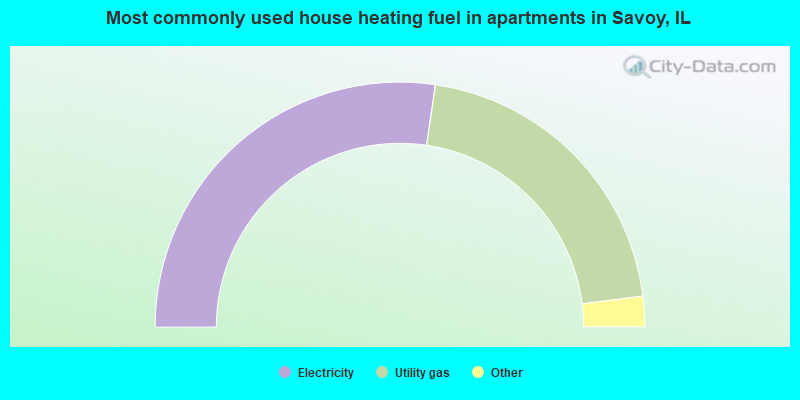
- 54.7%Electricity
- 41.4%Utility gas
- 3.3%Bottled, tank, or LP gas
- 0.6%No fuel used
Private vs. public school enrollment:
| Here: | 12.2% |
| Illinois: | 13.3% |
| Here: | 0.0% |
| Illinois: | 9.9% |
| Here: | 2.1% |
| Illinois: | 27.4% |


