Housing density: 995 houses/condos per square mile
Median price asked for vacant for-sale houses and condos in 2022 in this county: $431,660.
Median contract rent in 2022: $1,794 (lower quartile is $1,546, upper quartile is over $2,000)
Median rent asked for vacant for-rent units in 2022: $1,749
Median gross rent in Savage-Guilford, MD in 2022: $1,939
Housing units in Savage-Guilford with a mortgage: 2,746 (356 second mortgage, 234 home equity loan, 12 both second mortgage and home equity loan) Houses without a mortgage: 180
Compare current foreclosures near Savage-Guilford, MD:
In family households: 249,305 (55,751 male householders, 20,582 female householders)
61,671 spouses, 91,714 children (86,988 natural, 2,121 adopted, 2,605 stepchildren), 3,486 grandchildren, 2,367 brothers or sisters, 3,020 parents, foster children, 3,566 other relatives, 4,925 non-relatives
In nonfamily households: 35,458 (12,688 male householders (9,640 living alone)), 15,728 female householders (13,263 living alone)), 7,042 nonrelatives
In group quarters: 2,322 (1,818 institutionalized population)
55,035 married couples with children.
10,772 single-parent households (2,264 men, 8,508 women).
87.6% of residents of Savage-Guilford speak English at home.
3.4% of residents speak Spanish at home (80% speak English very well, 17% speak English well, 4% speak English not well).
4.7% of residents speak other Indo-European language at home (54% speak English very well, 29% speak English well, 9% speak English not well, 8% don't speak English at all).
3.5% of residents speak Asian or Pacific Island language at home (48% speak English very well, 34% speak English well, 19% speak English not well).
0.8% of residents speak other language at home (100% speak English very well).
Foreign born population: 3,222 (18.9%)
(58.6% of them are naturalized citizens)
Year of entry for the foreign-born population in Savage-Guilford, Maryland
3171995 to March 2000
2301990 to 1994
2221985 to 1989
1891980 to 1984
1011975 to 1979
571970 to 1974
341965 to 1969
31Before 1965
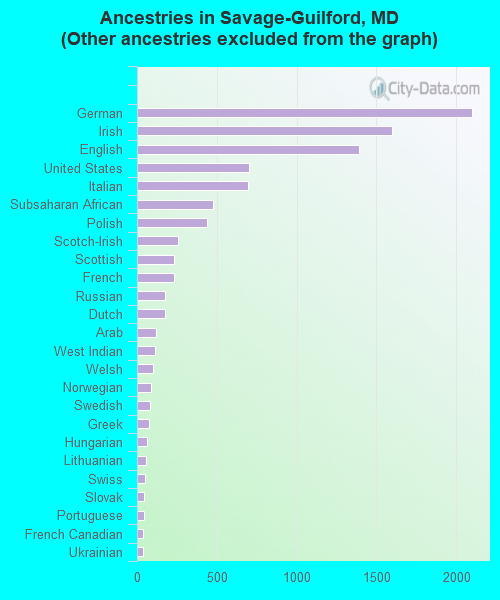
First ancestries reported:
Other: 4,415 (31.9%)
German: 2,101 (15.2%)
Irish: 1,599 (11.5%)
English: 1,390 (10.0%)
United States: 701 (5.1%)
Italian: 698 (5.0%)
Subsaharan African: 479 (3.5%)
Polish: 436 (3.1%)
Scotch-Irish: 260 (1.9%)
Scottish: 235 (1.7%)
French: 231 (1.7%)
Russian: 178 (1.3%)
Dutch: 173 (1.2%)
Arab: 116 (0.8%)
West Indian: 113 (0.8%)
Welsh: 103 (0.7%)
Norwegian: 89 (0.6%)
Swedish: 83 (0.6%)
Greek: 77 (0.6%)
Hungarian: 64 (0.5%)
Lithuanian: 55 (0.4%)
Swiss: 49 (0.4%)
Slovak: 47 (0.3%)
Portuguese: 45 (0.3%)
French Canadian: 36 (0.3%)
Ukrainian: 35 (0.3%)
Czech: 24 (0.2%)
Danish: 15 (0.1%)
Most common places of birth for foreign-born residents (%):
India
Savage-Guilford:
24.9% (294)
Maryland:
6.2% (32,276)
Korea
Savage-Guilford:
9.6% (113)
Maryland:
6.0% (31,249)
Vietnam
Savage-Guilford:
6.9% (82)
Maryland:
2.9% (14,807)
Bosnia and Herzegovina
Savage-Guilford:
5.0% (59)
Maryland:
0.1% (456)
China, excluding Hong Kong and Taiwan
Savage-Guilford:
5.0% (59)
Maryland:
4.4% (22,741)
Jamaica
Savage-Guilford:
4.8% (57)
Maryland:
3.7% (18,988)
Colombia
Savage-Guilford:
4.0% (47)
Maryland:
1.1% (5,594)
Venezuela
Savage-Guilford:
3.2% (38)
Maryland:
0.3% (1,577)
Nigeria
Savage-Guilford:
2.6% (31)
Maryland:
2.9% (15,071)
Mexico
Savage-Guilford:
1.9% (23)
Maryland:
3.7% (19,287)
Ireland
Savage-Guilford:
1.9% (22)
Maryland:
0.4% (2,102)
Philippines
Savage-Guilford:
1.9% (22)
Maryland:
4.1% (21,007)
Trinidad and Tobago
Savage-Guilford:
1.7% (20)
Maryland:
2.1% (11,050)
Brazil
Savage-Guilford:
1.6% (19)
Maryland:
0.9% (4,697)
Canada
Savage-Guilford:
1.5% (18)
Maryland:
1.7% (9,019)
Germany
Savage-Guilford:
1.5% (18)
Maryland:
2.8% (14,555)
Greece
Savage-Guilford:
1.5% (18)
Maryland:
0.8% (4,214)
Place of birth for U.S.-born residents:
This state: 5,624
Other state: 5,625
Northeast: 1,706
Midwest: 826
South: 2,758
West: 335
47% of Savage-Guilford residents lived in the same house 5 years ago. Out of people who lived in different houses, 32% lived in this county. Out of people who lived in different counties, 65% lived in Maryland.
Education attainment for males 25 years and older:
No schooling: 18
Nursery to 4th grade: 0
5th and 6th grade: 0
7th and 8th grade: 55
9th grade: 53
10th grade: 46
11th grade: 38
12th grade, no diploma: 134
High school graduate (or equivalency): 898
Less than 1 year of college: 282
Some college more than 1 year, no degree: 567
Associate degree: 210
Bachelor's degree: 1,042
Master's degree: 444
Professional school degree: 61
Doctorate degree: 110
Education attainment for females 25 years and older:
No schooling: 20
Nursery to 4th grade: 7
5th and 6th grade: 5
7th and 8th grade: 44
9th grade: 27
10th grade: 92
11th grade: 61
12th grade, no diploma: 82
High school graduate (or equivalency): 923
Less than 1 year of college: 369
Some college more than 1 year, no degree: 591
Associate degree: 307
Bachelor's degree: 1,042
Master's degree: 398
Professional school degree: 73
Doctorate degree: 73
Housing units in structures:
One, detached: 1,538
One, attached: 2,034
Two: 48
3 or 4: 92
5 to 9: 203
10 to 19: 813
20 to 49: 69
50 or more: 72
Mobile homes: 44
Median worth of mobile homes: $38,676
Housing units lacking complete plumbing facilities: 0.6%
Housing units lacking complete kitchen facilities: 0.3%