San Benito, TX (Texas) Houses and Residents
| San Benito: | $96,155 |
| Texas: | $275,400 |
Mean price in 2022:
Detached houses: $139,755
Here: $139,755 State: $369,058 Townhouses or other attached units: $99,893
Here: $99,893 State: $327,631 In 2-unit structures: $171,413
Here: $171,413 State: $374,947 Mobile homes: $94,108
Here: $94,108 State: $124,413 Occupied boats, RVs, vans, etc.: $97,293
Here: $97,293 State: $73,921
Total population: 24,506 (Urban population: 23,551, Rural population: 64 (all nonfarm))
Houses: 9,205 (8,022 occupied: 5,545 owner occupied, 2,597 renter occupied)
| % of renters here: | 32% |
| State: | 38% |
Housing density: 836 houses/condos per square mile
Median price asked for vacant for-sale houses and condos in 2022: $704,088.
Median contract rent in 2022: $661 (lower quartile is $489, upper quartile is $837)
Median rent asked for vacant for-rent units in 2022: $374
Median gross rent in San Benito, TX in 2022: $899
Housing units in San Benito with a mortgage: 1,564 (56 second mortgage, 0 home equity loan, 33 both second mortgage and home equity loan)
Houses without a mortgage: 0
Median household income for houses/condos with a mortgage: $74,100
Median household income for apartments without a mortgage: $43,910
Median monthly housing costs: $628
Compare current foreclosures in San Benito, TX:
| Photo | Address | Area | Beds / Baths | Price | Details |
|---|---|---|---|---|---|

|
#1
M R G Dr
San Benito, TX 78586
|
1,132 sq. feet
|
1 baths 3 beds |
show details | |

|
#2
Palo Blanco St
San Benito, TX 78586
|
1,195 sq. feet
|
2 baths 3 beds |
show details | |

|
#3
Pennsylvania Ave
San Benito, TX 78586
|
2,292 sq. feet
|
2 baths 4 beds |
show details | |

|
#4
Freddy Fender Ln
San Benito, TX 78586
|
804 sq. feet
|
1 baths - beds |
show details | |

|
#5
Biddle St
San Benito, TX 78586
|
1,696 sq. feet
|
2 baths - beds |
show details | |

|
#6
Oyama Rd
San Benito, TX 78586
|
924 sq. feet
|
- baths - beds |
show details | |

|
#7
Maya St
San Benito, TX 78586
|
- sq. feet
|
- baths - beds |
show details | |

|
#8
Madrid Ct
San Benito, TX 78586
|
1,573 sq. feet
|
- baths - beds |
show details | |

|
#9
Glenwood Rd
San Benito, TX 78586
|
1,208 sq. feet
|
- baths - beds |
show details | |

|
#10
Corral St
San Benito, TX 78586
|
915 sq. feet
|
- baths - beds |
show details |
| Photo | Address | Area | Beds / Baths | Price | Details |
|---|---|---|---|---|---|

|
#11
E Landrum St
San Benito, TX 78586
|
- sq. feet
|
- baths - beds |
show details | |

|
#12
Peacock Dr
San Benito, TX 78586
|
1,320 sq. feet
|
- baths - beds |
show details | |

|
#13
Munoz Ave
San Benito, TX 78586
|
- sq. feet
|
- baths - beds |
show details | |

|
#14
Landrum Rd
San Benito, TX 78586
|
1,508 sq. feet
|
- baths - beds |
show details | |

|
#15
Carlos St
San Benito, TX 78586
|
1,408 sq. feet
|
- baths - beds |
show details | |

|
#16
Resaca Nueva
San Benito, TX 78586
|
- sq. feet
|
- baths - beds |
show details | |

|
#17
Pintale St
San Benito, TX 78586
|
1,278 sq. feet
|
- baths - beds |
show details | |

|
#18
Utex Dr
San Benito, TX 78586
|
- sq. feet
|
- baths - beds |
show details | |

|
#19
Corona Cresent St
San Benito, TX 78586
|
1,716 sq. feet
|
- baths - beds |
show details | |

|
#20
Commerce St
San Benito, TX 78586
|
- sq. feet
|
- baths - beds |
show details |
| Photo | Address | Area | Beds / Baths | Price | Details |
|---|---|---|---|---|---|

|
#21
Glenwood Rd
San Benito, TX 78586
|
920 sq. feet
|
- baths - beds |
show details | |

|
#22
Chapa St
San Benito, TX 78586
|
1,080 sq. feet
|
- baths - beds |
show details | |

|
#23
N Espinoza Loop
San Benito, TX 78586
|
- sq. feet
|
- baths - beds |
show details | |

|
#24
Sandstone Dr
San Benito, TX 78586
|
768 sq. feet
|
- baths - beds |
show details | |

|
#25
Line 17 Rd
San Benito, TX 78586
|
1,966 sq. feet
|
- baths - beds |
show details | |

|
#26
Line 26 Rd
San Benito, TX 78586
|
- sq. feet
|
- baths - beds |
show details | |

|
#27
Del Rio Dr
San Benito, TX 78586
|
- sq. feet
|
- baths - beds |
show details | |

|
#28
Leal St
San Benito, TX 78586
|
- sq. feet
|
- baths - beds |
show details | |

|
#29
E Stenger St Apt F3
San Benito, TX 78586
|
- sq. feet
|
- baths - beds |
show details | |

|
#30
Resaca Shores Blvd
San Benito, TX 78586
|
1,501 sq. feet
|
- baths - beds |
show details |
| Photo | Address | Area | Beds / Baths | Price | Details |
|---|---|---|---|---|---|

|
#31
E Business 77, Lot 12
San Benito, TX 78586
|
- sq. feet
|
- baths - beds |
show details | |

|
#32
Rebecca St
San Benito, TX 78586
|
1,640 sq. feet
|
- baths - beds |
show details | |

|
#33
N Mccullough St Apt 2
San Benito, TX 78586
|
- sq. feet
|
- baths - beds |
show details | |

|
#34
Munoz Ave
San Benito, TX 78586
|
- sq. feet
|
- baths - beds |
show details | |

|
#35
Road 886
San Benito, TX 78586
|
- sq. feet
|
- baths - beds |
show details | |

|
#36
Las Cipres Blvd
San Benito, TX 78586
|
- sq. feet
|
- baths - beds |
show details | |

|
Check over 1 million property listings on Foreclosure.com!
|
browse all offers | |||


 | Finding rental housing on SPI (7 replies) |
| Run of the mill cookie cutter houses (53 replies) |
| Historically, what has been the most dangerous city in Texas (48 replies) |
| How many French speakers are in Texas? (12 replies) |
| What is it about the rio grande valley people dislike (25 replies) |
| Renter damage (9 replies) |

Median year apartment built: 1985
Household type by relationship:
Households: 24,962- Male householders: 3,853 (919 living alone), Female householders: 4,030 (980 living alone)
3,507 spouses (3,498 opposite-sex spouses), 235 unmarried partners, (206 opposite-sex unmarried partners), 9,427 children (8,644 natural, 375 adopted, 407 stepchildren), 1,541 grandchildren, 443 brothers or sisters, 427 parents, 36 foster children, 846 other relatives, 421 non-relatives
- In group quarters: 191
Size of family households: 2,336 2-persons, 1,541 3-persons, 967 4-persons, 466 5-persons, 358 6-persons, 330 7-or-more-persons.
Size of nonfamily households: 1,930 1-person, 108 2-persons, 31 3-persons, 71 4-persons.
3,002 married couples with children.
2,530 single-parent households (487 men, 2,043 women).
42.1% of residents of San Benito speak English at home.
57.2% of residents speak Spanish at home (62% speak English very well, 15% speak English well, 15% speak English not well, 8% don't speak English at all).
0.1% of residents speak Asian or Pacific Island language at home (100% speak English well).
0.3% of residents speak other language at home (100% speak English very well).
Foreign born population: 4,140 (16.6%)
(42.6% of them are naturalized citizens)
| Here: | 5.2 |
| State: | 6.3 |
| Here: | 3.8 |
| State: | 4.0 |

- Bedrooms in owner-occupied houses and condos in San Benito, Texas
- 65no bedroom
- 4731 bedroom
- 1,2922 bedrooms
- 2,4823 bedrooms
- 1,0724 bedrooms
- 1625+ bedrooms

- Bedrooms in renter-occupied apartments in San Benito, Texas
- 105no bedroom
- 4241 bedroom
- 1,4732 bedrooms
- 4893 bedrooms
- 1044 bedrooms
- 25+ bedrooms

- Cars and other vehicles available in San Benito in owner-occupied houses/condos
- 271no vehicle
- 2,1301 vehicle
- 1,8832 vehicles
- 8883 vehicles
- 2554 vehicles
- 1195+ vehicles

- Cars and other vehicles available in San Benito in renter-occupied apartments
- 327no vehicle
- 1,3271 vehicle
- 8502 vehicles
- 943 vehicles
- 04 vehicles
- 05+ vehicles

- Rooms in owner-occupied houses in San Benito, Texas
- 411 room
- 1502 rooms
- 3113 rooms
- 9144 rooms
- 1,6345 rooms
- 1,3736 rooms
- 5287 rooms
- 2478 rooms
- 3489+ rooms

- Rooms in renter-occupied apartments in San Benito, Texas
- 1051 room
- 1812 rooms
- 7053 rooms
- 7874 rooms
- 4595 rooms
- 2026 rooms
- 1377 rooms
- 148 rooms
- 79+ rooms


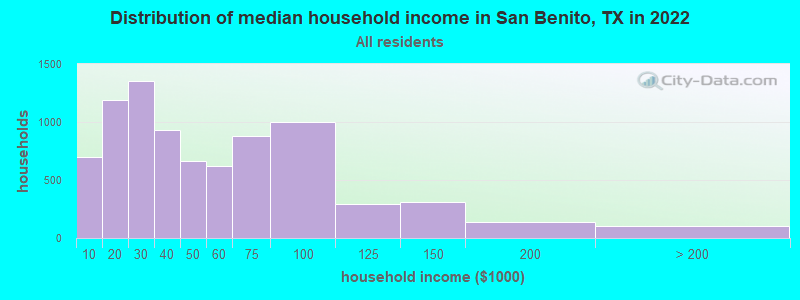
San Benito, TX household income distribution

- 697Less than $10,000
- 1,188$10,000 to $19,999
- 1,351$20,000 to $29,999
- 933$30,000 to $39,999
- 660$40,000 to $49,999
- 625$50,000 to $59,999
- 876$60,000 to $74,999
- 998$75,000 to $99,999
- 289$100,000 to $124,999
- 309$125,000 to $149,999
- 140$150,000 to $199,999
- 105$200,000 or more
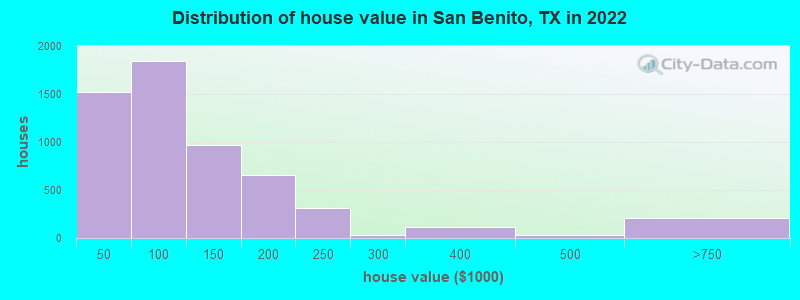
Home value of owner - occupied houses in 2022 in San Benito, TX
-
- 218Less than $10,000
- 101$10,000 to $14,999
- 112$15,000 to $19,999
- 113$20,000 to $24,999
- 211$25,000 to $29,999
- 44$30,000 to $34,999
- 154$35,000 to $39,999
- 566$40,000 to $49,999
- 164$50,000 to $59,999
- 321$60,000 to $69,999
- 294$70,000 to $79,999
- 240$80,000 to $89,999
- 261$90,000 to $99,999
- 740$100,000 to $124,999
- 223$125,000 to $149,999
- 388$150,000 to $174,999
- 267$175,000 to $199,999
- 309$200,000 to $249,999
- 33$250,000 to $299,999
- 110$300,000 to $399,999
- 35$400,000 to $499,999
- 206$500,000 to $749,999
- 7$750,000 to $999,999
Rent paid by renters in 2022 in San Benito, TX
-
- 30Less than $100
- 154$100 to $149
- 30$150 to $199
- 113$250 to $299
- 55$300 to $349
- 49$350 to $399
- 61$400 to $449
- 107$450 to $499
- 187$500 to $549
- 66$550 to $599
- 305$600 to $649
- 44$650 to $699
- 320$700 to $749
- 43$750 to $799
- 485$800 to $899
- 129$900 to $999
- 27$1,000 to $1,249
- 19$1,250 to $1,499
- 3$1,500 to $1,999
- 252No cash rent


Percentage of workers working in this county: 89.2%
Number of people working at home: 841 (9.5% of all workers)
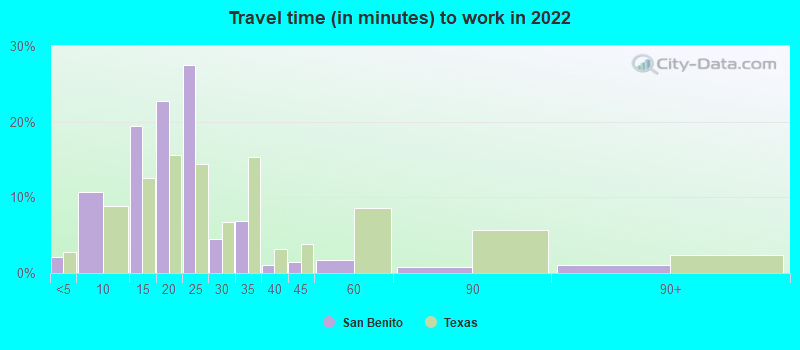
Travel time to work (commute)
- Less than 5 minutes: 165
- 5 to 9 minutes: 1,196
- 10 to 14 minutes: 1,801
- 15 to 19 minutes: 1,415
- 20 to 24 minutes: 1,597
- 25 to 29 minutes: 493
- 30 to 34 minutes: 526
- 35 to 39 minutes: 155
- 40 to 44 minutes: 84
- 45 to 59 minutes: 233
- 60 to 89 minutes: 180
- 90 or more minutes: 103
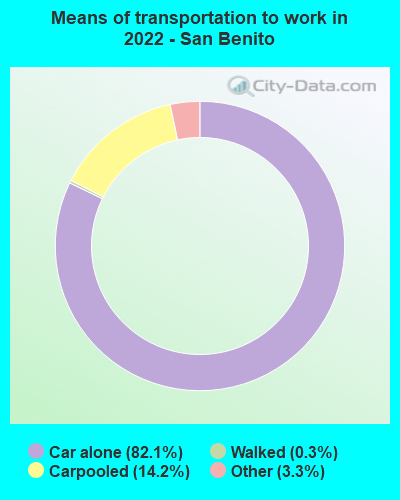
Means of transportation to work:
- Drove a car alone: 7,338 (72.4%)
- Carpooled: 1,717 (16.9%)
- Taxi: 326 (3.2%)
- Walked: 28 (0.3%)
- Worked at home: 841 (8.3%)

- Unemployment by race in 2022
- Unemployment rate for White non-Hispanic residents
- 3.3%Males
- 0.8%Females
- Unemployment rate for other race residents
- 2.2%Males
- Unemployment rate for two or more race residents
- 7.2%Males
- 5.9%Females
- Unemployment rate for Hispanic or Latino residents
- 5.1%Males
- 3.6%Females

- Year of entry for the foreign-born population in San Benito, Texas
- 8412010 or later
- 8722000 to 2009
- 7671990 to 1999
- 1,3541980 to 1989
- 7671970 to 1979
- 1,008Before 1970

First ancestries reported:
- American: 222 (1.1%)
- English: 195 (0.9%)
- German: 171 (0.8%)
- Norwegian: 74 (0.4%)
- Scottish: 26 (0.1%)
- French: 21 (0.1%)
- Dutch: 19 (0.09%)
- Italian: 19 (0.09%)
- Swedish: 17 (0.08%)
- Irish: 12 (0.06%)
- Lithuanian: 4 (0.02%)
- Portuguese: 2 (0.01%)
Most common places of birth for foreign-born residents (%):
| San Benito: | 89.6% (3,913) |
| Texas: | 48.4% (2,411,723) |
| San Benito: | 2.5% (109) |
| Texas: | 0.4% (18,642) |
| San Benito: | 2.3% (102) |
| Texas: | 4.5% (224,455) |
Place of birth for U.S.-born residents:
- This state: 18,403
- Other state: 2,202
- Northeast: 107
- Midwest: 986
- South: 615
- West: 462
89.4% of San Benito residents lived in the same house 1 years ago.
Out of people who lived in different houses, 35.8% lived in this county.
Out of people who lived in different counties, 91.2% lived in Texas.
| San Benito: | 89.4% |
| State average: | 85.7% |
Education attainment for males 25 years and older:
- No schooling: 399
- Nursery to 4th grade: 100
- 5th and 6th grade: 333
- 7th and 8th grade: 287
- 9th grade: 389
- 10th grade: 191
- 11th grade: 100
- 12th grade, no diploma: 41
- High school graduate (or equivalency): 2,454
- Less than 1 year of college: 553
- Some college more than 1 year, no degree: 760
- Associate degree: 576
- Bachelor's degree: 599
- Master's degree: 174
- Professional school degree: 24
- Doctorate degree: 0

Education attainment for females 25 years and older:
- No schooling: 502
- Nursery to 4th grade: 289
- 5th and 6th grade: 587
- 7th and 8th grade: 178
- 9th grade: 207
- 10th grade: 210
- 11th grade: 77
- 12th grade, no diploma: 67
- High school graduate (or equivalency): 1,781
- Less than 1 year of college: 327
- Some college more than 1 year, no degree: 1,379
- Associate degree: 610
- Bachelor's degree: 782
- Master's degree: 404
- Professional school degree: 21
- Doctorate degree: 0


Housing units in structures:
- One, detached: 6,322
- One, attached: 277
- Two: 86
- 3 or 4: 459
- 5 to 9: 347
- 10 to 19: 193
- 20 to 49: 180
- 50 or more: 250
- Mobile homes: 1,071
- Boats, RVs, vans, etc.: 15
Median worth of mobile homes: $16,321
Housing units lacking complete kitchen facilities in 2022: 2.4%
House/condo owner moved in on average 14 years ago
Renter moved in on average 4 years ago

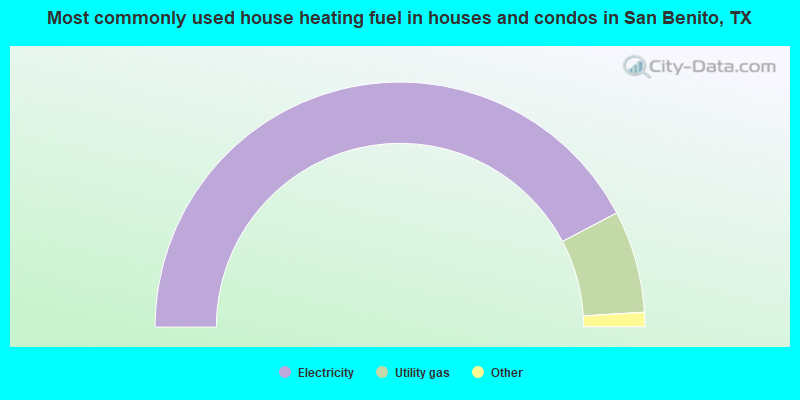
- 84.6%Electricity
- 13.5%Utility gas
- 1.3%Bottled, tank, or LP gas
- 0.6%No fuel used
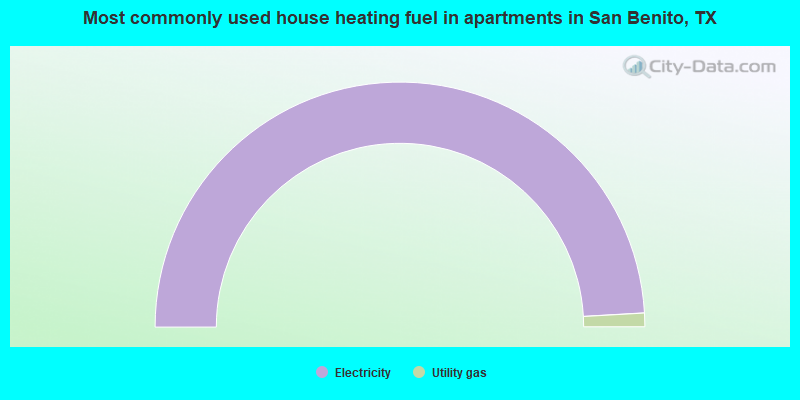
- 98.2%Electricity
- 1.8%Utility gas
Private vs. public school enrollment:
| Here: | 1.6% |
| Texas: | 8.8% |
| Here: | 14.3% |
| Texas: | 8.0% |
| Here: | 11.3% |
| Texas: | 16.2% |


