Salisbury, NC (North Carolina) Houses and Residents
| Salisbury: | $217,529 |
| North Carolina: | $280,600 |
Mean price in 2022:
Detached houses: $253,068
Here: $253,068 State: $375,326 Townhouses or other attached units: $233,604
Here: $233,604 State: $317,935 In 3-to-4-unit structures: $158,336
Here: $158,336 State: $254,939 In 5-or-more-unit structures: $224,050
Here: $224,050 State: $329,290 Mobile homes: $46,103
Here: $46,103 State: $124,933
Total population: 33,710 (Urban population: 26,446 (65 inside urbanized areas, 26,381 inside urban clusters), Rural population: 230 (all nonfarm))
Houses: 15,465 (13,577 occupied: 6,986 owner occupied, 6,639 renter occupied)
| % of renters here: | 49% |
| State: | 33% |
Housing density: 870 houses/condos per square mile
Median price asked for vacant for-sale houses and condos in 2022: $272,577.
Median contract rent in 2022: $813 (lower quartile is $596, upper quartile is $1,120)
Median rent asked for vacant for-rent units in 2022: $1,064
Median gross rent in Salisbury, NC in 2022: $973
Housing units in Salisbury with a mortgage: 5,014 (357 second mortgage, 0 home equity loan, 303 both second mortgage and home equity loan)
Houses without a mortgage: 147
Median household income for houses/condos with a mortgage: $88,559
Median household income for apartments without a mortgage: $45,579
Median monthly housing costs: $951
Compare current foreclosures in Salisbury, NC:
| Photo | Address | Area | Beds / Baths | Price | Details |
|---|---|---|---|---|---|

|
#1
Old Mocksville Rd
Salisbury, NC 28144
|
1,410 sq. feet
|
2 baths - beds |
show details | |

|
#2
Cox Rd
Salisbury, NC 28146
|
1,191 sq. feet
|
1 baths - beds |
show details | |

|
#3
Robin Cir
Salisbury, NC 28144
|
1,483 sq. feet
|
1 baths - beds |
show details | |

|
#4
Roger Dr
Salisbury, NC 28147
|
1,838 sq. feet
|
2 baths - beds |
show details | |

|
#5
S Merritt Ave
Salisbury, NC 28144
|
1,112 sq. feet
|
1 baths - beds |
show details | |

|
#6
Grim St
Salisbury, NC 28144
|
1,450 sq. feet
|
1 baths - beds |
show details | |

|
#7
Crescent Heights Dr
Salisbury, NC 28146
|
1,512 sq. feet
|
2 baths - beds |
show details | |

|
#8
Ryan St
Salisbury, NC 28144
|
939 sq. feet
|
1 baths - beds |
show details | |

|
#9
Floral Ave
Salisbury, NC 28144
|
884 sq. feet
|
1 baths - beds |
show details | |

|
#10
Faith Rd
Salisbury, NC 28146
|
1,576 sq. feet
|
1 baths - beds |
show details |
| Photo | Address | Area | Beds / Baths | Price | Details |
|---|---|---|---|---|---|

|
#11
Country Ln
Salisbury, NC 28144
|
1,250 sq. feet
|
1 baths - beds |
show details | |

|
#12
S Caldwell St
Salisbury, NC 28144
|
1,803 sq. feet
|
1 baths - beds |
show details | |

|
#13
Us Highway 601
Salisbury, NC 28147
|
2,676 sq. feet
|
1 baths - beds |
show details | |

|
#14
Brookmont Ave
Salisbury, NC 28146
|
1,614 sq. feet
|
2 baths - beds |
show details | |

|
#15
S Jackson St
Salisbury, NC 28144
|
4,103 sq. feet
|
2 baths - beds |
show details | |

|
#16
Sun Fish Ter
Salisbury, NC 28146
|
1,116 sq. feet
|
1 baths - beds |
show details | |

|
#17
Gheen Rd
Salisbury, NC 28147
|
900 sq. feet
|
3 baths - beds |
show details | |

|
#18
Parks Rd
Salisbury, NC 28147
|
858 sq. feet
|
3 baths - beds |
show details | |

|
#19
Vanderford St
Salisbury, NC 28144
|
1,165 sq. feet
|
1 baths - beds |
show details | |

|
#20
S Caldwell St
Salisbury, NC 28144
|
2,015 sq. feet
|
2 baths - beds |
show details |
| Photo | Address | Area | Beds / Baths | Price | Details |
|---|---|---|---|---|---|

|
#21
Red Oak Ln
Salisbury, NC 28146
|
1,424 sq. feet
|
2 baths - beds |
show details | |

|
#22
Wiley Ave
Salisbury, NC 28144
|
1,382 sq. feet
|
1 baths - beds |
show details | |

|
#23
Hurley School Rd
Salisbury, NC 28147
|
1,318 sq. feet
|
1 baths - beds |
show details | |

|
#24
Myron Pl
Salisbury, NC 28144
|
690 sq. feet
|
1 baths - beds |
show details | |

|
#25
Lariat Cir
Salisbury, NC 28144
|
2,768 sq. feet
|
2 baths - beds |
show details | |

|
#26
Crawford St
Salisbury, NC 28144
|
1,006 sq. feet
|
1 baths - beds |
show details | |

|
#27
Morlan Park Rd
Salisbury, NC 28146
|
936 sq. feet
|
1 baths - beds |
show details | |

|
#28
Rowan Gq St
Salisbury, NC 28146
|
1,222 sq. feet
|
1 baths - beds |
show details | |

|
#29
W Horah St
Salisbury, NC 28144
|
868 sq. feet
|
2 baths - beds |
show details | |

|
#30
S Clay St
Salisbury, NC 28144
|
1,025 sq. feet
|
1 baths - beds |
show details |
| Photo | Address | Area | Beds / Baths | Price | Details |
|---|---|---|---|---|---|

|
#31
Messner St
Salisbury, NC 28144
|
861 sq. feet
|
1 baths - beds |
show details | |

|
#32
Parkview Cir
Salisbury, NC 28144
|
1,076 sq. feet
|
1 baths - beds |
show details | |

|
#33
S Caldwell St
Salisbury, NC 28144
|
962 sq. feet
|
1 baths - beds |
show details | |

|
#34
Mirror Lake Rd
Salisbury, NC 28146
|
1,772 sq. feet
|
1 baths - beds |
show details | |

|
#35
Grants Creek Rd
Salisbury, NC 28147
|
1,296 sq. feet
|
2 baths - beds |
show details | |

|
#36
Union Heights Blvd
Salisbury, NC 28146
|
2,100 sq. feet
|
2 baths - beds |
show details | |

|
#37
Ted Ln
Salisbury, NC 28146
|
2,190 sq. feet
|
1 baths - beds |
show details | |

|
#38
Mitchell Ave
Salisbury, NC 28144
|
3,235 sq. feet
|
1 baths - beds |
show details | |

|
#39
Stafford Dr
Salisbury, NC 28144
|
1,728 sq. feet
|
2 baths - beds |
show details | |

|
#40
Weant St
Salisbury, NC 28144
|
- sq. feet
|
- baths - beds |
show details |
| Photo | Address | Area | Beds / Baths | Price | Details |
|---|---|---|---|---|---|

|
#41
Winding Brook Ln
Salisbury, NC 28146
|
- sq. feet
|
- baths - beds |
show details | |

|
#42
Providence Church Rd
Salisbury, NC 28146
|
- sq. feet
|
- baths - beds |
show details | |

|
#43
Road
Salisbury, NC 28146
|
- sq. feet
|
- baths - beds |
show details | |

|
#44
Fries St
Salisbury, NC 28144
|
- sq. feet
|
- baths - beds |
show details | |

|
#45
Ellen St
Salisbury, NC 28146
|
- sq. feet
|
- baths - beds |
show details | |

|
#46
Crane Creek Rd
Salisbury, NC 28146
|
- sq. feet
|
- baths - beds |
show details | |

|
#47
N Long St
Salisbury, NC 28144
|
- sq. feet
|
- baths - beds |
show details | |

|
#48
Carolina Blvd
Salisbury, NC 28146
|
- sq. feet
|
- baths - beds |
show details | |

|
#49
N Salisbury Avenue
Salisbury, NC 28146
|
- sq. feet
|
- baths - beds |
show details | |

|
Check over 1 million property listings on Foreclosure.com!
|
browse all offers | |||

Latest news about housing in Salisbury, NC collected exclusively by city-data.com from local newspapers, TV, and radio stations

 | Homes for sale mooresville (40 replies) |
| "Old money" neighborhoods in North Carolina cities (74 replies) |
| Development in NC (437 replies) |
| Why am I reading that crime rate is super high in Salisbury, NC? (29 replies) |
| Apartments (2 replies) |
| Best places to live near Salisbury , NC?? (2 replies) |

Median year apartment built: 1977
Household type by relationship:
Households: 36,058- Male householders: 5,374 (1,792 living alone), Female householders: 8,115 (2,914 living alone)
5,192 spouses (5,118 opposite-sex spouses), 868 unmarried partners, (839 opposite-sex unmarried partners), 10,282 children (9,827 natural, 61 adopted, 393 stepchildren), 858 grandchildren, 99 brothers or sisters, 165 parents, 65 foster children, 462 other relatives, 767 non-relatives
- In group quarters: 3,804
Size of family households: 3,486 2-persons, 2,096 3-persons, 751 4-persons, 799 5-persons, 342 6-persons, 109 7-or-more-persons.
Size of nonfamily households: 5,326 1-person, 736 2-persons, 80 3-persons, 41 4-persons.
2,908 married couples with children.
5,131 single-parent households (511 men, 4,620 women).
89.2% of residents of Salisbury speak English at home.
7.4% of residents speak Spanish at home (52% speak English very well, 27% speak English well, 18% speak English not well, 4% don't speak English at all).
2.2% of residents speak other Indo-European language at home (66% speak English very well, 14% speak English well, 14% speak English not well, 6% don't speak English at all).
0.8% of residents speak Asian or Pacific Island language at home (53% speak English very well, 41% speak English well, 5% speak English not well).
0.3% of residents speak other language at home (81% speak English very well, 19% speak English well).
Foreign born population: 2,526 (7.0%)
(39.0% of them are naturalized citizens)
| Here: | 6.2 |
| State: | 6.4 |
| Here: | 4.1 |
| State: | 4.4 |

- Bedrooms in owner-occupied houses and condos in Salisbury, North Carolina
- 0no bedroom
- 1051 bedroom
- 1,4662 bedrooms
- 3,8323 bedrooms
- 1,3024 bedrooms
- 2835+ bedrooms

- Bedrooms in renter-occupied apartments in Salisbury, North Carolina
- 217no bedroom
- 9341 bedroom
- 3,1032 bedrooms
- 1,8543 bedrooms
- 4964 bedrooms
- 355+ bedrooms

- Cars and other vehicles available in Salisbury in owner-occupied houses/condos
- 216no vehicle
- 2,2031 vehicle
- 2,8362 vehicles
- 1,3213 vehicles
- 3634 vehicles
- 495+ vehicles

- Cars and other vehicles available in Salisbury in renter-occupied apartments
- 1,252no vehicle
- 3,3531 vehicle
- 1,4242 vehicles
- 5653 vehicles
- 224 vehicles
- 245+ vehicles

- Rooms in owner-occupied houses in Salisbury, North Carolina
- 01 room
- 372 rooms
- 793 rooms
- 7564 rooms
- 1,4285 rooms
- 1,3016 rooms
- 1,1317 rooms
- 9978 rooms
- 1,2589+ rooms

- Rooms in renter-occupied apartments in Salisbury, North Carolina
- 1921 room
- 3812 rooms
- 8273 rooms
- 2,1794 rooms
- 1,6255 rooms
- 6196 rooms
- 4697 rooms
- 2218 rooms
- 1269+ rooms


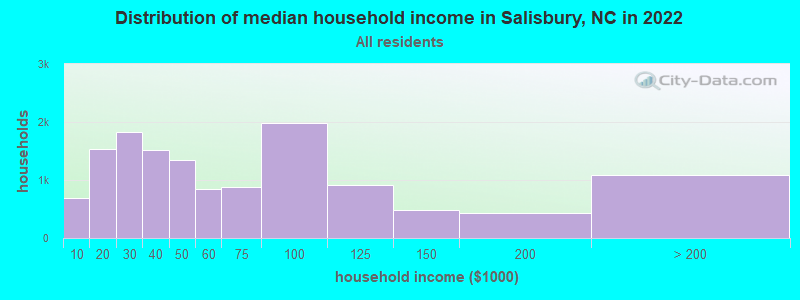
Salisbury, NC household income distribution

- 695Less than $10,000
- 1,542$10,000 to $19,999
- 1,830$20,000 to $29,999
- 1,516$30,000 to $39,999
- 1,342$40,000 to $49,999
- 853$50,000 to $59,999
- 883$60,000 to $74,999
- 1,978$75,000 to $99,999
- 915$100,000 to $124,999
- 480$125,000 to $149,999
- 425$150,000 to $199,999
- 1,084$200,000 or more
Home value of owner - occupied houses in 2022 in Salisbury, NC
-
- 142Less than $10,000
- 46$10,000 to $14,999
- 63$15,000 to $19,999
- 12$30,000 to $34,999
- 6$35,000 to $39,999
- 36$40,000 to $49,999
- 31$50,000 to $59,999
- 369$60,000 to $69,999
- 78$70,000 to $79,999
- 135$80,000 to $89,999
- 365$90,000 to $99,999
- 714$100,000 to $124,999
- 527$125,000 to $149,999
- 473$150,000 to $174,999
- 528$175,000 to $199,999
- 1,087$200,000 to $249,999
- 968$250,000 to $299,999
- 1,066$300,000 to $399,999
- 412$400,000 to $499,999
- 191$500,000 to $749,999
- 239$750,000 to $999,999
- 28$1,000,000 to $1,499,999
- 42$1,500,000 to $1,999,999

Rent paid by renters in 2022 in Salisbury, NC
-
- 100Less than $100
- 35$100 to $149
- 64$150 to $199
- 161$200 to $249
- 109$250 to $299
- 188$300 to $349
- 91$350 to $399
- 272$400 to $449
- 77$450 to $499
- 411$500 to $549
- 197$550 to $599
- 273$600 to $649
- 410$650 to $699
- 456$700 to $749
- 445$750 to $799
- 544$800 to $899
- 599$900 to $999
- 754$1,000 to $1,249
- 414$1,250 to $1,499
- 238$1,500 to $1,999
- 183$2,000 to $2,499
- 75$2,500 to $2,999
- 18$3,000 to $3,499
- 25$3,500 or more
- 271No cash rent


Percentage of workers working in this county: 73.5%
Number of people working at home: 1,494 (9.8% of all workers)
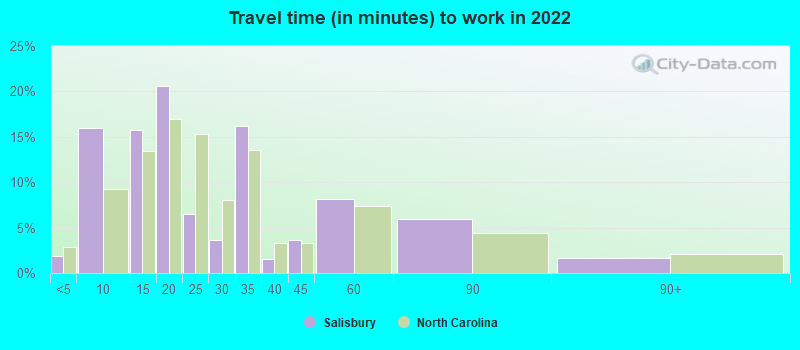
Travel time to work (commute)
- Less than 5 minutes: 405
- 5 to 9 minutes: 3,754
- 10 to 14 minutes: 2,412
- 15 to 19 minutes: 1,867
- 20 to 24 minutes: 1,202
- 25 to 29 minutes: 845
- 30 to 34 minutes: 1,205
- 35 to 39 minutes: 101
- 40 to 44 minutes: 345
- 45 to 59 minutes: 1,152
- 60 to 89 minutes: 775
- 90 or more minutes: 214
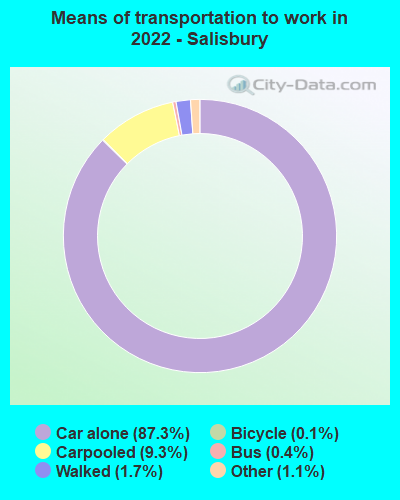
Means of transportation to work:
- Drove a car alone: 22,947 (79.5%)
- Carpooled: 2,547 (8.8%)
- Bus: 80 (0.3%)
- Taxi: 311 (1.1%)
- Bicycle: 37 (0.1%)
- Walked: 469 (1.6%)
- Worked at home: 1,494 (5.2%)

- Unemployment by race in 2022
- Unemployment rate for White non-Hispanic residents
- 4.1%Males
- 3.7%Females
- Unemployment rate for Black residents
- 9.6%Males
- 9.8%Females
- Unemployment rate for other race residents
- 13.8%Females
- Unemployment rate for two or more race residents
- 5.3%Males
- 12.2%Females
- Unemployment rate for Hispanic or Latino residents
- 1.4%Males
- 4.9%Females

- Year of entry for the foreign-born population in Salisbury, North Carolina
- 7242010 or later
- 4952000 to 2009
- 3461990 to 1999
- 2061980 to 1989
- 1101970 to 1979
- 84Before 1970

First ancestries reported:
- German: 1,661 (7.9%)
- American: 1,486 (7.0%)
- English: 1,300 (6.2%)
- Irish: 399 (1.9%)
- Scotch-Irish: 389 (1.8%)
- Italian: 318 (1.5%)
- Scottish: 310 (1.5%)
- European: 191 (0.9%)
- Polish: 170 (0.8%)
- African: 134 (0.6%)
- Liberian: 122 (0.6%)
- Eastern European: 97 (0.5%)
- British: 93 (0.4%)
- Russian: 84 (0.4%)
- Jamaican: 83 (0.4%)
- French: 78 (0.4%)
- Albanian: 54 (0.3%)
- Welsh: 45 (0.2%)
- Sudanese: 31 (0.1%)
- Haitian: 28 (0.1%)
- Romanian: 27 (0.1%)
- Lebanese: 26 (0.1%)
- Swedish: 19 (0.09%)
- Finnish: 16 (0.08%)
- Hungarian: 15 (0.07%)
- Latvian: 15 (0.07%)
- Danish: 14 (0.07%)
- Portuguese: 14 (0.07%)
- Slovak: 13 (0.06%)
- Slovene: 10 (0.05%)
- Swiss: 10 (0.05%)
- Trinidadian and Tobagonian: 9 (0.04%)
- Israeli: 7 (0.03%)
- Northern European: 6 (0.03%)
- French Canadian: 5 (0.02%)
- Canadian: 5 (0.02%)
Most common places of birth for foreign-born residents (%):
| Salisbury: | 27.8% (586) |
| North Carolina: | 24.7% (214,776) |
| Salisbury: | 8.8% (185) |
| North Carolina: | 0.2% (1,745) |
| Salisbury: | 6.8% (144) |
| North Carolina: | 4.7% (40,707) |
| Salisbury: | 6.6% (138) |
| North Carolina: | 0.1% (1,108) |
| Salisbury: | 5.3% (111) |
| North Carolina: | 1.8% (15,534) |
| Salisbury: | 5.0% (106) |
| North Carolina: | 3.8% (33,379) |
| Salisbury: | 4.9% (104) |
| North Carolina: | 2.6% (22,964) |
| Salisbury: | 4.7% (99) |
| North Carolina: | 0.5% (4,475) |
| Salisbury: | 4.1% (86) |
| North Carolina: | 9.3% (80,594) |
| Salisbury: | 3.7% (78) |
| North Carolina: | 1.0% (9,005) |
| Salisbury: | 3.6% (75) |
| North Carolina: | 0.7% (6,161) |
| Salisbury: | 2.4% (51) |
| North Carolina: | 2.1% (18,275) |
| Salisbury: | 1.9% (39) |
| North Carolina: | 0.4% (3,524) |
| Salisbury: | 1.5% (32) |
| North Carolina: | 0.6% (4,847) |
Place of birth for U.S.-born residents:
- This state: 22,393
- Other state: 10,686
- Northeast: 4,185
- Midwest: 1,846
- South: 3,692
- West: 1,031
85.4% of Salisbury residents lived in the same house 1 years ago.
Out of people who lived in different houses, 23.7% lived in this county.
Out of people who lived in different counties, 69.1% lived in North Carolina.
| Salisbury: | 85.4% |
| State average: | 87.3% |
Education attainment for males 25 years and older:
- No schooling: 362
- Nursery to 4th grade: 45
- 5th and 6th grade: 86
- 7th and 8th grade: 171
- 9th grade: 304
- 10th grade: 183
- 11th grade: 392
- 12th grade, no diploma: 207
- High school graduate (or equivalency): 3,666
- Less than 1 year of college: 829
- Some college more than 1 year, no degree: 1,530
- Associate degree: 574
- Bachelor's degree: 2,391
- Master's degree: 624
- Professional school degree: 193
- Doctorate degree: 259

Education attainment for females 25 years and older:
- No schooling: 223
- Nursery to 4th grade: 0
- 5th and 6th grade: 73
- 7th and 8th grade: 262
- 9th grade: 264
- 10th grade: 366
- 11th grade: 114
- 12th grade, no diploma: 48
- High school graduate (or equivalency): 3,175
- Less than 1 year of college: 796
- Some college more than 1 year, no degree: 2,552
- Associate degree: 1,017
- Bachelor's degree: 1,927
- Master's degree: 1,457
- Professional school degree: 142
- Doctorate degree: 140


Housing units in structures:
- One, detached: 9,223
- One, attached: 436
- Two: 626
- 3 or 4: 994
- 5 to 9: 1,371
- 10 to 19: 1,308
- 20 to 49: 272
- 50 or more: 455
- Mobile homes: 776
Median worth of mobile homes: $79,834
Housing units lacking complete kitchen facilities in 2022: 3.4%
House/condo owner moved in on average 9 years ago
Renter moved in on average 2 years ago


- 54.1%Utility gas
- 43.4%Electricity
- 0.9%Fuel oil, kerosene, etc.
- 0.8%Bottled, tank, or LP gas
- 0.6%No fuel used
- 0.2%Wood
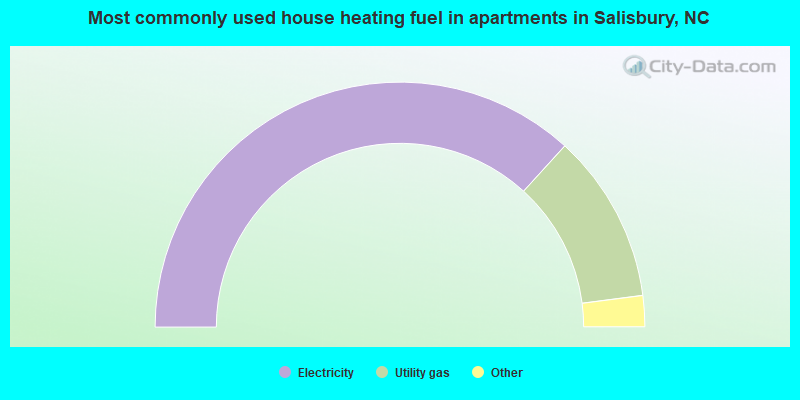
- 73.6%Electricity
- 22.4%Utility gas
- 1.8%Fuel oil, kerosene, etc.
- 1.7%Bottled, tank, or LP gas
- 0.6%No fuel used
Private vs. public school enrollment:
| Here: | 13.4% |
| North Carolina: | 13.8% |
| Here: | 4.8% |
| North Carolina: | 11.9% |
| Here: | 70.6% |
| North Carolina: | 19.3% |


