Jump to a detailed profile or search site with Google Custom Search

Rowland Heights, CA (California) Houses and Residents

Estimated median house or condo value in 2022: $832,886 (it was $209,600 in 2000)
Rowland Heights:

$832,886
California:

$715,900
Lower value quartile - upper value quartile: $636,439 - $1,058,191

Mean price in 2022:

Detached houses: $932,574
Here:

$932,574
State:

$988,808

Townhouses or other attached units: $692,951
Here:

$692,951
State:

$838,546

In 3-to-4-unit structures: $878,426
Here:

$878,426
State:

$824,253

In 5-or-more-unit structures: $3,095,369
Here:

$3,095,369
State:

$730,996

Mobile homes: $90,529
Here:

$90,529
State:

$184,506

Total population: 48,993 (Urban population: 48,254, Rural population: 75 (all nonfarm))

Houses: 15,722 (14,996 occupied: 9,974 owner occupied, 5,079 renter occupied)

% of renters here:

34%
State:

44%

Housing density: 1,742 houses/condos per square mile

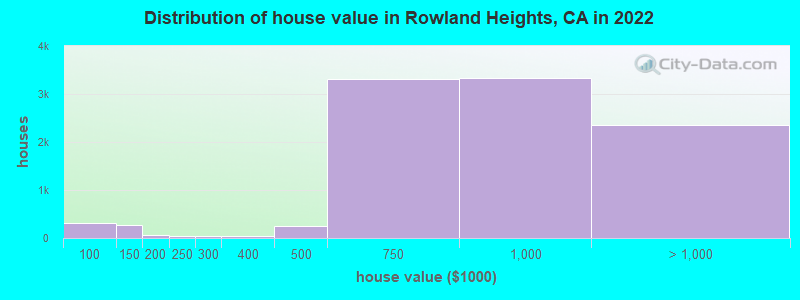
Median price asked for vacant for-sale houses and condos in 2022: $729,327.

Median contract rent in 2022: $1,787 (lower quartile is $1,475, upper quartile is over $2,000)


Median rent asked for vacant for-rent units in 2022: $2,931


Median gross rent in Rowland Heights, CA in 2022: $1,867

Housing units in Rowland Heights with a mortgage: 5,738 (471 second mortgage, 38 home equity loan, 370 both second mortgage and home equity loan)
Houses without a mortgage: 124

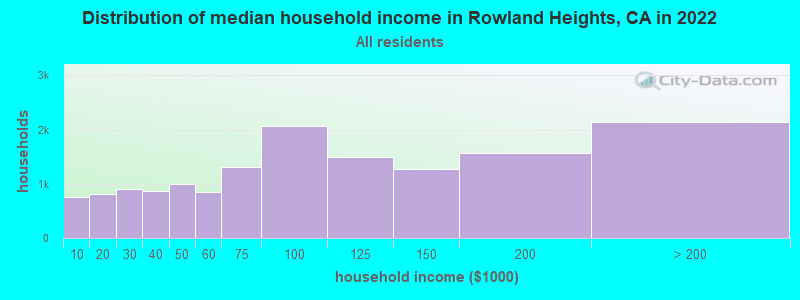
Median household income for houses/condos with a mortgage: $118,045

Median household income for apartments without a mortgage: $84,852

Median monthly housing costs: $1,828

Compare current foreclosures in Rowland Heights, CA:

Check out more offers in Rowland Heights, CA.
Powered by Foreclosure.com

Settings
X
Data:
Loading data...
Based on 2000-2022 data
Loading data...

123
Hide US histogram

Rowland Heights, California Age and Sex of Residents
Median year house/condo built: 1976

Median year apartment built: 1976

Household type by relationship:

Households: 46,184
  • Male householders: 8,356 (986 living alone), Female householders: 6,143 (1,110 living alone)
  • 8,583 spouses (8,539 opposite-sex spouses), 571 unmarried partners, (560 opposite-sex unmarried partners), 12,820 children (12,416 natural, 169 adopted, 234 stepchildren), 1,384 grandchildren, 989 brothers or sisters, 2,585 parents, 0 foster children, 2,343 other relatives, 2,180 non-relatives
  • In group quarters: 225

Size of family households: 4,343 2-persons, 2,912 3-persons, 2,436 4-persons, 1,452 5-persons, 495 6-persons, 449 7-or-more-persons.

Size of nonfamily households: 2,248 1-person, 468 2-persons, 77 3-persons, 63 4-persons, 12 6-persons.

4,468 married couples with children.
1,697 single-parent households (333 men, 1,364 women).

25.1% of residents of Rowland Heights speak English at home.
20.6% of residents speak Spanish at home (52% speak English very well, 27% speak English well, 17% speak English not well, 3% don't speak English at all).
1.6% of residents speak other Indo-European language at home (82% speak English very well, 15% speak English well, 3% speak English not well).
52.4% of residents speak Asian or Pacific Island language at home (38% speak English very well, 30% speak English well, 24% speak English not well, 9% don't speak English at all).
0.3% of residents speak other language at home (75% speak English very well, 17% speak English well, 7% speak English not well).

Foreign born population: 25,305 (54.8%)
(63.5% of them are naturalized citizens)

Median number of rooms in houses and condos:
Here:

6.0
State:

6.0

Median number of rooms in apartments
Here:

4.1
State:

3.9

Owner-occupied Renter-occupied
Bedrooms in owner-occupied houses and condos in Rowland Heights, California
  • Bedrooms in owner-occupied houses and condos in Rowland Heights, California
  • 69no bedroom
  • 471 bedroom
  • 7322 bedrooms
  • 3,4493 bedrooms
  • 4,5784 bedrooms
  • 1,1005+ bedrooms
Bedrooms in renter-occupied apartments in Rowland Heights, California
  • Bedrooms in renter-occupied apartments in Rowland Heights, California
  • 568no bedroom
  • 9721 bedroom
  • 1,4902 bedrooms
  • 1,1063 bedrooms
  • 7534 bedrooms
  • 1915+ bedrooms
Owner-occupied Renter-occupied
Cars and other vehicles available in Rowland Heights in owner-occupied houses/condos
  • Cars and other vehicles available in Rowland Heights in owner-occupied houses/condos
  • 151no vehicle
  • 1,7661 vehicle
  • 3,8652 vehicles
  • 2,4193 vehicles
  • 1,1174 vehicles
  • 6565+ vehicles
Cars and other vehicles available in Rowland Heights in renter-occupied apartments
  • Cars and other vehicles available in Rowland Heights in renter-occupied apartments
  • 397no vehicle
  • 1,5951 vehicle
  • 1,7592 vehicles
  • 9563 vehicles
  • 2674 vehicles
  • 1065+ vehicles
Owner-occupied Renter-occupied
Rooms in owner-occupied houses in Rowland Heights, California
  • Rooms in owner-occupied houses in Rowland Heights, California
  • 261 room
  • 192 rooms
  • 2003 rooms
  • 1,0044 rooms
  • 2,4435 rooms
  • 2,2496 rooms
  • 1,5087 rooms
  • 1,4568 rooms
  • 1,0689+ rooms
Rooms in renter-occupied apartments in Rowland Heights, California
  • Rooms in renter-occupied apartments in Rowland Heights, California
  • 5411 room
  • 3172 rooms
  • 9423 rooms
  • 1,2824 rooms
  • 7855 rooms
  • 5826 rooms
  • 2087 rooms
  • 2058 rooms
  • 2179+ rooms
Year house built
Median 2022 house/condo value by year built
Median house/condo value by year householder moved into unit
Breakdown of mean house values by ages of householders
Owners and renters by unit type in Rowland Heights, CA
  • Rowland Heights, CA household income distribution

  • Distribution of median household income in Rowland Heights, CA in 2022
  • 752Less than $10,000
  • 809$10,000 to $19,999
  • 902$20,000 to $29,999
  • 859$30,000 to $39,999
  • 1,003$40,000 to $49,999
  • 851$50,000 to $59,999
  • 1,315$60,000 to $74,999
  • 2,070$75,000 to $99,999
  • 1,491$100,000 to $124,999
  • 1,279$125,000 to $149,999
  • 1,560$150,000 to $199,999
  • 2,141$200,000 or more
  • Home value of owner - occupied houses in 2022 in Rowland Heights, CA

  • Distribution of house value in Rowland Heights, CA in 2022
  • 5Less than $10,000
  • 10$15,000 to $19,999
  • 41$50,000 to $59,999
  • 46$60,000 to $69,999
  • 76$70,000 to $79,999
  • 19$80,000 to $89,999
  • 118$90,000 to $99,999
  • 222$100,000 to $124,999
  • 41$125,000 to $149,999
  • 71$150,000 to $174,999
  • 34$200,000 to $249,999
  • 42$250,000 to $299,999
  • 49$300,000 to $399,999
  • 250$400,000 to $499,999
  • 3,322$500,000 to $749,999
  • 3,327$750,000 to $999,999
  • 2,144$1,000,000 to $1,499,999
  • 117$1,500,000 to $1,999,999
  • 98$2,000,000 or more
  • Rent paid by renters in 2022 in Rowland Heights, CA

  • Distribution of rent paid by renters in Rowland Heights, CA in 2022
  • 28$200 to $249
  • 9$250 to $299
  • 84$350 to $399
  • 52$400 to $449
  • 8$450 to $499
  • 58$500 to $549
  • 4$550 to $599
  • 6$600 to $649
  • 62$700 to $749
  • 39$800 to $899
  • 30$900 to $999
  • 266$1,000 to $1,249
  • 593$1,250 to $1,499
  • 2,183$1,500 to $1,999
  • 855$2,000 to $2,499
  • 338$2,500 to $2,999
  • 151$3,000 to $3,499
  • 116$3,500 or more
  • 320No cash rent
Time Leaving Home To Go To Work in 2022

Percentage of workers working in this county: 79.4%
Number of people working at home: 3,147 (13.9% of all workers)

Travel time (in minutes) to work in 2022

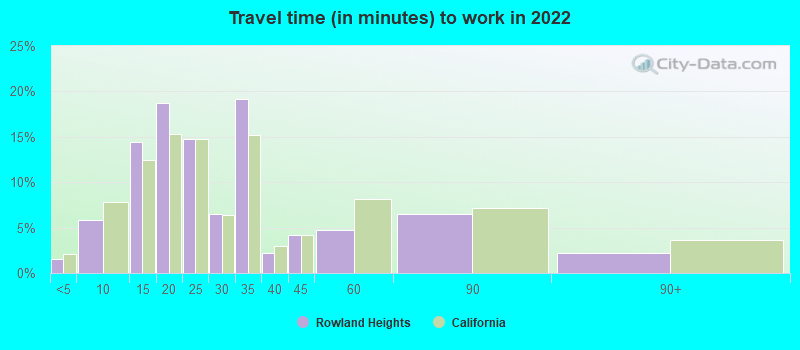
Travel time to work (commute)

  • Less than 5 minutes: 168
  • 5 to 9 minutes: 691
  • 10 to 14 minutes: 2,360
  • 15 to 19 minutes: 2,465
  • 20 to 24 minutes: 2,674
  • 25 to 29 minutes: 1,303
  • 30 to 34 minutes: 3,150
  • 35 to 39 minutes: 549
  • 40 to 44 minutes: 1,458
  • 45 to 59 minutes: 2,137
  • 60 to 89 minutes: 1,606
  • 90 or more minutes: 770
Means of transportation to work in 2022 - Rowland Heights

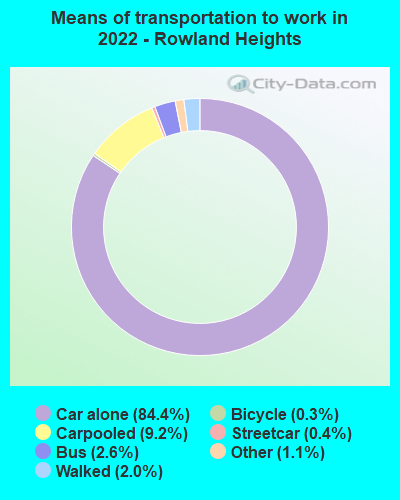
Means of transportation to work:

  • Drove a car alone: 7,267 (63.1%)
  • Carpooled: 876 (7.6%)
  • Bus: 202 (1.8%)
  • Subway or elevated rail: 23 (0.2%)
  • Taxi: 106 (0.9%)
  • Bicycle: 24 (0.2%)
  • Walked: 186 (1.6%)
  • Worked at home: 3,147 (27.3%)
Class of Workers in 2022
  • Unemployment by race in 2022
  • Unemployment rate for White non-Hispanic residents
  • 0.9%Males
  • 4.8%Females
  • Unemployment rate for Black residents
  • 52.2%Females
  • Unemployment rate for American Indian and Alaska Native residents
  • 47.7%Males
  • Unemployment rate for Asian residents
  • 4.0%Males
  • 4.7%Females
  • Unemployment rate for other race residents
  • 4.7%Males
  • 8.1%Females
  • Unemployment rate for two or more race residents
  • 8.3%Males
  • 11.0%Females
  • Unemployment rate for Hispanic or Latino residents
  • 6.2%Males
  • 6.7%Females
Year of entry for the foreign-born population in Rowland Heights, California
  • Year of entry for the foreign-born population in Rowland Heights, California
  • 6,3172010 or later
  • 4,5432000 to 2009
  • 5,3491990 to 1999
  • 8,3981980 to 1989
  • 4,2671970 to 1979
  • 2,327Before 1970
Ancestries in Rowland Heights, CA

First ancestries reported:

  • American: 365 (1.0%)
  • English: 224 (0.6%)
  • Irish: 181 (0.5%)
  • Italian: 146 (0.4%)
  • Russian: 94 (0.3%)
  • German: 89 (0.2%)
  • Palestinian: 60 (0.2%)
  • Armenian: 33 (0.09%)
  • Nigerian: 31 (0.09%)
  • Dutch: 29 (0.08%)
  • French: 29 (0.08%)
  • Norwegian: 24 (0.07%)
  • Polish: 19 (0.05%)
  • Ukrainian: 16 (0.04%)
  • Welsh: 15 (0.04%)
  • European: 12 (0.03%)
  • Hungarian: 12 (0.03%)
  • Scotch-Irish: 12 (0.03%)
  • Lebanese: 10 (0.03%)
  • British: 9 (0.03%)
  • Swedish: 9 (0.03%)
  • Canadian: 8 (0.02%)
  • Scottish: 6 (0.02%)
  • Egyptian: 5 (0.01%)
  • Austrian: 5 (0.01%)
  • Eastern European: 4 (0.01%)

Most common places of birth for foreign-born residents (%):

China, excluding Hong Kong and Taiwan
Rowland Heights:

29.8% (7,546)
California:

6.6% (684,672)

Taiwan
Rowland Heights:

17.2% (4,360)
California:

1.7% (176,274)

Mexico
Rowland Heights:

11.6% (2,946)
California:

37.2% (3,881,193)

Philippines
Rowland Heights:

8.1% (2,040)
California:

7.8% (818,297)

Korea
Rowland Heights:

7.5% (1,897)
California:

3.0% (315,248)

Hong Kong
Rowland Heights:

4.8% (1,210)
California:

1.0% (105,215)

Vietnam
Rowland Heights:

4.7% (1,177)
California:

4.9% (512,335)

El Salvador
Rowland Heights:

2.3% (570)
California:

4.2% (440,287)

Guatemala
Rowland Heights:

2.2% (564)
California:

2.8% (290,436)

Indonesia
Rowland Heights:

2.0% (500)
California:

0.4% (39,097)

Place of birth for U.S.-born residents:

  • This state: 18,360
  • Other state: 2,108
  • Northeast: 453
  • Midwest: 671
  • South: 672
  • West: 304

93.5% of Rowland Heights residents lived in the same house 1 years ago.
   Out of people who lived in different houses, 42.9% lived in this county.
   Out of people who lived in different counties, 54.5% lived in California.


Rowland Heights:

93.5%
State average:

88.9%

Education attainment for males 25 years and older:

  • No schooling: 616
  • Nursery to 4th grade: 222
  • 5th and 6th grade: 228
  • 7th and 8th grade: 220
  • 9th grade: 354
  • 10th grade: 58
  • 11th grade: 136
  • 12th grade, no diploma: 575
  • High school graduate (or equivalency): 4,299
  • Less than 1 year of college: 642
  • Some college more than 1 year, no degree: 1,843
  • Associate degree: 1,441
  • Bachelor's degree: 4,616
  • Master's degree: 1,298
  • Professional school degree: 436
  • Doctorate degree: 165
Educational Attainment for Males

Education attainment for females 25 years and older:

  • No schooling: 841
  • Nursery to 4th grade: 139
  • 5th and 6th grade: 370
  • 7th and 8th grade: 279
  • 9th grade: 391
  • 10th grade: 131
  • 11th grade: 117
  • 12th grade, no diploma: 403
  • High school graduate (or equivalency): 4,487
  • Less than 1 year of college: 607
  • Some college more than 1 year, no degree: 1,968
  • Associate degree: 1,470
  • Bachelor's degree: 4,993
  • Master's degree: 1,290
  • Professional school degree: 295
  • Doctorate degree: 103
Educational Attainment for Females
Rowland Heights marital status for males
Rowland Heights marital status for females

Housing units in structures:

  • One, detached: 11,308
  • One, attached: 587
  • Two: 163
  • 3 or 4: 814
  • 5 to 9: 445
  • 10 to 19: 464
  • 20 to 49: 256
  • 50 or more: 1,027
  • Mobile homes: 636
  • Boats, RVs, vans, etc.: 17

Median worth of mobile homes: $146,571

Housing units lacking complete kitchen facilities in 2022: 1.8%

House/condo owner moved in on average 19 years ago

Renter moved in on average 4 years ago

Year householders moved into residence in Rowland Heights
Houses and condos Apartments
Most commonly used house heating fuel in houses and condos in Rowland Heights, CA
  • 85.1%Utility gas
  • 11.4%Electricity
  • 2.1%Bottled, tank, or LP gas
  • 0.7%No fuel used
  • 0.5%Solar energy
  • 0.1%Fuel oil, kerosene, etc.
Most commonly used house heating fuel in apartments in Rowland Heights, CA
  • 65.8%Utility gas
  • 29.5%Electricity
  • 2.8%No fuel used
  • 1.3%Bottled, tank, or LP gas
  • 0.7%Solar energy

Private vs. public school enrollment:

Students in private schools in grades 1 to 8 (elementary and middle school): 140
Here:

3.9%
California:

10.5%

Students in private schools in grades 9 to 12 (high school): 255
Here:

12.4%
California:

8.5%

Students in private undergraduate colleges: 418
Here:

17.5%
California:

15.9%
School Enrollment by Level of School for Male Students
School Enrollment by Level of School for Female Students
Age and Sex of Sensory-Disabled Noninstitutionalized Residents
Age and Sex of Physically-Disabled Noninstitutionalized Residents
Age and Sex of Mentally-Disabled Noninstitutionalized Residents
Age and Sex of Self-Care Disabled Noninstitutionalized Residents
Age and Sex of Go-Outside-Home Disabled Noninstitutionalized Residents
Age and Sex of Noninstitutionalized Residents with Employment Disability