Roswell, GA (Georgia) Houses and Residents
| Roswell: | $515,200 |
| Georgia: | $297,400 |
Mean price in 2022:
Detached houses: $605,974
Here: $605,974 State: $376,364 Townhouses or other attached units: $447,992
Here: $447,992 State: $341,709 In 3-to-4-unit structures: $256,203
Here: $256,203 State: $250,092 In 5-or-more-unit structures: $349,504
Here: $349,504 State: $370,730 Mobile homes: $106,558
Here: $106,558 State: $102,413
Total population: 94,089 (Urban population: 79,745, Rural population: 99 (all nonfarm))
Houses: 37,144 (34,850 occupied: 26,396 owner occupied, 8,454 renter occupied)
| % of renters here: | 24% |
| State: | 34% |
Housing density: 977 houses/condos per square mile
Median price asked for vacant for-sale houses and condos in 2022: $305,505.
Median contract rent in 2022: $1,606 (lower quartile is $1,297, upper quartile is over $2,000)
Median rent asked for vacant for-rent units in 2022: $1,832
Median gross rent in Roswell, GA in 2022: $1,730
Housing units in Roswell with a mortgage: 19,428 (1,683 second mortgage, 0 home equity loan, 1,683 both second mortgage and home equity loan)
Houses without a mortgage: 361
Median household income for houses/condos with a mortgage: $154,704
Median household income for apartments without a mortgage: $143,673
Median monthly housing costs: $1,872
Compare current foreclosures in Roswell, GA:
| Photo | Address | Area | Beds / Baths | Price | Details |
|---|---|---|---|---|---|

|
#1
Canyon Point Cir
Roswell, GA 30076
|
1,200 sq. feet
|
2 baths 2 beds |
show details | |

|
#2
Nettle Ln NE
Roswell, GA 30075
|
1,882 sq. feet
|
2 baths 3 beds |
show details | |

|
#3
High Creek Trce
Roswell, GA 30076
|
1,280 sq. feet
|
3 baths 3 beds |
show details | |

|
#4
Elkins Rd
Roswell, GA 30076
|
2,654 sq. feet
|
2 baths 4 beds |
show details | |

|
#5
Branch Valley Way
Roswell, GA 30076
|
2,376 sq. feet
|
3 baths 4 beds |
show details | |

|
#6
Ashwood Dr
Roswell, GA 30076
|
3,016 sq. feet
|
2 baths 4 beds |
show details | |

|
#7
Garden Gate Path
Roswell, GA 30075
|
2,961 sq. feet
|
4 baths 4 beds |
show details | |

|
#8
Streamside Dr
Roswell, GA 30076
|
1,249 sq. feet
|
2 baths 2 beds |
show details | |

|
#9
Junction Trak
Roswell, GA 30075
|
3,276 sq. feet
|
2 baths 4 beds |
show details | |

|
#10
Sheringham Ct
Roswell, GA 30076
|
1,263 sq. feet
|
2 baths 3 beds |
show details |
| Photo | Address | Area | Beds / Baths | Price | Details |
|---|---|---|---|---|---|

|
#11
Powder Rdg
Roswell, GA 30076
|
1,824 sq. feet
|
2 baths 3 beds |
show details | |

|
#12
S Smoke Ridge Ct NE
Roswell, GA 30075
|
2,333 sq. feet
|
3 baths 4 beds |
show details | |

|
#13
Dunscore Ct
Roswell, GA 30075
|
3,028 sq. feet
|
2 baths 4 beds |
show details | |

|
#14
Hembree Rd
Roswell, GA 30076
|
2,413 sq. feet
|
2 baths 4 beds |
show details | |

|
#15
Cranberry Pl
Roswell, GA 30076
|
1,904 sq. feet
|
2 baths 3 beds |
show details | |

|
#16
Worthington Hills Ct
Roswell, GA 30076
|
1,080 sq. feet
|
2 baths 3 beds |
show details | |

|
#17
Roxburgh Dr
Roswell, GA 30076
|
2,885 sq. feet
|
3 baths 4 beds |
show details | |

|
#18
Saddle Hill Ct
Roswell, GA 30075
|
2,648 sq. feet
|
5 baths 3 beds |
show details | |

|
#19
River Mill Cir
Roswell, GA 30075
|
1,306 sq. feet
|
2 baths 2 beds |
show details | |

|
#20
Nowata Dr NE
Roswell, GA 30075
|
2,298 sq. feet
|
3 baths 3 beds |
show details |
| Photo | Address | Area | Beds / Baths | Price | Details |
|---|---|---|---|---|---|

|
#21
Anston Dr
Roswell, GA 30075
|
3,428 sq. feet
|
2 baths 4 beds |
show details | |

|
#22
Spring Ridge Dr
Roswell, GA 30076
|
2,712 sq. feet
|
3 baths 5 beds |
show details | |

|
#23
N Smoke Ridge Ct NE
Roswell, GA 30075
|
4,620 sq. feet
|
3 baths 4 beds |
show details | |

|
#24
Sloan St
Roswell, GA 30075
|
1,040 sq. feet
|
3 baths 5 beds |
show details | |

|
#25
Roswell Farms Rd
Roswell, GA 30075
|
1,890 sq. feet
|
2 baths 4 beds |
show details | |

|
#26
Old Alabama Pl
Roswell, GA 30076
|
2,004 sq. feet
|
2 baths 4 beds |
show details | |

|
#27
Carleigh Ln
Roswell, GA 30076
|
2,154 sq. feet
|
3 baths 4 beds |
show details | |

|
#28
Spring Dr
Roswell, GA 30075
|
1,312 sq. feet
|
1 baths 2 beds |
show details | |

|
#29
Old Path Xing
Roswell, GA 30075
|
4,286 sq. feet
|
3 baths 4 beds |
show details | |

|
#30
Barrington Dr E
Roswell, GA 30076
|
1,700 sq. feet
|
2 baths 3 beds |
show details |
| Photo | Address | Area | Beds / Baths | Price | Details |
|---|---|---|---|---|---|

|
#31
Cranberry Trl
Roswell, GA 30076
|
1,348 sq. feet
|
2 baths 3 beds |
show details | |

|
#32
Shallowford Park Mnr
Roswell, GA 30075
|
3,362 sq. feet
|
4 baths 5 beds |
show details | |

|
#33
Litchfield Pl
Roswell, GA 30076
|
1,782 sq. feet
|
2 baths 3 beds |
show details | |

|
#34
Waters Edge Trl
Roswell, GA 30075
|
2,500 sq. feet
|
2 baths 2 beds |
show details | |

|
#35
Aran Dr
Roswell, GA 30076
|
7,003 sq. feet
|
4 baths 5 beds |
show details | |

|
#36
Liberty Ln
Roswell, GA 30075
|
1,125 sq. feet
|
1 baths 1 beds |
show details | |

|
#37
Juniper St
Roswell, GA 30075
|
1,624 sq. feet
|
2 baths 3 beds |
show details | |

|
#38
High Creek Dr
Roswell, GA 30076
|
1,240 sq. feet
|
2 baths 2 beds |
show details | |

|
#39
Alpharetta Hwy Unit 2222
Roswell, GA 30077
|
- sq. feet
|
- baths - beds |
show details | |

|
#40
Barrington Oaks Pl
Roswell, GA 30075
|
- sq. feet
|
- baths - beds |
show details |
| Photo | Address | Area | Beds / Baths | Price | Details |
|---|---|---|---|---|---|

|
#41
Hemingway Ln
Roswell, GA 30075
|
- sq. feet
|
- baths - beds |
show details | |

|
#42
Misty Ln
Roswell, GA 30076
|
- sq. feet
|
- baths - beds |
show details | |

|
#43
Calibre Creek Pkwy
Roswell, GA 30076
|
- sq. feet
|
- baths - beds |
show details | |

|
#44
Raintree Dr Apt F
Roswell, GA 30076
|
- sq. feet
|
- baths - beds |
show details | |

|
#45
Riverwood Ln Apt B
Roswell, GA 30075
|
- sq. feet
|
- baths - beds |
show details | |

|
#46
Clara Dr
Roswell, GA 30075
|
- sq. feet
|
- baths - beds |
show details | |

|
#47
Harbor Lndg
Roswell, GA 30076
|
- sq. feet
|
- baths - beds |
show details | |

|
#48
Atherton Park
Roswell, GA 30076
|
- sq. feet
|
- baths - beds |
show details | |

|
#49
Calibre Creek Pkwy
Roswell, GA 30076
|
- sq. feet
|
- baths - beds |
show details | |

|
Check over 1 million property listings on Foreclosure.com!
|
browse all offers | |||

Latest news about housing in Roswell, GA collected exclusively by city-data.com from local newspapers, TV, and radio stations


Median year apartment built: 1990
Household type by relationship:
Households: 92,945- Male householders: 18,063 (3,061 living alone), Female householders: 16,787 (4,839 living alone)
19,630 spouses (19,498 opposite-sex spouses), 2,713 unmarried partners, (2,511 opposite-sex unmarried partners), 28,895 children (27,298 natural, 980 adopted, 617 stepchildren), 1,213 grandchildren, 420 brothers or sisters, 1,075 parents, 0 foster children, 604 other relatives, 2,807 non-relatives
- In group quarters: 738
Size of family households: 9,872 2-persons, 6,425 3-persons, 5,334 4-persons, 1,947 5-persons, 722 6-persons, 399 7-or-more-persons.
Size of nonfamily households: 7,900 1-person, 1,999 2-persons, 252 3-persons.
15,071 married couples with children.
5,285 single-parent households (2,122 men, 3,163 women).
77.4% of residents of Roswell speak English at home.
13.6% of residents speak Spanish at home (55% speak English very well, 18% speak English well, 18% speak English not well, 8% don't speak English at all).
4.9% of residents speak other Indo-European language at home (62% speak English very well, 30% speak English well, 6% speak English not well, 1% don't speak English at all).
2.7% of residents speak Asian or Pacific Island language at home (56% speak English very well, 29% speak English well, 15% speak English not well).
1.5% of residents speak other language at home (90% speak English very well, 7% speak English well, 3% don't speak English at all).
Foreign born population: 14,341 (15.4%)
(62.8% of them are naturalized citizens)
| Here: | 8.3 |
| State: | 6.8 |
| Here: | 4.3 |
| State: | 4.6 |

- Bedrooms in owner-occupied houses and condos in Roswell, Georgia
- 50no bedroom
- 751 bedroom
- 1,9572 bedrooms
- 7,3013 bedrooms
- 11,4934 bedrooms
- 5,5205+ bedrooms

- Bedrooms in renter-occupied apartments in Roswell, Georgia
- 269no bedroom
- 3,1921 bedroom
- 3,0652 bedrooms
- 1,3813 bedrooms
- 3324 bedrooms
- 2155+ bedrooms

- Cars and other vehicles available in Roswell in owner-occupied houses/condos
- 597no vehicle
- 5,4731 vehicle
- 13,6822 vehicles
- 4,5843 vehicles
- 1,4524 vehicles
- 6085+ vehicles

- Cars and other vehicles available in Roswell in renter-occupied apartments
- 865no vehicle
- 4,6171 vehicle
- 2,2252 vehicles
- 4983 vehicles
- 1834 vehicles
- 665+ vehicles

- Rooms in owner-occupied houses in Roswell, Georgia
- 501 room
- 02 rooms
- 2493 rooms
- 8894 rooms
- 2,3445 rooms
- 3,0556 rooms
- 3,3437 rooms
- 3,8618 rooms
- 12,6059+ rooms

- Rooms in renter-occupied apartments in Roswell, Georgia
- 2691 room
- 9292 rooms
- 1,0193 rooms
- 2,4814 rooms
- 1,7465 rooms
- 7956 rooms
- 3907 rooms
- 3528 rooms
- 4739+ rooms


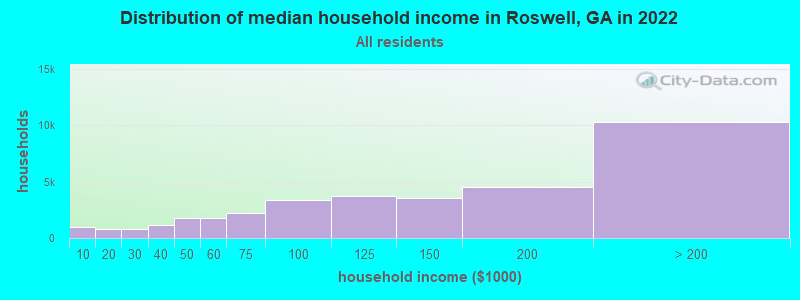
Roswell, GA household income distribution

- 938Less than $10,000
- 755$10,000 to $19,999
- 810$20,000 to $29,999
- 1,187$30,000 to $39,999
- 1,793$40,000 to $49,999
- 1,747$50,000 to $59,999
- 2,201$60,000 to $74,999
- 3,409$75,000 to $99,999
- 3,686$100,000 to $124,999
- 3,560$125,000 to $149,999
- 4,482$150,000 to $199,999
- 10,282$200,000 or more
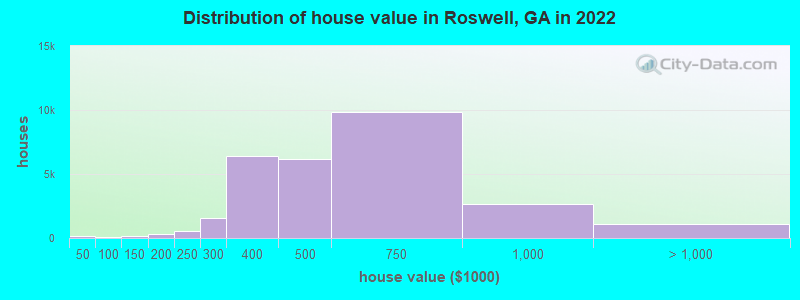
Home value of owner - occupied houses in 2022 in Roswell, GA
-
- 78Less than $10,000
- 9$10,000 to $14,999
- 15$20,000 to $24,999
- 34$40,000 to $49,999
- 6$50,000 to $59,999
- 22$80,000 to $89,999
- 31$90,000 to $99,999
- 107$100,000 to $124,999
- 63$125,000 to $149,999
- 184$150,000 to $174,999
- 148$175,000 to $199,999
- 518$200,000 to $249,999
- 1,533$250,000 to $299,999
- 6,431$300,000 to $399,999
- 6,179$400,000 to $499,999
- 9,814$500,000 to $749,999
- 2,661$750,000 to $999,999
- 711$1,000,000 to $1,499,999
- 256$1,500,000 to $1,999,999
- 161$2,000,000 or more
Rent paid by renters in 2022 in Roswell, GA
-
- 34Less than $100
- 11$150 to $199
- 47$200 to $249
- 11$250 to $299
- 2$350 to $399
- 48$400 to $449
- 9$450 to $499
- 18$550 to $599
- 36$700 to $749
- 15$750 to $799
- 90$800 to $899
- 229$900 to $999
- 1,784$1,000 to $1,249
- 2,508$1,250 to $1,499
- 3,570$1,500 to $1,999
- 903$2,000 to $2,499
- 91$2,500 to $2,999
- 285$3,000 to $3,499
- 253$3,500 or more
- 392No cash rent


Percentage of workers working in this county: 81.5%
Number of people working at home: 16,771 (33.4% of all workers)
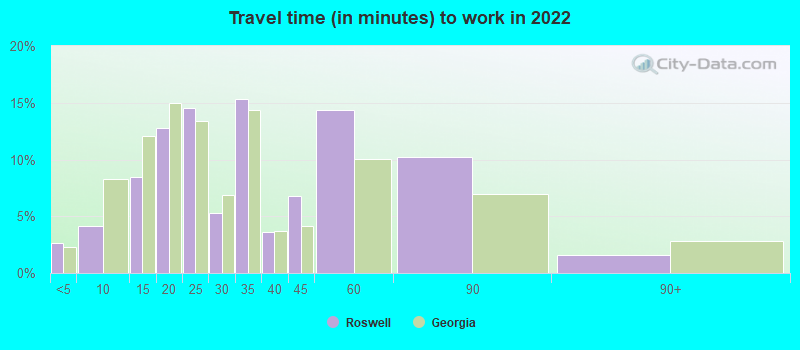
Travel time to work (commute)
- Less than 5 minutes: 1,126
- 5 to 9 minutes: 2,565
- 10 to 14 minutes: 3,970
- 15 to 19 minutes: 4,885
- 20 to 24 minutes: 4,015
- 25 to 29 minutes: 1,026
- 30 to 34 minutes: 3,993
- 35 to 39 minutes: 1,181
- 40 to 44 minutes: 2,320
- 45 to 59 minutes: 4,593
- 60 to 89 minutes: 2,389
- 90 or more minutes: 514
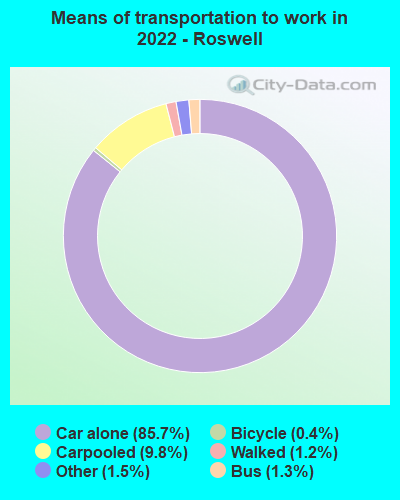
Means of transportation to work:
- Drove a car alone: 32,990 (62.5%)
- Carpooled: 4,145 (7.9%)
- Bus: 370 (0.7%)
- Subway or elevated rail: 19 (0.0%)
- Taxi: 549 (1.0%)
- Bicycle: 145 (0.3%)
- Walked: 486 (0.9%)
- Worked at home: 16,771 (31.8%)

- Unemployment by race in 2022
- Unemployment rate for White non-Hispanic residents
- 1.1%Males
- 1.4%Females
- Unemployment rate for Black residents
- 7.2%Males
- 8.5%Females
- Unemployment rate for American Indian and Alaska Native residents
- 15.4%Males
- Unemployment rate for Asian residents
- 1.8%Males
- 2.7%Females
- Unemployment rate for other race residents
- 1.1%Males
- 3.2%Females
- Unemployment rate for two or more race residents
- 6.9%Males
- 3.8%Females
- Unemployment rate for Hispanic or Latino residents
- 6.4%Males
- 1.9%Females

- Year of entry for the foreign-born population in Roswell, Georgia
- 5,3952010 or later
- 5,6552000 to 2009
- 3,9191990 to 1999
- 2,3851980 to 1989
- 1,0741970 to 1979
- 847Before 1970
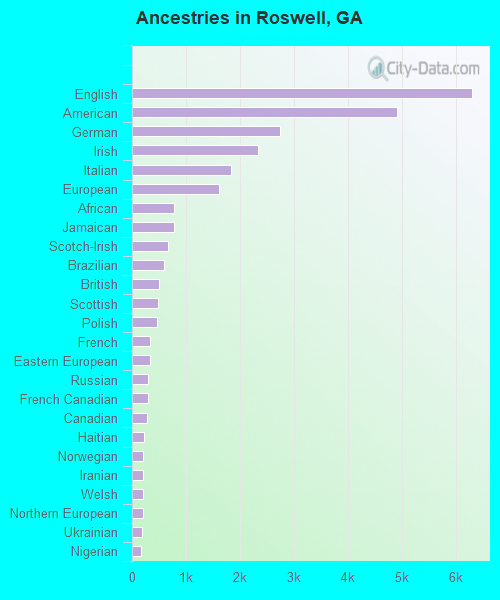
First ancestries reported:
- English: 6,299 (12.9%)
- American: 4,903 (10.1%)
- German: 2,742 (5.6%)
- Irish: 2,332 (4.8%)
- Italian: 1,827 (3.8%)
- European: 1,618 (3.3%)
- African: 784 (1.6%)
- Jamaican: 773 (1.6%)
- Scotch-Irish: 675 (1.4%)
- Brazilian: 593 (1.2%)
- British: 498 (1.0%)
- Scottish: 483 (1.0%)
- Polish: 468 (1.0%)
- French: 338 (0.7%)
- Eastern European: 338 (0.7%)
- Russian: 305 (0.6%)
- French Canadian: 291 (0.6%)
- Canadian: 281 (0.6%)
- Haitian: 214 (0.4%)
- Norwegian: 210 (0.4%)
- Iranian: 207 (0.4%)
- Welsh: 204 (0.4%)
- Northern European: 204 (0.4%)
- Ukrainian: 183 (0.4%)
- Nigerian: 168 (0.3%)
- Czech: 166 (0.3%)
- Swedish: 148 (0.3%)
- Romanian: 135 (0.3%)
- Austrian: 128 (0.3%)
- Ghanaian: 108 (0.2%)
- Lebanese: 105 (0.2%)
- Trinidadian and Tobagonian: 97 (0.2%)
- Dutch: 86 (0.2%)
- Israeli: 83 (0.2%)
- Danish: 73 (0.1%)
- Hungarian: 69 (0.1%)
- Portuguese: 69 (0.1%)
- Lithuanian: 56 (0.1%)
- Greek: 53 (0.1%)
- Ethiopian: 53 (0.1%)
- Iraqi: 53 (0.1%)
- South African: 50 (0.1%)
- Turkish: 44 (0.09%)
- Alsatian: 33 (0.07%)
- Slovak: 30 (0.06%)
- Bulgarian: 29 (0.06%)
- Bahamian: 24 (0.05%)
- Swiss: 23 (0.05%)
- Croatian: 22 (0.05%)
- Kenyan: 20 (0.04%)
- Latvian: 20 (0.04%)
- Celtic: 18 (0.04%)
- Jordanian: 18 (0.04%)
- British West Indian: 15 (0.03%)
- Australian: 13 (0.03%)
- Czechoslovakian: 12 (0.02%)
- Guyanese: 9 (0.02%)
- Scandinavian: 8 (0.02%)
- Slavic: 8 (0.02%)
- Finnish: 7 (0.01%)
- Belgian: 7 (0.01%)
- Icelander: 7 (0.01%)
Most common places of birth for foreign-born residents (%):
| Roswell: | 19.8% (3,698) |
| Georgia: | 20.0% (223,400) |
| Roswell: | 8.5% (1,593) |
| Georgia: | 1.6% (18,211) |
| Roswell: | 5.5% (1,022) |
| Georgia: | 1.7% (19,012) |
| Roswell: | 5.1% (956) |
| Georgia: | 9.2% (103,325) |
| Roswell: | 4.6% (867) |
| Georgia: | 4.6% (51,270) |
| Roswell: | 4.6% (862) |
| Georgia: | 2.1% (23,813) |
| Roswell: | 4.1% (758) |
| Georgia: | 1.6% (17,851) |
| Roswell: | 2.5% (467) |
| Georgia: | 3.9% (43,756) |
| Roswell: | 2.3% (431) |
| Georgia: | 0.3% (3,330) |
| Roswell: | 2.2% (416) |
| Georgia: | 1.8% (20,700) |
| Roswell: | 2.2% (403) |
| Georgia: | 3.5% (39,227) |
| Roswell: | 1.9% (357) |
| Georgia: | 0.8% (9,101) |
| Roswell: | 1.7% (312) |
| Georgia: | 2.5% (27,794) |
| Roswell: | 1.5% (281) |
| Georgia: | 0.8% (8,613) |
Place of birth for U.S.-born residents:
- This state: 31,988
- Other state: 44,966
- Northeast: 10,381
- Midwest: 10,438
- South: 20,109
- West: 4,038
90.2% of Roswell residents lived in the same house 1 years ago.
Out of people who lived in different houses, 29.4% lived in this county.
Out of people who lived in different counties, 38.4% lived in Georgia.
| Roswell: | 90.2% |
| State average: | 86.6% |
Education attainment for males 25 years and older:
- No schooling: 71
- Nursery to 4th grade: 82
- 5th and 6th grade: 451
- 7th and 8th grade: 323
- 9th grade: 199
- 10th grade: 0
- 11th grade: 74
- 12th grade, no diploma: 185
- High school graduate (or equivalency): 2,913
- Less than 1 year of college: 1,002
- Some college more than 1 year, no degree: 1,849
- Associate degree: 1,866
- Bachelor's degree: 13,390
- Master's degree: 5,700
- Professional school degree: 1,310
- Doctorate degree: 853

Education attainment for females 25 years and older:
- No schooling: 109
- Nursery to 4th grade: 93
- 5th and 6th grade: 201
- 7th and 8th grade: 0
- 9th grade: 88
- 10th grade: 38
- 11th grade: 71
- 12th grade, no diploma: 365
- High school graduate (or equivalency): 3,928
- Less than 1 year of college: 1,651
- Some college more than 1 year, no degree: 3,849
- Associate degree: 2,069
- Bachelor's degree: 15,567
- Master's degree: 4,650
- Professional school degree: 1,002
- Doctorate degree: 558


Housing units in structures:
- One, detached: 23,227
- One, attached: 4,099
- Two: 497
- 3 or 4: 914
- 5 to 9: 3,136
- 10 to 19: 1,677
- 20 to 49: 1,411
- 50 or more: 2,183
House/condo owner moved in on average 10 years ago
Renter moved in on average 3 years ago

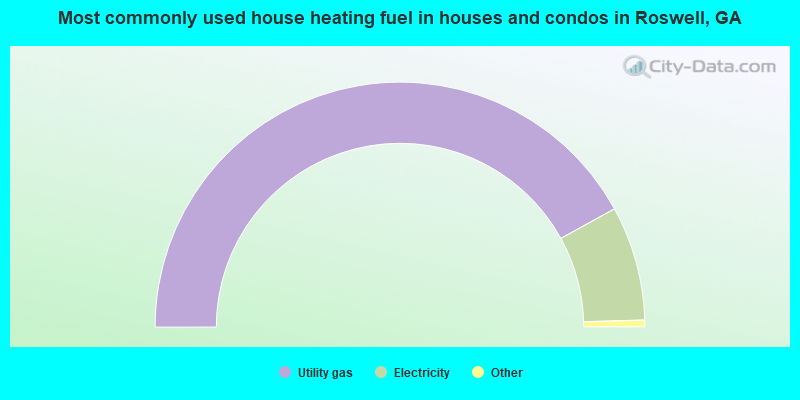
- 84.0%Utility gas
- 15.1%Electricity
- 0.6%Bottled, tank, or LP gas
- 0.1%No fuel used
- 0.1%Wood
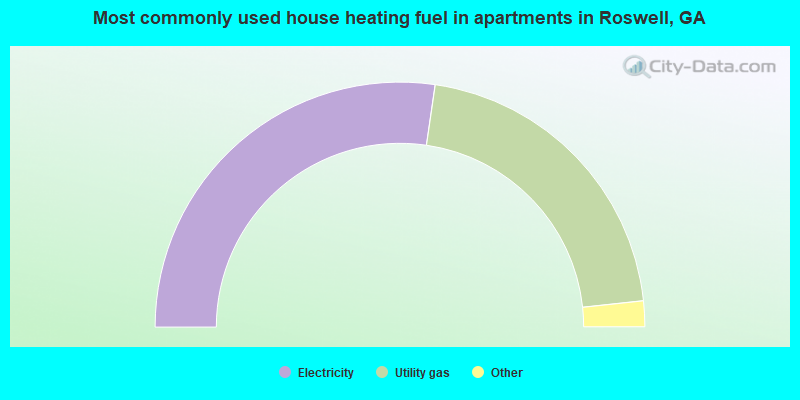
- 54.6%Electricity
- 42.0%Utility gas
- 2.2%Bottled, tank, or LP gas
- 1.2%No fuel used
Private vs. public school enrollment:
| Here: | 21.9% |
| Georgia: | 12.1% |
| Here: | 20.5% |
| Georgia: | 10.8% |
| Here: | 13.3% |
| Georgia: | 17.1% |


