Rossmoor, MD (Maryland) Houses and Residents
| Rossmoor: | $426,826 |
| Maryland: | $398,100 |
Total population: 8,122 (Urban population: 7,573, Rural population: 0)
Houses: 5,339 (4,849 occupied: 4,329 owner occupied, 520 renter occupied)
| % of renters here: | 11% |
| State: | 32% |
Housing density: 4,880 houses/condos per square mile
Median price asked for vacant for-sale houses and condos in 2022 in this county: $868,821.
Median contract rent in 2022: over $2,000
Median rent asked for vacant for-rent units in 2022: $4,076
Median gross rent in Rossmoor, MD in 2022: over $2,000
Housing units in Rossmoor with a mortgage: 835 (90 second mortgage, 81 home equity loan, 0 both second mortgage and home equity loan)
Houses without a mortgage: 607
Compare current foreclosures near Rossmoor, MD:
| Photo | Address | Area | Beds / Baths | Price | Details |
|---|---|---|---|---|---|

|
#1
Interlachen Dr Apt 111
Silver Spring, MD 20906
|
965 sq. feet
|
1 baths 2 beds |
$148,000
|
show details |

|
#2
Cathedral Ave NW Apt 108
Washington, DC 20016
|
765 sq. feet
|
1 baths 1 beds |
$269,900
|
show details |

|
#3
Pooks Hill Rd Apt 1612s
Bethesda, MD 20814
|
1,250 sq. feet
|
1 baths 2 beds |
$289,000
|
show details |

|
#4
19th St NW
Washington, DC 20036
|
2,515 sq. feet
|
6 baths 8 beds |
$1,684,800
|
show details |

|
#5
17th St NW Apt 504
Washington, DC 20009
|
800 sq. feet
|
1 baths 1 beds |
$405,000
|
show details |

|
#6
Mandan Rd Apt 103 Unit 621
Greenbelt, MD 20770
|
1,420 sq. feet
|
2 baths 3 beds |
$179,900
|
show details |

|
#7
Brooke Knolls Rd
Gaithersburg, MD 20882
|
1,704 sq. feet
|
3 baths 4 beds |
$681,500
|
show details |

|
#8
Wilson Ln Apt 204
Mc Lean, VA 22102
|
925 sq. feet
|
1 baths 2 beds |
$359,900
|
show details |

|
#9
Monroe St NW
Washington, DC 20010
|
- sq. feet
|
2 baths 2 beds |
$665,000
|
show details |

|
#10
Addison Rd
Capitol Heights, MD 20743
|
1,400 sq. feet
|
1 baths 3 beds |
$260,000
|
show details |
| Photo | Address | Area | Beds / Baths | Price | Details |
|---|---|---|---|---|---|

|
#11
9th St NW
Washington, DC 20011
|
1,604 sq. feet
|
2 baths 3 beds |
$598,000
|
show details |

|
#12
Eastern Ave NE
Washington, DC 20011
|
1,024 sq. feet
|
1 baths 3 beds |
$395,000
|
show details |

|
#13
Hammersmith Cir
Silver Spring, MD 20906
|
1,152 sq. feet
|
1 baths 3 beds |
$353,600
|
show details |

|
#14
Delaware Ave SW Apt N720
Washington, DC 20024
|
- sq. feet
|
1 baths 1 beds |
$149,900
|
show details |

|
#15
Holbrook Ter NE
Washington, DC 20002
|
3,164 sq. feet
|
4 baths 8 beds |
show details | |

|
#16
Avena St
Silver Spring, MD 20902
|
1,188 sq. feet
|
2 baths 3 beds |
show details | |

|
#17
Blaine St NE
Washington, DC 20019
|
960 sq. feet
|
1 baths 3 beds |
show details | |

|
#18
Deanwood Dr
Capitol Heights, MD 20743
|
640 sq. feet
|
1 baths 1 beds |
show details | |

|
#19
Grant St NE
Washington, DC 20019
|
1,152 sq. feet
|
1 baths 3 beds |
show details | |

|
#20
Brooke Rd
Sandy Spring, MD 20860
|
5,046 sq. feet
|
4 baths 4 beds |
show details |
| Photo | Address | Area | Beds / Baths | Price | Details |
|---|---|---|---|---|---|

|
#21
Pearl Fog Way
Dunn Loring, VA 22027
|
3,497 sq. feet
|
4 baths 4 beds |
show details | |

|
#22
Plainfield St
Falls Church, VA 22043
|
1,102 sq. feet
|
3 baths 4 beds |
show details | |

|
#23
Foote St NE
Washington, DC 20019
|
1,000 sq. feet
|
1 baths 3 beds |
show details | |

|
#24
Tremayne Pl Apt 309
Mc Lean, VA 22102
|
1,180 sq. feet
|
2 baths 2 beds |
show details | |

|
#25
47th St NE
Washington, DC 20019
|
2,363 sq. feet
|
2 baths 5 beds |
show details | |

|
#26
Morse St NE
Washington, DC 20002
|
1,836 sq. feet
|
2 baths 3 beds |
show details | |

|
#27
Oakland Mills Rd
Columbia, MD 21046
|
- sq. feet
|
3 baths 4 beds |
show details | |

|
#28
New York Ave NW Apt 402
Washington, DC 20001
|
842 sq. feet
|
1 baths 2 beds |
show details | |

|
#29
55th Ave
Bladensburg, MD 20710
|
1,023 sq. feet
|
3 baths 5 beds |
show details | |

|
#30
Berryville Rd
Germantown, MD 20874
|
960 sq. feet
|
1 baths 3 beds |
show details |
| Photo | Address | Area | Beds / Baths | Price | Details |
|---|---|---|---|---|---|

|
#31
Manor Ln
Ellicott City, MD 21042
|
864 sq. feet
|
1 baths 2 beds |
show details | |

|
#32
16th St NW Apt 305
Washington, DC 20009
|
1,158 sq. feet
|
1 baths 2 beds |
show details | |

|
#33
Softwater Way
Columbia, MD 21046
|
1,520 sq. feet
|
3 baths 4 beds |
show details | |

|
#34
Mcwhorter Farm Ct
Damascus, MD 20872
|
6,621 sq. feet
|
6 baths 5 beds |
show details | |

|
#35
Palmetto Cir
Germantown, MD 20874
|
1,135 sq. feet
|
2 baths 3 beds |
show details | |

|
#36
Connecticut Ave NW Apt 606
Washington, DC 20008
|
160 sq. feet
|
1 baths 1 beds |
show details | |

|
#37
Sargent Rd NE
Washington, DC 20017
|
1,360 sq. feet
|
2 baths 3 beds |
show details | |

|
#38
Brassie Pl Apt 201
Montgomery Village, MD 20886
|
1,054 sq. feet
|
2 baths 2 beds |
show details | |

|
#39
13th Ave
Hyattsville, MD 20782
|
1,598 sq. feet
|
1 baths 4 beds |
show details | |

|
#40
S Arbory Ln
Laurel, MD 20707
|
1,283 sq. feet
|
3 baths 3 beds |
show details |
| Photo | Address | Area | Beds / Baths | Price | Details |
|---|---|---|---|---|---|

|
#41
Jefferson St NW
Washington, DC 20011
|
1,280 sq. feet
|
5 baths 6 beds |
show details | |

|
#42
Navahoe St
Hyattsville, MD 20783
|
1,068 sq. feet
|
2 baths 3 beds |
show details | |

|
#43
Carrollsburg Pl SW
Washington, DC 20024
|
1,720 sq. feet
|
2 baths 3 beds |
show details | |

|
#44
Rhode Island Ave NW Apt 202
Washington, DC 20005
|
604 sq. feet
|
1 baths 1 beds |
show details | |

|
#45
Anacostia Rd SE
Washington, DC 20019
|
1,008 sq. feet
|
2 baths 4 beds |
show details | |

|
#46
Myrtle Ave
Bowie, MD 20720
|
3,436 sq. feet
|
2 baths 4 beds |
show details | |

|
#47
N Capitol St NW
Washington, DC 20012
|
896 sq. feet
|
1 baths 2 beds |
show details | |

|
#48
27th St NE
Washington, DC 20018
|
918 sq. feet
|
1 baths 2 beds |
show details | |

|
#49
Eaton Dr
Mc Lean, VA 22102
|
7,634 sq. feet
|
8 baths 5 beds |
show details | |

|
Check over 1 million property listings on Foreclosure.com!
|
browse all offers | |||
Latest news about housing in Rossmoor, MD collected exclusively by city-data.com from local newspapers, TV, and radio stations

 | Where to live in Montgomery County, commute to College Park? (18 replies) |

Household type by relationship:
Households: 962,877- In family households: 818,609 (170,949 male householders, 73,949 female householders)
190,571 spouses, 287,257 children (273,230 natural, 6,853 adopted, 7,174 stepchildren), 12,668 grandchildren, 13,356 brothers or sisters, 12,424 parents, foster children, 20,293 other relatives, 29,004 non-relatives
- In nonfamily households: 144,268 (45,103 male householders (33,162 living alone)), 67,085 female householders (56,102 living alone)), 32,080 nonrelatives
- In group quarters: 8,900 (5,864 institutionalized population)
167,990 married couples with children.
37,951 single-parent households (7,214 men, 30,737 women).
85.7% of residents of Rossmoor speak English at home.
4.5% of residents speak Spanish at home (50% speak English very well, 32% speak English well, 14% speak English not well, 4% don't speak English at all).
4.3% of residents speak other Indo-European language at home (88% speak English very well, 12% speak English well).
2.6% of residents speak Asian or Pacific Island language at home (57% speak English very well, 28% speak English well, 15% speak English not well).
2.9% of residents speak other language at home (87% speak English very well, 13% speak English well).
Foreign born population: 1,906 (20.9%)
(80.7% of them are naturalized citizens)
| Here: | 4.4 |
| State: | 7.3 |
| Here: | 5.2 |
| State: | 4.2 |

- Bedrooms in owner-occupied houses and condos in Rossmoor, Maryland
- 17no bedroom
- 6271 bedroom
- 2,4052 bedrooms
- 1,0563 bedrooms
- 1934 bedrooms
- 315+ bedrooms

- Bedrooms in renter-occupied apartments in Rossmoor, Maryland
- 0no bedroom
- 2251 bedroom
- 1972 bedrooms
- 573 bedrooms
- 414 bedrooms
- 05+ bedrooms

- Cars and other vehicles available in Rossmoor in owner-occupied houses/condos
- 598no vehicle
- 2,8481 vehicle
- 8202 vehicles
- 483 vehicles
- 84 vehicles
- 75+ vehicles

- Cars and other vehicles available in Rossmoor in renter-occupied apartments
- 174no vehicle
- 2611 vehicle
- 582 vehicles
- 273 vehicles
- 04 vehicles
- 05+ vehicles

- Rooms in owner-occupied houses in Rossmoor, Maryland
- 01 room
- 752 rooms
- 3853 rooms
- 1,0714 rooms
- 1,5565 rooms
- 7756 rooms
- 1937 rooms
- 1778 rooms
- 979+ rooms

- Rooms in renter-occupied apartments in Rossmoor, Maryland
- 01 room
- 432 rooms
- 1673 rooms
- 984 rooms
- 1015 rooms
- 546 rooms
- 157 rooms
- 218 rooms
- 219+ rooms


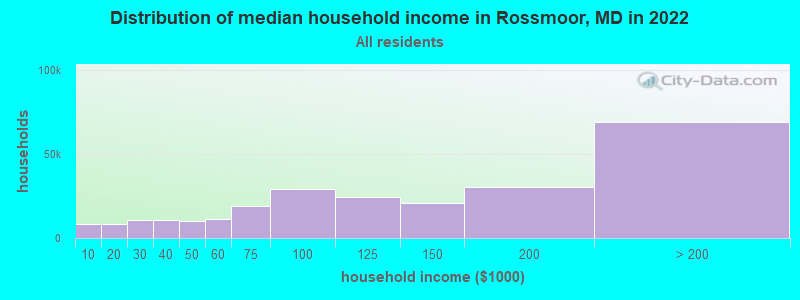
Rossmoor, MD household income distribution

- 8,301Less than $10,000
- 8,604$10,000 to $19,999
- 10,588$20,000 to $29,999
- 10,557$30,000 to $39,999
- 10,276$40,000 to $49,999
- 11,395$50,000 to $59,999
- 18,760$60,000 to $74,999
- 29,007$75,000 to $99,999
- 24,228$100,000 to $124,999
- 20,686$125,000 to $149,999
- 29,987$150,000 to $199,999
- 68,874$200,000 or more
Percentage of workers working in this county: 84.2%
Number of people working at home: 525 (28.2% of all workers)
Travel time to work (commute)
- Less than 5 minutes: 20
- 5 to 9 minutes: 88
- 10 to 14 minutes: 87
- 15 to 19 minutes: 61
- 20 to 24 minutes: 152
- 25 to 29 minutes: 145
- 30 to 34 minutes: 284
- 35 to 39 minutes: 59
- 40 to 44 minutes: 91
- 45 to 59 minutes: 302
- 60 to 89 minutes: 133
- 90 or more minutes: 28
Means of transportation to work:
- Drove a car alone: 1,107 (71.8%)
- Carpooled: 107 (6.9%)
- Bus or trolley bus: 91 (5.9%)
- Streetcar or trolley car: 9 (0.6%)
- Subway or elevated: 89 (5.8%)
- Motorcycle: 13 (0.8%)
- Walked: 24 (1.6%)
- Other means: 10 (0.6%)
- Worked at home: 91 (5.9%)


- Year of entry for the foreign-born population in Rossmoor, Maryland
- 951995 to March 2000
- 1601990 to 1994
- 1341985 to 1989
- 1271980 to 1984
- 381975 to 1979
- 801970 to 1974
- 961965 to 1969
- 509Before 1965

First ancestries reported:
- Other: 1,940 (24.4%)
- English: 996 (12.5%)
- German: 872 (11.0%)
- Irish: 769 (9.7%)
- United States: 610 (7.7%)
- Russian: 605 (7.6%)
- Italian: 362 (4.5%)
- Subsaharan African: 323 (4.1%)
- Polish: 249 (3.1%)
- Scotch-Irish: 188 (2.4%)
- French: 169 (2.1%)
- Scottish: 163 (2.0%)
- Dutch: 125 (1.6%)
- Hungarian: 107 (1.3%)
- Swedish: 71 (0.9%)
- Welsh: 69 (0.9%)
- Ukrainian: 59 (0.7%)
- Greek: 54 (0.7%)
- Lithuanian: 46 (0.6%)
- French Canadian: 42 (0.5%)
- Norwegian: 33 (0.4%)
- Portuguese: 32 (0.4%)
- Swiss: 28 (0.4%)
- Danish: 25 (0.3%)
- Arab: 15 (0.2%)
- Czech: 5 (0.06%)
Most common places of birth for foreign-born residents (%):
| Rossmoor: | 10.1% (125) |
| Maryland: | 1.7% (8,678) |
| Rossmoor: | 6.9% (86) |
| Maryland: | 4.4% (22,741) |
| Rossmoor: | 6.1% (76) |
| Maryland: | 8.1% (41,818) |
| Rossmoor: | 5.2% (65) |
| Maryland: | 3.7% (19,287) |
| Rossmoor: | 4.7% (58) |
| Maryland: | 0.8% (4,199) |
| Rossmoor: | 4.4% (55) |
| Maryland: | 6.0% (31,249) |
| Rossmoor: | 4.2% (52) |
| Maryland: | 2.7% (14,206) |
| Rossmoor: | 4.1% (51) |
| Maryland: | 1.7% (8,723) |
| Rossmoor: | 4.0% (50) |
| Maryland: | 1.6% (8,407) |
| Rossmoor: | 3.6% (44) |
| Maryland: | 0.3% (1,547) |
| Rossmoor: | 3.4% (42) |
| Maryland: | 2.8% (14,555) |
| Rossmoor: | 3.1% (39) |
| Maryland: | 1.4% (7,047) |
| Rossmoor: | 3.0% (37) |
| Maryland: | 0.6% (2,921) |
| Rossmoor: | 3.0% (37) |
| Maryland: | 1.3% (6,550) |
| Rossmoor: | 2.6% (32) |
| Maryland: | 0.8% (4,250) |
| Rossmoor: | 2.1% (26) |
| Maryland: | 0.2% (1,249) |
| Rossmoor: | 2.1% (26) |
| Maryland: | 0.3% (1,343) |
| Rossmoor: | 2.1% (26) |
| Maryland: | 1.7% (9,019) |
| Rossmoor: | 2.0% (25) |
| Maryland: | 0.4% (2,147) |
| Rossmoor: | 2.0% (25) |
| Maryland: | 6.2% (32,276) |
| Rossmoor: | 2.0% (25) |
| Maryland: | 0.3% (1,469) |
| Rossmoor: | 2.0% (25) |
| Maryland: | 1.0% (5,093) |
Place of birth for U.S.-born residents:
- This state: 728
- Other state: 5,595
- Northeast: 2,359
- Midwest: 825
- South: 2,226
- West: 185
61% of Rossmoor residents lived in the same house 5 years ago.
Out of people who lived in different houses, 69% lived in this county.
Out of people who lived in different counties, 30% lived in Maryland.
Education attainment for males 25 years and older:
- No schooling: 4
- Nursery to 4th grade: 0
- 5th and 6th grade: 8
- 7th and 8th grade: 63
- 9th grade: 15
- 10th grade: 41
- 11th grade: 46
- 12th grade, no diploma: 87
- High school graduate (or equivalency): 516
- Less than 1 year of college: 105
- Some college more than 1 year, no degree: 331
- Associate degree: 32
- Bachelor's degree: 563
- Master's degree: 323
- Professional school degree: 196
- Doctorate degree: 60

Education attainment for females 25 years and older:
- No schooling: 9
- Nursery to 4th grade: 0
- 5th and 6th grade: 17
- 7th and 8th grade: 34
- 9th grade: 42
- 10th grade: 81
- 11th grade: 53
- 12th grade, no diploma: 188
- High school graduate (or equivalency): 1,517
- Less than 1 year of college: 417
- Some college more than 1 year, no degree: 831
- Associate degree: 131
- Bachelor's degree: 792
- Master's degree: 379
- Professional school degree: 135
- Doctorate degree: 54


Housing units in structures:
- One, detached: 65
- One, attached: 1,713
- 3 or 4: 240
- 5 to 9: 218
- 10 to 19: 309
- 20 to 49: 800
- 50 or more: 1,994

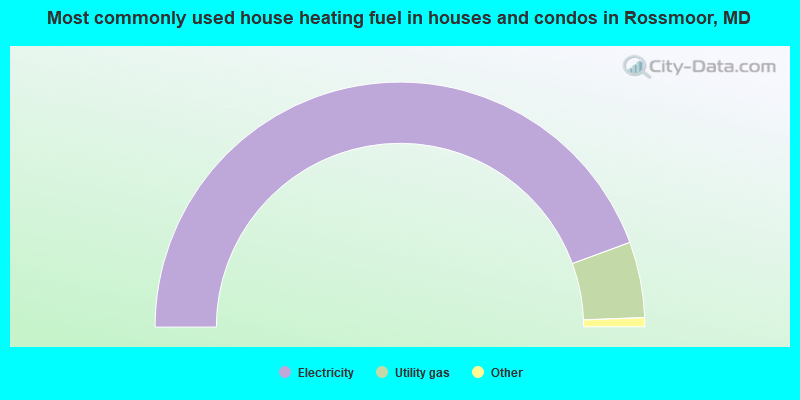
- 88.8%Electricity
- 10.0%Utility gas
- 0.4%Other fuel
- 0.4%Fuel oil, kerosene, etc.
- 0.2%Bottled, tank, or LP gas
- 0.2%No fuel used
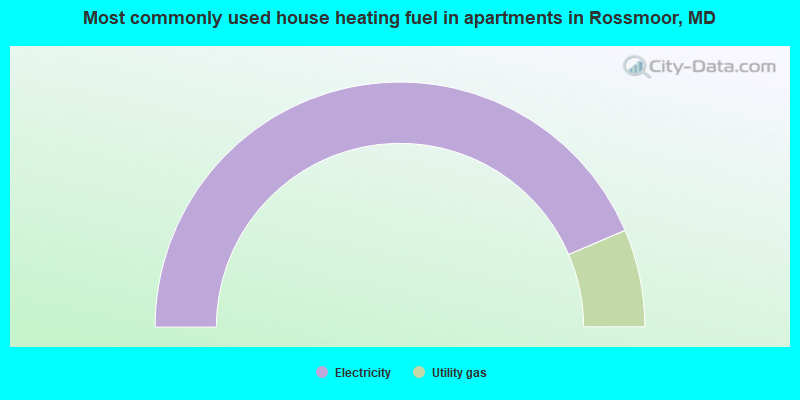
- 87.1%Electricity
- 12.9%Utility gas
Private vs. public school enrollment:
| Here: | 11.0% |
| Maryland: | 14.8% |
| Here: | 5.2% |
| Maryland: | 13.3% |
| Here: | 10.9% |
| Maryland: | 21.7% |


