Rock Island, IL (Illinois) Houses and Residents
Estimated median house or condo value in 2022: $114,442 (it was $69,800 in 2000 )
Rock Island:
$114,442Illinois:
$251,600
Lower value quartile - upper value quartile: $82,097 - $158,824Mean price in 2022: Detached houses: $135,870 Here:
$135,870State:
$310,164
Townhouses or other attached units: $179,894 Here:
$179,894State:
$286,230
In 2-unit structures: $50,660 Here:
$50,660State:
$299,638
In 3-to-4-unit structures: $345,480 Here:
$345,480State:
$330,907
In 5-or-more-unit structures: $121,326 Here:
$121,326State:
$318,887
Mobile homes: $59,295 Here:
$59,295State:
$78,855
Total population: 38,642 (All urban)
Houses: 16,990 (15,252 occupied: 9,721 owner occupied, 5,864 renter occupied )
% of renters here:
38%State:
33%
Housing density: 1,067 houses/condos per square mile
Median price asked for vacant for-sale houses and condos in 2022: $47,709.
Median contract rent in 2022: $633 (lower quartile is $466, upper quartile is $795)
Median rent asked for vacant for-rent units in 2022: $780
Median gross rent in Rock Island, IL in 2022: $751
Housing units in Rock Island with a mortgage: 6,367 (315 second mortgage, 3 home equity loan, 196 both second mortgage and home equity loan )Houses without a mortgage: 190
Median household income for houses/condos with a mortgage: $73,987
Median household income for apartments without a mortgage: $57,406
Median monthly housing costs: $858
Data:
Median house or condo value ($)
Median house or condo value ($ change since 2000)
Median house or condo value ($) - White
Median house or condo value ($) - Black or African American
Median house or condo value ($) - Asian
Median house or condo value ($) - Hispanic or Latino
Median house or condo value ($) - American Indian and Alaska Native
Median house or condo value ($) - Multirace
Median house or condo value ($) - Other Race
Median price asked for mobile homes ($)
Household density (households per square mile)
Mean house or condo value by units in structure - 1, detached ($)
Mean house or condo value by units in structure - 1, attached ($)
Mean house or condo value by units in structure - 2 ($)
Mean house or condo value by units in structure by units in structure - 3 or 4 ($)
Mean house or condo value by units in structure - 5 or more ($)
Mean house or condo value by units in structure - Boat, RV, van, etc. ($)
Mean house or condo value by units in structure - Mobile home ($)
Median contract rent ($)
Median contract rent - Lower quartile ($)
Median contract rent - Upper quartile ($)
Median gross rent ($)
Urban houses (%)
Rural houses (%)
Houses occupied (%)
Houses occupied (% change since 2000)
Houses owner occupied (%)
Houses owner occupied (% change since 2000)
Houses renter occupied (%)
Houses renter occupied (% change since 2000)
Vacant housing units - For rent (%)
Vacant housing units - For rent (% change since 2000)
Vacant housing units - For sale only (%)
Vacant housing units - For sale only (% change since 2000)
Vacant housing units - Rented or sold, not occupied (%)
Vacant housing units - Rented or sold, not occupied (% change since 2000)
Vacant housing units - For seasonal, recreational, or occasional use (%)
Vacant housing units - For seasonal, recreational, or occasional use (% change since 2000)
Vacant housing units - For migrant workers (%)
Vacant housing units - For migrant workers (% change since 2000)
Vacant housing units - Other vacant (%)
Vacant housing units - Other vacant (% change since 2000)
Median monthly housing costs ($)
Median household income for houses/condos with a mortgage ($)
Median household income for houses/condos without a mortgage ($)
Median household income ($)
Median household income ($) - White
Median household income ($) - Black or African American
Median household income ($) - Asian
Median household income ($) - Hispanic or Latino
Median household income ($) - American Indian and Alaska Native
Median household income ($) - Multirace
Median household income ($) - Other Race
Mortgage status - with mortgage (%)
Mortgage status - with second mortgage (%)
Mortgage status - with home equity loan (%)
Mortgage status - with both second mortgage and home equity loan (%)
Mortgage status - without a mortgage (%)
Median year house/condo built
Median year apartment built
Household type by relationship - Male householder living alone (%)
Household type by relationship - Male householder not living alone (%)
Household type by relationship - Female householder living alone (%)
Household type by relationship - Female householder not living alone (%)
Household type by relationship - Opposite-Sex spouse (%)
Household type by relationship - Same-Sex spouse (%)
Household type by relationship - Opposite-Sex unmarried partner (%)
Household type by relationship - Same-Sex unmarried partner (%)
Household type by relationship - In group quarters (%)
Size of family households - 2-person household (%)
Size of family households - 3-person household (%)
Size of family households - 4-person household (%)
Size of family households - 5-person household (%)
Size of family households - 6-person household (%)
Size of family households - 7-or-more-person household (%)
Size of nonfamily households - 1-person household (%)
Size of nonfamily households - 2-person household (%)
Size of nonfamily households - 3-person household (%)
Size of nonfamily households - 4-person household (%)
Size of nonfamily households - 5-person household (%)
Size of nonfamily households - 6-person household (%)
Size of nonfamily households - 7-or-moreperson household (%)
Year house built - Built 2010 or later (%)
Year house built - Built 2000 to 2009 (%)
Year house built - Built 1990 to 1999 (%)
Year house built - Built 1980 to 1989 (%)
Year house built - Built 1970 to 1979 (%)
Year house built - Built 1960 to 1969 (%)
Year house built - Built 1950 to 1959 (%)
Year house built - Built 1940 to 1949 (%)
Year house built - Built 1939 or earlier (%)
Median number of rooms in houses and condos
Median number of rooms in apartments
Median number of bedrooms in owner occupied houses
Mean number of bedrooms in owner occupied houses
Median number of bedrooms in renter occupied houses
Mean number of bedrooms in renter occupied houses
Median number of vehichles in owner occupied houses
Mean number of vehichles in owner occupied houses
Median number of vehichles in renter occupied houses
Mean number of vehichles in renter occupied houses
Rooms in owner-occupied houses - 1 room (%)
Rooms in owner-occupied houses - 2 rooms (%)
Rooms in owner-occupied houses - 3 rooms (%)
Rooms in owner-occupied houses - 4 rooms (%)
Rooms in owner-occupied houses - 5 rooms (%)
Rooms in owner-occupied houses - 6 rooms (%)
Rooms in owner-occupied houses - 7 rooms (%)
Rooms in owner-occupied houses - 8 rooms (%)
Rooms in owner-occupied houses - 9+ rooms (%)
Rooms in renter-occupied houses - 1 room (%)
Rooms in renter-occupied houses - 2 rooms (%)
Rooms in renter-occupied houses - 3 rooms (%)
Rooms in renter-occupied houses - 4 rooms (%)
Rooms in renter-occupied houses - 5 rooms (%)
Rooms in renter-occupied houses - 6 rooms (%)
Rooms in renter-occupied houses - 7 rooms (%)
Rooms in renter-occupied houses - 8 rooms (%)
Rooms in renter-occupied houses - 9+ rooms (%)
Bedrooms in owner-occupied houses - no bedrooms (%)
Bedrooms in owner-occupied houses - 1 bedroom (%)
Bedrooms in owner-occupied houses - 2 bedrooms (%)
Bedrooms in owner-occupied houses - 3 bedrooms (%)
Bedrooms in owner-occupied houses - 4 bedrooms (%)
Bedrooms in owner-occupied houses - 5+ bedrooms (%)
Bedrooms in renter-occupied houses - no bedrooms (%)
Bedrooms in renter-occupied houses - 1 bedroom (%)
Bedrooms in renter-occupied houses - 2 bedrooms (%)
Bedrooms in renter-occupied houses - 3 bedrooms (%)
Bedrooms in renter-occupied houses - 4 bedrooms (%)
Bedrooms in renter-occupied houses - 5+ bedrooms (%)
Vehicles available in owner-occupied houses - no vehicle available (%)
Vehicles available in owner-occupied houses - 1 vehicle available(%)
Vehicles available in owner-occupied houses - 2 Vehicles available (%)
Vehicles available in owner-occupied houses - 3 Vehicles available (%)
Vehicles available in owner-occupied houses - 4 Vehicles available (%)
Vehicles available in owner-occupied houses - 5+ Vehicles available (%)
Vehicles available in renter-occupied houses - no vehicle available (%)
Vehicles available in renter-occupied houses - 1 vehicle available (%)
Vehicles available in renter-occupied houses - 2 Vehicles available (%)
Vehicles available in renter-occupied houses - 3 Vehicles available (%)
Vehicles available in renter-occupied houses - 4 Vehicles available (%)
Vehicles available in renter-occupied houses - 5+ Vehicles available (%)
Housing units in structures - 1, detached (%)
Housing units in structures - 1, attached (%)
Housing units in structures - 2 (%)
Housing units in structures - 3 or 4 (%)
Housing units in structures - 5 to 9 (%)
Housing units in structures - 10 to 19 (%)
Housing units in structures - 20 to 49 (%)
Housing units in structures - 50 or more (%)
Housing units in structures - Mobile home (%)
Housing units in structures - Boat, RV, van, etc. (%)
Housing units in structures - Owners - 1, detached (%)
Housing units in structures - Owners - 1, attached (%)
Housing units in structures - Owners - 2 (%)
Housing units in structures - Owners - 3 or 4 (%)
Housing units in structures - Owners - 5 to 9 (%)
Housing units in structures - Owners - 10 to 19 (%)
Housing units in structures - Owners - 20 to 49 (%)
Housing units in structures - Owners - 50 or more (%)
Housing units in structures - Owners - Mobile home (%)
Housing units in structures - Owners - Boat, RV, van, etc. (%)
Housing units in structures - Renters - 1, detached (%)
Housing units in structures - Renters - 1, attached (%)
Housing units in structures - Renters - 2 (%)
Housing units in structures - Renters - 3 or 4 (%)
Housing units in structures - Renters - 5 to 9 (%)
Housing units in structures - Renters - 10 to 19 (%)
Housing units in structures - Renters - 20 to 49 (%)
Housing units in structures - Renters - 50 or more (%)
Housing units in structures - Renters - Mobile home (%)
Housing units in structures - Renters - Boat, RV, van, etc. (%)
House/condo owner moved in on average (years ago)
Renter moved in on average (years ago)
Year householder moved into unit - Moved in 1999 to March 2000 (%)
Year householder moved into unit - Moved in 1999 to March 2000 (%) - White
Year householder moved into unit - Moved in 1999 to March 2000 (%) - Black or African American
Year householder moved into unit - Moved in 1999 to March 2000 (%) - Asian
Year householder moved into unit - Moved in 1999 to March 2000 (%) - Hispanic or Latino
Year householder moved into unit - Moved in 1999 to March 2000 (%) - American Indian and Alaska Native
Year householder moved into unit - Moved in 1999 to March 2000 (%) - Multirace
Year householder moved into unit - Moved in 1999 to March 2000 (%) - Other Race
Year householder moved into unit - Moved in 1995 to 1998 (%)
Year householder moved into unit - Moved in 1995 to 1998 (%) - White
Year householder moved into unit - Moved in 1995 to 1998 (%) - Black or African American
Year householder moved into unit - Moved in 1995 to 1998 (%) - Asian
Year householder moved into unit - Moved in 1995 to 1998 (%) - Hispanic or Latino
Year householder moved into unit - Moved in 1995 to 1998 (%) - American Indian and Alaska Native
Year householder moved into unit - Moved in 1995 to 1998 (%) - Multirace
Year householder moved into unit - Moved in 1995 to 1998 (%) - Other Race
Year householder moved into unit - Moved in 1990 to 1994 (%)
Year householder moved into unit - Moved in 1990 to 1994 (%) - White
Year householder moved into unit - Moved in 1990 to 1994 (%) - Black or African American
Year householder moved into unit - Moved in 1990 to 1994 (%) - Asian
Year householder moved into unit - Moved in 1990 to 1994 (%) - Hispanic or Latino
Year householder moved into unit - Moved in 1990 to 1994 (%) - American Indian and Alaska Native
Year householder moved into unit - Moved in 1990 to 1994 (%) - Multirace
Year householder moved into unit - Moved in 1990 to 1994 (%) - Other Race
Year householder moved into unit - Moved in 1980 to 1989 (%)
Year householder moved into unit - Moved in 1980 to 1989 (%) - White
Year householder moved into unit - Moved in 1980 to 1989 (%) - Black or African American
Year householder moved into unit - Moved in 1980 to 1989 (%) - Asian
Year householder moved into unit - Moved in 1980 to 1989 (%) - Hispanic or Latino
Year householder moved into unit - Moved in 1980 to 1989 (%) - American Indian and Alaska Native
Year householder moved into unit - Moved in 1980 to 1989 (%) - Multirace
Year householder moved into unit - Moved in 1980 to 1989 (%) - Other Race
Year householder moved into unit - Moved in 1970 to 1979 (%)
Year householder moved into unit - Moved in 1970 to 1979 (%) - White
Year householder moved into unit - Moved in 1970 to 1979 (%) - Black or African American
Year householder moved into unit - Moved in 1970 to 1979 (%) - Asian
Year householder moved into unit - Moved in 1970 to 1979 (%) - Hispanic or Latino
Year householder moved into unit - Moved in 1970 to 1979 (%) - American Indian and Alaska Native
Year householder moved into unit - Moved in 1970 to 1979 (%) - Multirace
Year householder moved into unit - Moved in 1970 to 1979 (%) - Other Race
Year householder moved into unit - Moved in 1969 or earlier (%)
Year householder moved into unit - Moved in 1969 or earlier (%) - White
Year householder moved into unit - Moved in 1969 or earlier (%) - Black or African American
Year householder moved into unit - Moved in 1969 or earlier (%) - Asian
Year householder moved into unit - Moved in 1969 or earlier (%) - Hispanic or Latino
Year householder moved into unit - Moved in 1969 or earlier (%) - American Indian and Alaska Native
Year householder moved into unit - Moved in 1969 or earlier (%) - Multirace
Year householder moved into unit - Moved in 1969 or earlier (%) - Other Race
Housing units lacking complete plumbing facilities (%)
Housing units lacking complete kitchen facilities (%)
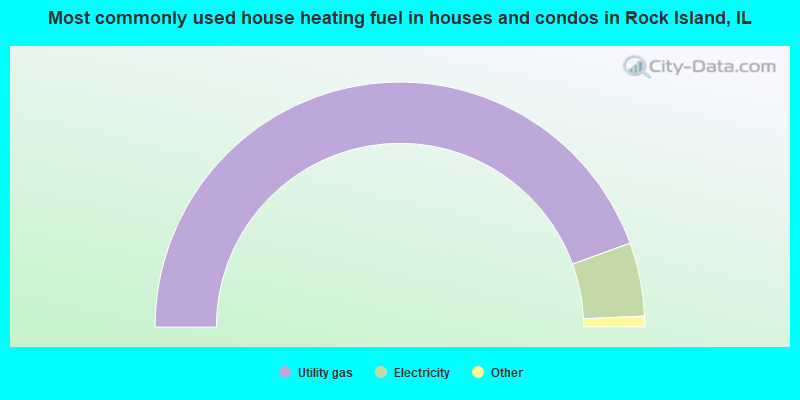
House heating fuel used in houses and condos - Utility gas (%)
House heating fuel used in houses and condos - Bottled, tank, or LP gas (%)
House heating fuel used in houses and condos - Electricity (%)
House heating fuel used in houses and condos - Fuel oil, kerosene, etc. (%)
House heating fuel used in houses and condos - Coal or coke (%)
House heating fuel used in houses and condos - Wood (%)
House heating fuel used in houses and condos - Solar energy (%)
House heating fuel used in houses and condos - Other fuel (%)
House heating fuel used in houses and condos - No fuel used (%)
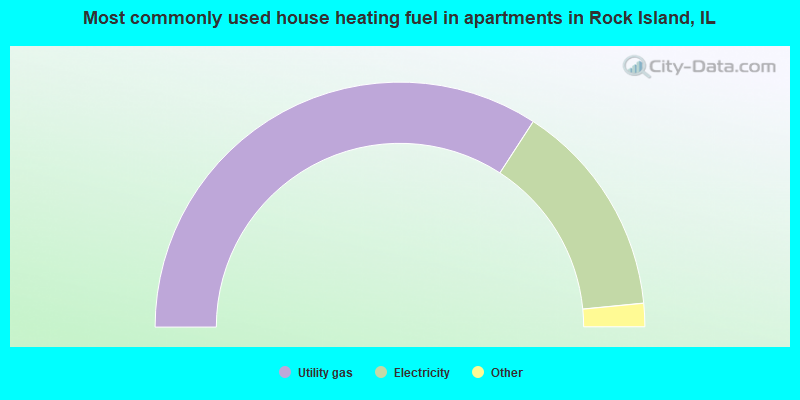
House heating fuel used in apartments - Utility gas (%)
House heating fuel used in apartments - Bottled, tank, or LP gas (%)
House heating fuel used in apartments - Electricity (%)
House heating fuel used in apartments - Fuel oil, kerosene, etc. (%)
House heating fuel used in apartments - Coal or coke (%)
House heating fuel used in apartments - Wood (%)
House heating fuel used in apartments - Solar energy (%)
House heating fuel used in apartments - Other fuel (%)
House heating fuel used in apartments - No fuel used (%)
Median year house/condo built: 1951Median year apartment built: 1956Household type by relationship:
Households: 36,670
Male householders: 7,171 (2,788 living alone ), Female householders: 7,832 (2,841 living alone )5,228 spouses (5,179 opposite-sex spouses ), 1,369 unmarried partners , (1,271 opposite-sex unmarried partners ), 9,786 children (9,004 natural , 182 adopted , 600 stepchildren ), 581 grandchildren , 248 brothers or sisters , 228 parents , 6 foster children , 188 other relatives , 1,224 non-relatives In group quarters: 2,802
Size of family households: 4,396 2-persons , 1,687 3-persons , 1,279 4-persons , 509 5-persons , 294 6-persons , 89 7-or-more-persons .
Size of nonfamily households: 5,606 1-person , 1,324 2-persons , 162 3-persons , 89 4-persons , 36 5-persons .
3,461 married couples with children. single-parent households (1,272 men , 3,494 women ).
85.1% of residents of Rock Island speak English at home. of residents speak Spanish at home (74% speak English very well , 17% speak English well , 8% speak English not well , 1% don't speak English at all ).of residents speak other Indo-European language at home (81% speak English very well , 11% speak English well , 8% speak English not well ).of residents speak Asian or Pacific Island language at home (46% speak English very well , 27% speak English well , 25% speak English not well , 1% don't speak English at all ).of residents speak other language at home (55% speak English very well , 30% speak English well , 10% speak English not well , 4% don't speak English at all ).
Foreign born population: 2,665 (7.3%)of them are naturalized citizens )
Median number of rooms in houses and condos:
Median number of rooms in apartments
Owner-occupied Renter-occupied
Rooms in owner-occupied houses in Rock Island, Illinois
0 1 room 22 2 rooms 189 3 rooms 920 4 rooms 2,231 5 rooms 2,302 6 rooms 1,650 7 rooms 1,203 8 rooms 1,204 9+ rooms
Rooms in renter-occupied apartments in Rock Island, Illinois
327 1 room 382 2 rooms 1,248 3 rooms 1,617 4 rooms 1,058 5 rooms 562 6 rooms 303 7 rooms 174 8 rooms 193 9+ rooms
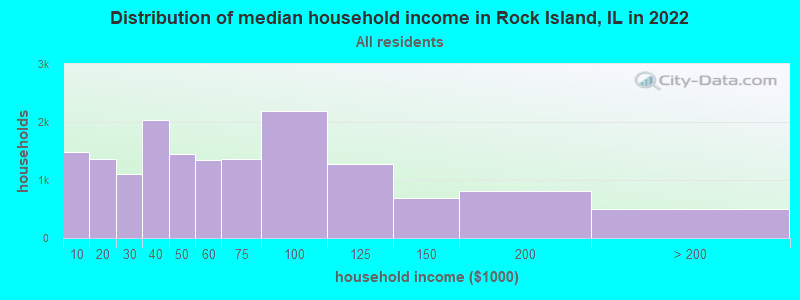
Rock Island, IL household income distribution 1,486 Less than $10,0001,356 $10,000 to $19,9991,109 $20,000 to $29,9992,036 $30,000 to $39,9991,455 $40,000 to $49,9991,343 $50,000 to $59,9991,359 $60,000 to $74,9992,184 $75,000 to $99,9991,269 $100,000 to $124,999687 $125,000 to $149,999818 $150,000 to $199,999496 $200,000 or more
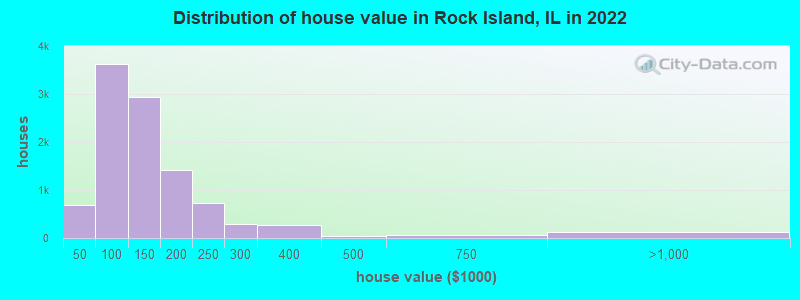
Home value of owner - occupied houses in 2022 in Rock Island, IL 72 Less than $10,000174 $10,000 to $14,99982 $15,000 to $19,99930 $20,000 to $24,99934 $25,000 to $29,99914 $30,000 to $34,99964 $35,000 to $39,999222 $40,000 to $49,999373 $50,000 to $59,999563 $60,000 to $69,999655 $70,000 to $79,999953 $80,000 to $89,999846 $90,000 to $99,9991,662 $100,000 to $124,9991,283 $125,000 to $149,999993 $150,000 to $174,999415 $175,000 to $199,999729 $200,000 to $249,999289 $250,000 to $299,999275 $300,000 to $399,99935 $400,000 to $499,99959 $500,000 to $749,999109 $750,000 to $999,99913 $1,000,000 to $1,499,9995 $1,500,000 to $1,999,999Rent paid by renters in 2022 in Rock Island, IL 122 Less than $10040 $100 to $14947 $150 to $19978 $200 to $249193 $250 to $299197 $300 to $349146 $350 to $399159 $400 to $449187 $450 to $499368 $500 to $549359 $550 to $599536 $600 to $649749 $650 to $699663 $700 to $749170 $750 to $799207 $800 to $899175 $900 to $999340 $1,000 to $1,249184 $1,250 to $1,499204 $1,500 to $1,99954 $2,000 to $2,49913 $2,500 to $2,999436 No cash rent
Percentage of workers working in this county: 74.9%Number of people working at home: 2,133 (12.6% of all workers )
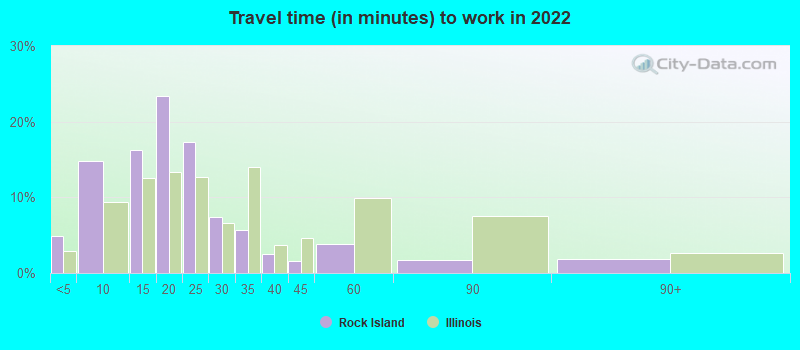
Travel time to work (commute)
Less than 5 minutes: 7095 to 9 minutes: 2,49810 to 14 minutes: 3,09215 to 19 minutes: 3,80020 to 24 minutes: 2,35825 to 29 minutes: 97730 to 34 minutes: 75435 to 39 minutes: 12440 to 44 minutes: 14445 to 59 minutes: 18060 to 89 minutes: 18390 or more minutes: 371
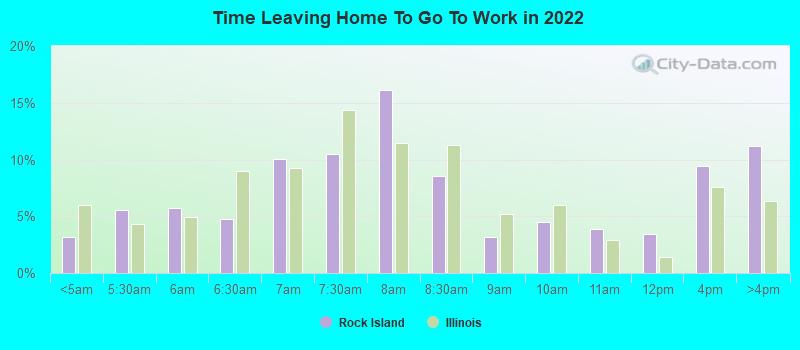
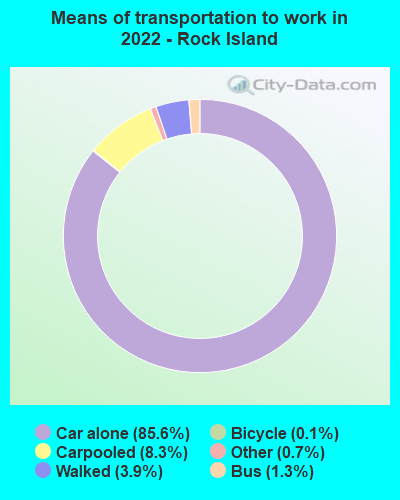
Means of transportation to work:
Drove a car alone: 15,325 (78.2%)Carpooled: 1,290 (6.6%)Bus : 193 (1.0%)Taxi: 269 (1.4%)Bicycle: 19 (0.1%)Walked: 531 (2.7%)Worked at home: 2,133 (10.9%)
Unemployment by race in 2022
Unemployment rate for White non-Hispanic residents 3.5% Males3.8% FemalesUnemployment rate for Black residents 10.0% Males19.0% FemalesUnemployment rate for American Indian and Alaska Native residents 5.1% MalesUnemployment rate for Asian residents 5.4% Males2.2% FemalesUnemployment rate for other race residents 2.2% Males4.9% FemalesUnemployment rate for two or more race residents 14.0% Males8.0% FemalesUnemployment rate for Hispanic or Latino residents 11.8% Males4.8% Females
Year of entry for the foreign-born population in Rock Island, Illinois
1,343 2010 or later 1,245 2000 to 2009 415 1990 to 1999 239 1980 to 1989 274 1970 to 1979 338 Before 1970
First ancestries reported:
German: 1,747 (11.0%)
Irish: 1,189 (7.5%)
English: 790 (5.0%)
African: 784 (4.9%)
American: 714 (4.5%)
Belgian: 394 (2.5%)
European: 299 (1.9%)
Italian: 281 (1.8%)
Swedish: 233 (1.5%)
Norwegian: 192 (1.2%)
Polish: 157 (1.0%)
Scottish: 110 (0.7%)
French: 100 (0.6%)
Dutch: 97 (0.6%)
Scotch-Irish: 91 (0.6%)
Ethiopian: 83 (0.5%)
Czech: 61 (0.4%)
Russian: 46 (0.3%)
Scandinavian: 43 (0.3%)
Welsh: 34 (0.2%)
Greek: 33 (0.2%)
Croatian: 30 (0.2%)
Lithuanian: 23 (0.1%)
Eastern European: 21 (0.1%)
Ghanaian: 21 (0.1%)
Ukrainian: 19 (0.1%)
Hungarian: 19 (0.1%)
British: 13 (0.08%)
Liberian: 12 (0.08%)
Northern European: 12 (0.08%)
Moroccan: 11 (0.07%)
Serbian: 11 (0.07%)
Haitian: 11 (0.07%)
Nigerian: 9 (0.06%)
Danish: 7 (0.04%)
Slovak: 7 (0.04%)
Lebanese: 7 (0.04%)
Slavic: 6 (0.04%)
Swiss: 5 (0.03%)
Iraqi: 4 (0.03%)
Brazilian: 3 (0.02%) Most common places of birth for foreign-born residents (%): Mexico Rock Island:
29.9% (1,040)Illinois:
34.7% (626,958)
Burma (Myanmar) Rock Island:
8.0% (277)Illinois:
0.3% (4,552)
Africa, n.e.c. Rock Island:
7.5% (259)Illinois:
0.3% (5,397)
Tanzania Rock Island:
6.4% (223)Illinois:
0.1% (1,833)
China, excluding Hong Kong and Taiwan Rock Island:
4.4% (152)Illinois:
4.1% (74,364)
Philippines Rock Island:
2.9% (101)Illinois:
5.2% (93,003)
Thailand Rock Island:
2.5% (87)Illinois:
0.4% (7,323)
Pakistan Rock Island:
2.4% (83)Illinois:
1.6% (29,519)
Other Eastern Africa Rock Island:
2.3% (80)Illinois:
0.1% (2,269)
India Rock Island:
2.2% (77)Illinois:
9.2% (166,409)
Vietnam Rock Island:
1.7% (58)Illinois:
1.2% (22,269)
Ethiopia Rock Island:
1.7% (58)Illinois:
0.3% (4,775)
Place of birth for U.S.-born residents:
This state: 23,589Other state: 10,206Northeast: 615Midwest: 6,208South: 2,811West: 738 82.9% of Rock Island residents lived in the same house 1 years ago.
Out of people who lived in different houses, 31.6% lived in this county.
Out of people who lived in different counties, 56.9% lived in Illinois.
Rock Island:
82.9%State average:
88.3%
Education attainment for males 25 years and older:
No schooling: 202Nursery to 4th grade: 165th and 6th grade: 1417th and 8th grade: 1029th grade: 8310th grade: 8911th grade: 26312th grade, no diploma: 219High school graduate (or equivalency): 4,309Less than 1 year of college: 1,002Some college more than 1 year, no degree: 1,726Associate degree: 728Bachelor's degree: 1,633Master's degree: 636Professional school degree: 208Doctorate degree: 205
Education attainment for females 25 years and older:
No schooling: 386Nursery to 4th grade: 435th and 6th grade: 437th and 8th grade: 1199th grade: 7110th grade: 13711th grade: 18112th grade, no diploma: 244High school graduate (or equivalency): 3,391Less than 1 year of college: 1,470Some college more than 1 year, no degree: 1,801Associate degree: 1,097Bachelor's degree: 1,597Master's degree: 983Professional school degree: 164Doctorate degree: 198
Housing units in structures:
One, detached: 11,276One, attached: 768Two: 8393 or 4: 6785 to 9: 91610 to 19: 84720 to 49: 43250 or more: 1,048Mobile homes: 184Median worth of mobile homes: $43,800
Housing units lacking complete plumbing facilities in 2022: 3.5%Housing units lacking complete kitchen facilities in 2022: 4.9%House/condo owner moved in on average 12 years ago
Renter moved in on average 3 years ago
Private vs. public school enrollment:
Students in private schools in grades 1 to 8 (elementary and middle school): 363 Students in private schools in grades 9 to 12 (high school): 153 Students in private undergraduate colleges: 2,542