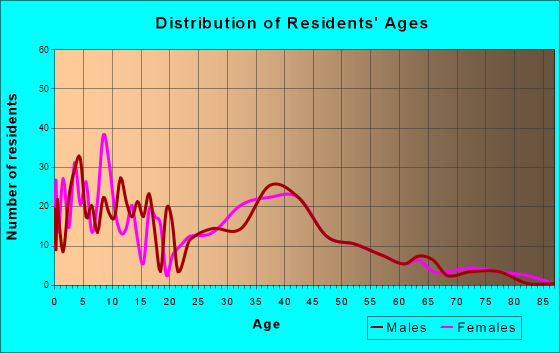
Prosper, TX (Texas) Houses and Residents
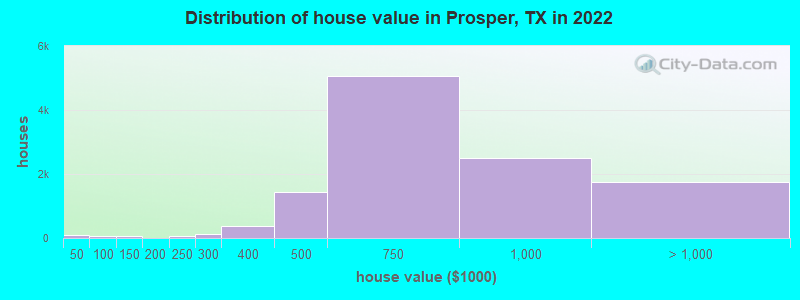
Estimated median house or condo value in 2022: $719,419 (it was $129,800 in 2000 )
Prosper:
$719,419Texas:
$275,400
Lower value quartile - upper value quartile: $537,031 - $953,184Total population: 14,416 (Urban population: 0, Rural population: 2,123 (4 farm, 2,119 nonfarm ))
Houses: 10,685 (9,720 occupied: 8,717 owner occupied, 1,084 renter occupied )
% of renters here:
11%State:
38%
Housing density: 2,159 houses/condos per square mile
Median price asked for vacant for-sale houses and condos in 2022: $556,024.
Median contract rent in 2022: $1,893 (lower quartile is $1,432, upper quartile is over $2,000)
Median rent asked for vacant for-rent units in 2022: $1,926
Median gross rent in Prosper, TX in 2022: $1,945
Housing units in Prosper with a mortgage: 6,765 (444 second mortgage, 4 home equity loan, 249 both second mortgage and home equity loan )Houses without a mortgage: 38
Median household income for houses/condos with a mortgage: $207,891
Median household income for apartments without a mortgage: $158,622
Median monthly housing costs: $3,142
Data:
Median house or condo value ($)
Median house or condo value ($ change since 2000)
Median house or condo value ($) - White
Median house or condo value ($) - Black or African American
Median house or condo value ($) - Asian
Median house or condo value ($) - Hispanic or Latino
Median house or condo value ($) - American Indian and Alaska Native
Median house or condo value ($) - Multirace
Median house or condo value ($) - Other Race
Median price asked for mobile homes ($)
Household density (households per square mile)
Mean house or condo value by units in structure - 1, detached ($)
Mean house or condo value by units in structure - 1, attached ($)
Mean house or condo value by units in structure - 2 ($)
Mean house or condo value by units in structure by units in structure - 3 or 4 ($)
Mean house or condo value by units in structure - 5 or more ($)
Mean house or condo value by units in structure - Boat, RV, van, etc. ($)
Mean house or condo value by units in structure - Mobile home ($)
Median contract rent ($)
Median contract rent - Lower quartile ($)
Median contract rent - Upper quartile ($)
Median gross rent ($)
Urban houses (%)
Rural houses (%)
Houses occupied (%)
Houses occupied (% change since 2000)
Houses owner occupied (%)
Houses owner occupied (% change since 2000)
Houses renter occupied (%)
Houses renter occupied (% change since 2000)
Vacant housing units - For rent (%)
Vacant housing units - For rent (% change since 2000)
Vacant housing units - For sale only (%)
Vacant housing units - For sale only (% change since 2000)
Vacant housing units - Rented or sold, not occupied (%)
Vacant housing units - Rented or sold, not occupied (% change since 2000)
Vacant housing units - For seasonal, recreational, or occasional use (%)
Vacant housing units - For seasonal, recreational, or occasional use (% change since 2000)
Vacant housing units - For migrant workers (%)
Vacant housing units - For migrant workers (% change since 2000)
Vacant housing units - Other vacant (%)
Vacant housing units - Other vacant (% change since 2000)
Median monthly housing costs ($)
Median household income for houses/condos with a mortgage ($)
Median household income for houses/condos without a mortgage ($)
Median household income ($)
Median household income ($) - White
Median household income ($) - Black or African American
Median household income ($) - Asian
Median household income ($) - Hispanic or Latino
Median household income ($) - American Indian and Alaska Native
Median household income ($) - Multirace
Median household income ($) - Other Race
Mortgage status - with mortgage (%)
Mortgage status - with second mortgage (%)
Mortgage status - with home equity loan (%)
Mortgage status - with both second mortgage and home equity loan (%)
Mortgage status - without a mortgage (%)
Median year house/condo built
Median year apartment built
Household type by relationship - Male householder living alone (%)
Household type by relationship - Male householder not living alone (%)
Household type by relationship - Female householder living alone (%)
Household type by relationship - Female householder not living alone (%)
Household type by relationship - Opposite-Sex spouse (%)
Household type by relationship - Same-Sex spouse (%)
Household type by relationship - Opposite-Sex unmarried partner (%)
Household type by relationship - Same-Sex unmarried partner (%)
Household type by relationship - In group quarters (%)
Size of family households - 2-person household (%)
Size of family households - 3-person household (%)
Size of family households - 4-person household (%)
Size of family households - 5-person household (%)
Size of family households - 6-person household (%)
Size of family households - 7-or-more-person household (%)
Size of nonfamily households - 1-person household (%)
Size of nonfamily households - 2-person household (%)
Size of nonfamily households - 3-person household (%)
Size of nonfamily households - 4-person household (%)
Size of nonfamily households - 5-person household (%)
Size of nonfamily households - 6-person household (%)
Size of nonfamily households - 7-or-moreperson household (%)
Year house built - Built 2010 or later (%)
Year house built - Built 2000 to 2009 (%)
Year house built - Built 1990 to 1999 (%)
Year house built - Built 1980 to 1989 (%)
Year house built - Built 1970 to 1979 (%)
Year house built - Built 1960 to 1969 (%)
Year house built - Built 1950 to 1959 (%)
Year house built - Built 1940 to 1949 (%)
Year house built - Built 1939 or earlier (%)
Median number of rooms in houses and condos
Median number of rooms in apartments
Median number of bedrooms in owner occupied houses
Mean number of bedrooms in owner occupied houses
Median number of bedrooms in renter occupied houses
Mean number of bedrooms in renter occupied houses
Median number of vehichles in owner occupied houses
Mean number of vehichles in owner occupied houses
Median number of vehichles in renter occupied houses
Mean number of vehichles in renter occupied houses
Rooms in owner-occupied houses - 1 room (%)
Rooms in owner-occupied houses - 2 rooms (%)
Rooms in owner-occupied houses - 3 rooms (%)
Rooms in owner-occupied houses - 4 rooms (%)
Rooms in owner-occupied houses - 5 rooms (%)
Rooms in owner-occupied houses - 6 rooms (%)
Rooms in owner-occupied houses - 7 rooms (%)
Rooms in owner-occupied houses - 8 rooms (%)
Rooms in owner-occupied houses - 9+ rooms (%)
Rooms in renter-occupied houses - 1 room (%)
Rooms in renter-occupied houses - 2 rooms (%)
Rooms in renter-occupied houses - 3 rooms (%)
Rooms in renter-occupied houses - 4 rooms (%)
Rooms in renter-occupied houses - 5 rooms (%)
Rooms in renter-occupied houses - 6 rooms (%)
Rooms in renter-occupied houses - 7 rooms (%)
Rooms in renter-occupied houses - 8 rooms (%)
Rooms in renter-occupied houses - 9+ rooms (%)
Bedrooms in owner-occupied houses - no bedrooms (%)
Bedrooms in owner-occupied houses - 1 bedroom (%)
Bedrooms in owner-occupied houses - 2 bedrooms (%)
Bedrooms in owner-occupied houses - 3 bedrooms (%)
Bedrooms in owner-occupied houses - 4 bedrooms (%)
Bedrooms in owner-occupied houses - 5+ bedrooms (%)
Bedrooms in renter-occupied houses - no bedrooms (%)
Bedrooms in renter-occupied houses - 1 bedroom (%)
Bedrooms in renter-occupied houses - 2 bedrooms (%)
Bedrooms in renter-occupied houses - 3 bedrooms (%)
Bedrooms in renter-occupied houses - 4 bedrooms (%)
Bedrooms in renter-occupied houses - 5+ bedrooms (%)
Vehicles available in owner-occupied houses - no vehicle available (%)
Vehicles available in owner-occupied houses - 1 vehicle available(%)
Vehicles available in owner-occupied houses - 2 Vehicles available (%)
Vehicles available in owner-occupied houses - 3 Vehicles available (%)
Vehicles available in owner-occupied houses - 4 Vehicles available (%)
Vehicles available in owner-occupied houses - 5+ Vehicles available (%)
Vehicles available in renter-occupied houses - no vehicle available (%)
Vehicles available in renter-occupied houses - 1 vehicle available (%)
Vehicles available in renter-occupied houses - 2 Vehicles available (%)
Vehicles available in renter-occupied houses - 3 Vehicles available (%)
Vehicles available in renter-occupied houses - 4 Vehicles available (%)
Vehicles available in renter-occupied houses - 5+ Vehicles available (%)
Housing units in structures - 1, detached (%)
Housing units in structures - 1, attached (%)
Housing units in structures - 2 (%)
Housing units in structures - 3 or 4 (%)
Housing units in structures - 5 to 9 (%)
Housing units in structures - 10 to 19 (%)
Housing units in structures - 20 to 49 (%)
Housing units in structures - 50 or more (%)
Housing units in structures - Mobile home (%)
Housing units in structures - Boat, RV, van, etc. (%)
Housing units in structures - Owners - 1, detached (%)
Housing units in structures - Owners - 1, attached (%)
Housing units in structures - Owners - 2 (%)
Housing units in structures - Owners - 3 or 4 (%)
Housing units in structures - Owners - 5 to 9 (%)
Housing units in structures - Owners - 10 to 19 (%)
Housing units in structures - Owners - 20 to 49 (%)
Housing units in structures - Owners - 50 or more (%)
Housing units in structures - Owners - Mobile home (%)
Housing units in structures - Owners - Boat, RV, van, etc. (%)
Housing units in structures - Renters - 1, detached (%)
Housing units in structures - Renters - 1, attached (%)
Housing units in structures - Renters - 2 (%)
Housing units in structures - Renters - 3 or 4 (%)
Housing units in structures - Renters - 5 to 9 (%)
Housing units in structures - Renters - 10 to 19 (%)
Housing units in structures - Renters - 20 to 49 (%)
Housing units in structures - Renters - 50 or more (%)
Housing units in structures - Renters - Mobile home (%)
Housing units in structures - Renters - Boat, RV, van, etc. (%)
House/condo owner moved in on average (years ago)
Renter moved in on average (years ago)
Year householder moved into unit - Moved in 1999 to March 2000 (%)
Year householder moved into unit - Moved in 1999 to March 2000 (%) - White
Year householder moved into unit - Moved in 1999 to March 2000 (%) - Black or African American
Year householder moved into unit - Moved in 1999 to March 2000 (%) - Asian
Year householder moved into unit - Moved in 1999 to March 2000 (%) - Hispanic or Latino
Year householder moved into unit - Moved in 1999 to March 2000 (%) - American Indian and Alaska Native
Year householder moved into unit - Moved in 1999 to March 2000 (%) - Multirace
Year householder moved into unit - Moved in 1999 to March 2000 (%) - Other Race
Year householder moved into unit - Moved in 1995 to 1998 (%)
Year householder moved into unit - Moved in 1995 to 1998 (%) - White
Year householder moved into unit - Moved in 1995 to 1998 (%) - Black or African American
Year householder moved into unit - Moved in 1995 to 1998 (%) - Asian
Year householder moved into unit - Moved in 1995 to 1998 (%) - Hispanic or Latino
Year householder moved into unit - Moved in 1995 to 1998 (%) - American Indian and Alaska Native
Year householder moved into unit - Moved in 1995 to 1998 (%) - Multirace
Year householder moved into unit - Moved in 1995 to 1998 (%) - Other Race
Year householder moved into unit - Moved in 1990 to 1994 (%)
Year householder moved into unit - Moved in 1990 to 1994 (%) - White
Year householder moved into unit - Moved in 1990 to 1994 (%) - Black or African American
Year householder moved into unit - Moved in 1990 to 1994 (%) - Asian
Year householder moved into unit - Moved in 1990 to 1994 (%) - Hispanic or Latino
Year householder moved into unit - Moved in 1990 to 1994 (%) - American Indian and Alaska Native
Year householder moved into unit - Moved in 1990 to 1994 (%) - Multirace
Year householder moved into unit - Moved in 1990 to 1994 (%) - Other Race
Year householder moved into unit - Moved in 1980 to 1989 (%)
Year householder moved into unit - Moved in 1980 to 1989 (%) - White
Year householder moved into unit - Moved in 1980 to 1989 (%) - Black or African American
Year householder moved into unit - Moved in 1980 to 1989 (%) - Asian
Year householder moved into unit - Moved in 1980 to 1989 (%) - Hispanic or Latino
Year householder moved into unit - Moved in 1980 to 1989 (%) - American Indian and Alaska Native
Year householder moved into unit - Moved in 1980 to 1989 (%) - Multirace
Year householder moved into unit - Moved in 1980 to 1989 (%) - Other Race
Year householder moved into unit - Moved in 1970 to 1979 (%)
Year householder moved into unit - Moved in 1970 to 1979 (%) - White
Year householder moved into unit - Moved in 1970 to 1979 (%) - Black or African American
Year householder moved into unit - Moved in 1970 to 1979 (%) - Asian
Year householder moved into unit - Moved in 1970 to 1979 (%) - Hispanic or Latino
Year householder moved into unit - Moved in 1970 to 1979 (%) - American Indian and Alaska Native
Year householder moved into unit - Moved in 1970 to 1979 (%) - Multirace
Year householder moved into unit - Moved in 1970 to 1979 (%) - Other Race
Year householder moved into unit - Moved in 1969 or earlier (%)
Year householder moved into unit - Moved in 1969 or earlier (%) - White
Year householder moved into unit - Moved in 1969 or earlier (%) - Black or African American
Year householder moved into unit - Moved in 1969 or earlier (%) - Asian
Year householder moved into unit - Moved in 1969 or earlier (%) - Hispanic or Latino
Year householder moved into unit - Moved in 1969 or earlier (%) - American Indian and Alaska Native
Year householder moved into unit - Moved in 1969 or earlier (%) - Multirace
Year householder moved into unit - Moved in 1969 or earlier (%) - Other Race
Housing units lacking complete plumbing facilities (%)
Housing units lacking complete kitchen facilities (%)
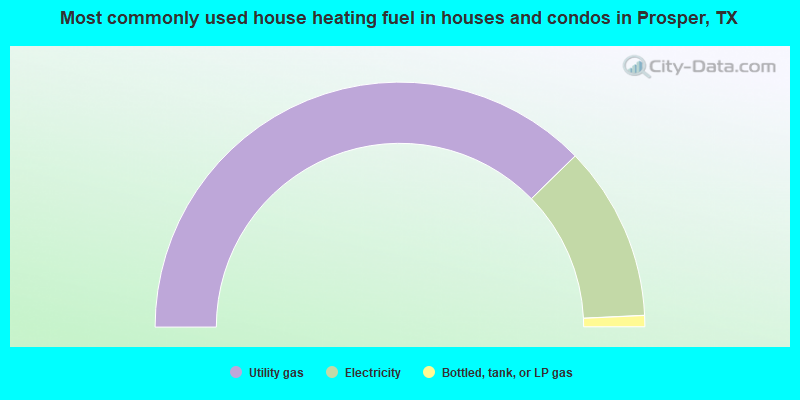
House heating fuel used in houses and condos - Utility gas (%)
House heating fuel used in houses and condos - Bottled, tank, or LP gas (%)
House heating fuel used in houses and condos - Electricity (%)
House heating fuel used in houses and condos - Fuel oil, kerosene, etc. (%)
House heating fuel used in houses and condos - Coal or coke (%)
House heating fuel used in houses and condos - Wood (%)
House heating fuel used in houses and condos - Solar energy (%)
House heating fuel used in houses and condos - Other fuel (%)
House heating fuel used in houses and condos - No fuel used (%)
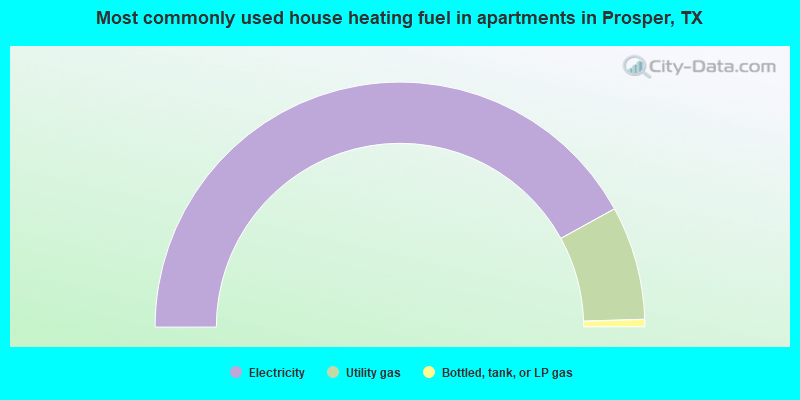
House heating fuel used in apartments - Utility gas (%)
House heating fuel used in apartments - Bottled, tank, or LP gas (%)
House heating fuel used in apartments - Electricity (%)
House heating fuel used in apartments - Fuel oil, kerosene, etc. (%)
House heating fuel used in apartments - Coal or coke (%)
House heating fuel used in apartments - Wood (%)
House heating fuel used in apartments - Solar energy (%)
House heating fuel used in apartments - Other fuel (%)
House heating fuel used in apartments - No fuel used (%)
Latest news about housing in Prosper, TX collected exclusively by city-data.com from local newspapers, TV, and radio stations
Median year house/condo built: 2015Median year apartment built: 2013Household type by relationship:
Households: 33,829
Male householders: 6,164 (208 living alone ), Female householders: 3,575 (391 living alone )8,005 spouses (7,958 opposite-sex spouses ), 266 unmarried partners , (266 opposite-sex unmarried partners ), 13,471 children (12,704 natural , 253 adopted , 514 stepchildren ), 325 grandchildren , 351 brothers or sisters , 628 parents , 158 foster children , 351 other relatives , 531 non-relatives
Size of family households: 2,431 2-persons , 1,513 3-persons , 3,227 4-persons , 962 5-persons , 426 6-persons , 201 7-or-more-persons .
Size of nonfamily households: 645 1-person , 161 2-persons , 19 3-persons .
9,557 married couples with children. single-parent households (301 men , 520 women ).
83.2% of residents of Prosper speak English at home. of residents speak Spanish at home (82% speak English very well , 12% speak English well , 5% speak English not well , 2% don't speak English at all ).of residents speak other Indo-European language at home (76% speak English very well , 18% speak English well , 5% speak English not well ).of residents speak Asian or Pacific Island language at home (69% speak English very well , 24% speak English well , 8% speak English not well ).of residents speak other language at home (68% speak English very well , 32% speak English well ).
Foreign born population: 4,563 (13.5%)of them are naturalized citizens )
Median number of rooms in houses and condos:
Median number of rooms in apartments
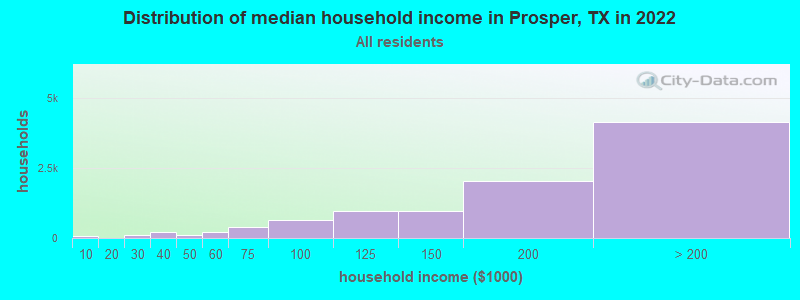
Prosper, TX household income distribution 87 Less than $10,000106 $20,000 to $29,999213 $30,000 to $39,999105 $40,000 to $49,999226 $50,000 to $59,999407 $60,000 to $74,999635 $75,000 to $99,999957 $100,000 to $124,999982 $125,000 to $149,9992,047 $150,000 to $199,9994,156 $200,000 or more
Home value of owner - occupied houses in 2022 in Prosper, TX 69 Less than $10,00019 $10,000 to $14,99921 $60,000 to $69,99926 $70,000 to $79,99959 $100,000 to $124,9993 $125,000 to $149,99912 $175,000 to $199,99972 $200,000 to $249,999113 $250,000 to $299,999387 $300,000 to $399,9991,430 $400,000 to $499,9995,059 $500,000 to $749,9992,509 $750,000 to $999,9991,468 $1,000,000 to $1,499,999172 $1,500,000 to $1,999,999105 $2,000,000 or moreRent paid by renters in 2022 in Prosper, TX 12 $200 to $24921 $650 to $69960 $900 to $999114 $1,000 to $1,24954 $1,250 to $1,499456 $1,500 to $1,999278 $2,000 to $2,49957 $2,500 to $2,99971 $3,500 or more8 No cash rent
Percentage of workers working in this county: 72.2%Number of people working at home: 6,882 (42.4% of all workers )
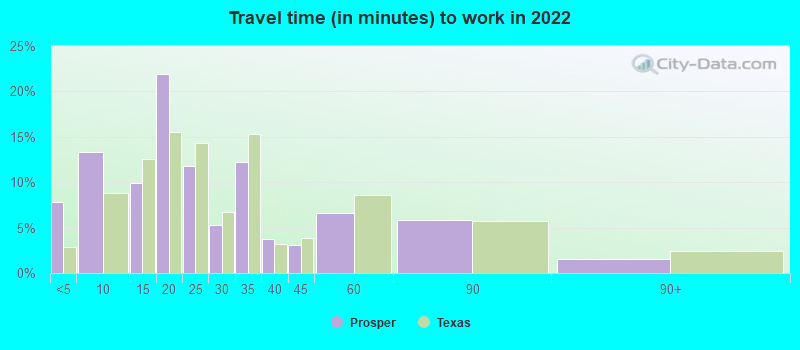
Travel time to work (commute)
Less than 5 minutes: 3485 to 9 minutes: 71210 to 14 minutes: 64015 to 19 minutes: 91720 to 24 minutes: 1,40325 to 29 minutes: 1,11630 to 34 minutes: 1,49135 to 39 minutes: 49040 to 44 minutes: 50245 to 59 minutes: 1,54060 to 89 minutes: 59090 or more minutes: 203
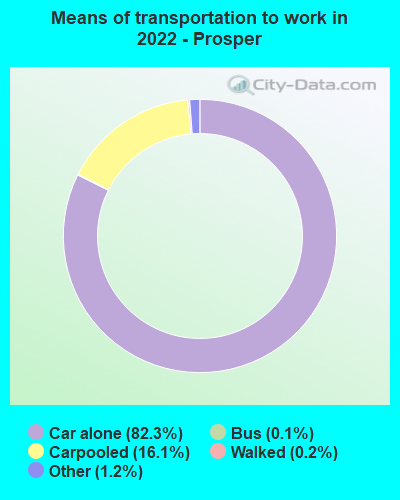
Means of transportation to work:
Drove a car alone: 6,438 (46.3%)Carpooled: 1,349 (9.7%)Bus : 12 (0.1%)Taxi: 97 (0.7%)Walked: 26 (0.2%)Worked at home: 6,882 (49.5%)
Unemployment by race in 2022
Unemployment rate for White non-Hispanic residents 1.5% Males1.0% FemalesUnemployment rate for Black residents 4.3% Males21.9% FemalesUnemployment rate for American Indian and Alaska Native residents 5.4% FemalesUnemployment rate for Asian residents 4.8% Males10.0% FemalesUnemployment rate for other race residents 9.0% Males19.3% FemalesUnemployment rate for two or more race residents 4.4% Males12.1% FemalesUnemployment rate for Hispanic or Latino residents 3.5% Males17.7% Females
Year of entry for the foreign-born population in Prosper, Texas
1,577 2010 or later 828 2000 to 2009 847 1990 to 1999 43 1980 to 1989 45 1970 to 1979 11 Before 1970
First ancestries reported:
American: 3,421 (19.4%)
English: 2,072 (11.8%)
German: 1,337 (7.6%)
Irish: 553 (3.1%)
Nigerian: 512 (2.9%)
Italian: 475 (2.7%)
Slovene: 364 (2.1%)
European: 331 (1.9%)
Russian: 215 (1.2%)
Welsh: 182 (1.0%)
Scotch-Irish: 154 (0.9%)
Egyptian: 148 (0.8%)
Polish: 138 (0.8%)
Norwegian: 138 (0.8%)
African: 138 (0.8%)
Scottish: 125 (0.7%)
Canadian: 107 (0.6%)
Iranian: 89 (0.5%)
South African: 64 (0.4%)
Swedish: 46 (0.3%)
Belgian: 45 (0.3%)
Scandinavian: 40 (0.2%)
Czech: 38 (0.2%)
Kenyan: 37 (0.2%)
Dutch: 35 (0.2%)
Ugandan: 34 (0.2%)
British: 32 (0.2%)
Eastern European: 31 (0.2%)
French: 29 (0.2%)
Northern European: 25 (0.1%)
Turkish: 19 (0.1%)
Lithuanian: 17 (0.10%)
Ukrainian: 17 (0.10%)
Romanian: 16 (0.09%)
Greek: 12 (0.07%)
Czechoslovakian: 10 (0.06%)
Yugoslavian: 6 (0.03%)
Slovak: 5 (0.03%)
French Canadian: 4 (0.02%)
Hungarian: 1 (0.01%) Most common places of birth for foreign-born residents (%): India Prosper:
28.2% (1,216)Texas:
6.1% (306,347)
Pakistan Prosper:
9.6% (414)Texas:
1.2% (62,159)
Canada Prosper:
8.3% (358)Texas:
1.1% (55,371)
Mexico Prosper:
5.5% (236)Texas:
48.4% (2,411,723)
Uganda Prosper:
4.3% (185)Texas:
0.1% (3,573)
Nigeria Prosper:
4.1% (178)Texas:
1.9% (96,110)
Other Eastern Europe Prosper:
3.5% (152)Texas:
0.1% (3,669)
China, excluding Hong Kong and Taiwan Prosper:
3.4% (145)Texas:
2.3% (115,558)
Korea Prosper:
2.7% (118)Texas:
1.2% (60,172)
Honduras Prosper:
2.7% (115)Texas:
3.0% (147,182)
Egypt Prosper:
2.5% (109)Texas:
0.3% (14,588)
South Africa Prosper:
2.5% (106)Texas:
0.2% (11,402)
Vietnam Prosper:
2.1% (91)Texas:
3.7% (184,770)
Nicaragua Prosper:
2.0% (88)Texas:
0.4% (18,642)
El Salvador Prosper:
1.7% (72)Texas:
4.5% (224,455)
Germany Prosper:
1.6% (70)Texas:
0.8% (37,989)
Belgium Prosper:
1.6% (69)Texas:
0.0% (1,892)
Place of birth for U.S.-born residents:
This state: 13,395Other state: 15,561Northeast: 1,616Midwest: 5,902South: 4,090West: 3,991 86.4% of Prosper residents lived in the same house 1 years ago.
Out of people who lived in different houses, 26.7% lived in this county.
Out of people who lived in different counties, 34.8% lived in Texas.
Prosper:
86.4%State average:
85.7%
Education attainment for males 25 years and older:
No schooling: 14Nursery to 4th grade: 675th and 6th grade: 77th and 8th grade: 119th grade: 2410th grade: 6511th grade: 012th grade, no diploma: 113High school graduate (or equivalency): 1,036Less than 1 year of college: 302Some college more than 1 year, no degree: 942Associate degree: 521Bachelor's degree: 4,821Master's degree: 2,038Professional school degree: 385Doctorate degree: 200
Education attainment for females 25 years and older:
No schooling: 30Nursery to 4th grade: 05th and 6th grade: 97th and 8th grade: 09th grade: 2310th grade: 3011th grade: 1312th grade, no diploma: 56High school graduate (or equivalency): 1,365Less than 1 year of college: 567Some college more than 1 year, no degree: 1,170Associate degree: 663Bachelor's degree: 4,123Master's degree: 1,849Professional school degree: 289Doctorate degree: 184
Housing units in structures:
One, detached: 9,666One, attached: 1113 or 4: 1075 to 9: 23810 to 19: 29620 to 49: 12650 or more: 64Mobile homes: 52Boats, RVs, vans, etc.: 21Median worth of mobile homes: $1,077,799
Housing units lacking complete plumbing facilities in 2022: 0.1%Housing units lacking complete kitchen facilities in 2022: 4.4%House/condo owner moved in on average 4 years ago
Renter moved in on average 1 years ago
Private vs. public school enrollment:
Students in private schools in grades 1 to 8 (elementary and middle school): 354 Students in private schools in grades 9 to 12 (high school): 91 Students in private undergraduate colleges: 126