Princeton, IL (Illinois) Houses and Residents
| Princeton: | $143,531 |
| Illinois: | $251,600 |
Mean price in 2022:
Detached houses: $153,682
Here: $153,682 State: $310,164 Townhouses or other attached units: $146,643
Here: $146,643 State: $286,230 In 2-unit structures: $124,384
Here: $124,384 State: $299,638 In 5-or-more-unit structures: $123,365
Here: $123,365 State: $318,887 Mobile homes: $34,534
Here: $34,534 State: $78,855
Total population: 7,415 (Urban population: 7,265 (all inside urban clusters), Rural population: 335 (all nonfarm))
Houses: 3,857 (3,504 occupied: 2,538 owner occupied, 1,010 renter occupied)
| % of renters here: | 28% |
| State: | 33% |
Housing density: 573 houses/condos per square mile
Median price asked for vacant for-sale houses and condos in 2022: $118,284.
Median contract rent in 2022: $606 (lower quartile is $461, upper quartile is $720)
Median rent asked for vacant for-rent units in 2022: $557
Median gross rent in Princeton, IL in 2022: $721
Housing units in Princeton with a mortgage: 1,498 (69 second mortgage, 0 home equity loan, 69 both second mortgage and home equity loan)
Houses without a mortgage: 8
Median household income for houses/condos with a mortgage: $77,622
Median household income for apartments without a mortgage: $58,835
Median monthly housing costs: $815
Compare current foreclosures near Princeton, IL:
| Photo | Address | Area | Beds / Baths | Price | Details |
|---|---|---|---|---|---|

|
#1
E Marion St
Princeton, IL 61356
|
1,268 sq. feet
|
1 baths 2 beds |
show details | |

|
#2
N Mercer St
Princeton, IL 61356
|
- sq. feet
|
- baths - beds |
show details | |

|
#3
W Clark St
Princeton, IL 61356
|
- sq. feet
|
- baths - beds |
show details | |

|
#4
1/2 W Marquette St
Princeton, IL 61356
|
- sq. feet
|
- baths - beds |
show details | |

|
#5
N Chestnut St
Princeton, IL 61356
|
- sq. feet
|
- baths - beds |
show details | |

|
#6
N Chestnut St
Princeton, IL 61356
|
- sq. feet
|
- baths - beds |
show details | |

|
#7
Pombrook Dr
Princeton, IL 61356
|
- sq. feet
|
- baths - beds |
show details | |

|
#8
W Central Ave
Princeton, IL 61356
|
- sq. feet
|
- baths - beds |
show details | |

|
#9
1500 North Ave
Princeton, IL 61356
|
- sq. feet
|
- baths - beds |
show details | |

|
#10
S Church St
Princeton, IL 61356
|
- sq. feet
|
- baths - beds |
show details |
| Photo | Address | Area | Beds / Baths | Price | Details |
|---|---|---|---|---|---|

|
#11
Wyanet Walnut Rd
Princeton, IL 61356
|
- sq. feet
|
- baths - beds |
show details | |

|
#12
Lincoln St
Seatonville, IL 61359
|
2,308 sq. feet
|
3 baths 4 beds |
show details | |

|
#13
E 4th St
Spring Valley, IL 61362
|
- sq. feet
|
1 baths 3 beds |
show details | |

|
#14
2150 East St
Tiskilwa, IL 61368
|
1,630 sq. feet
|
2 baths 3 beds |
show details | |

|
#15
2400 North Ave # -
La Moille, IL 61330
|
1,700 sq. feet
|
1 baths 4 beds |
show details | |

|
#16
N Main St
Manlius, IL 61338
|
- sq. feet
|
- baths - beds |
show details | |

|
#17
E 6th St
Spring Valley, IL 61362
|
- sq. feet
|
- baths - beds |
show details | |

|
#18
E Erie St
Spring Valley, IL 61362
|
- sq. feet
|
- baths - beds |
show details | |

|
#19
E 1st St
Spring Valley, IL 61362
|
- sq. feet
|
- baths - beds |
show details | |

|
#20
E High St
Hennepin, IL 61327
|
- sq. feet
|
- baths - beds |
show details |
| Photo | Address | Area | Beds / Baths | Price | Details |
|---|---|---|---|---|---|

|
#21
E 4th St
Depue, IL 61322
|
- sq. feet
|
- baths - beds |
show details | |

|
#22
E 4th St
Depue, IL 61322
|
- sq. feet
|
- baths - beds |
show details | |

|
#23
2nd St
Mark, IL 61340
|
- sq. feet
|
- baths - beds |
show details | |

|
#24
E Main St
Wyanet, IL 61379
|
- sq. feet
|
- baths - beds |
show details | |

|
#25
N Park Ave
Dover, IL 61323
|
- sq. feet
|
- baths - beds |
show details | |

|
#26
2900 North Ave
Walnut, IL 61376
|
- sq. feet
|
- baths - beds |
show details | |

|
#27
E Main St
Granville, IL 61326
|
- sq. feet
|
- baths - beds |
show details | |

|
#28
W Minnesota St
Spring Valley, IL 61362
|
- sq. feet
|
- baths - beds |
show details | |

|
#29
W Iowa St
Spring Valley, IL 61362
|
- sq. feet
|
- baths - beds |
show details | |

|
#30
E Mulberry St
Hennepin, IL 61327
|
- sq. feet
|
- baths - beds |
show details |
| Photo | Address | Area | Beds / Baths | Price | Details |
|---|---|---|---|---|---|

|
#31
S Mason St
Sheffield, IL 61361
|
- sq. feet
|
- baths - beds |
show details | |

|
#32
Depot St
Walnut, IL 61376
|
- sq. feet
|
- baths - beds |
show details | |

|
#33
Rock Island St
Spring Valley, IL 61362
|
- sq. feet
|
- baths - beds |
show details | |

|
#34
Dalzell St
Spring Valley, IL 61362
|
- sq. feet
|
- baths - beds |
show details | |

|
#35
Malibu Dr
Putnam, IL 61560
|
- sq. feet
|
- baths - beds |
show details | |

|
#36
E High St
Hennepin, IL 61327
|
- sq. feet
|
- baths - beds |
show details | |

|
#37
E Mulberry St
Hennepin, IL 61327
|
- sq. feet
|
- baths - beds |
show details | |

|
#38
S King St
Wyanet, IL 61379
|
- sq. feet
|
- baths - beds |
show details | |

|
#39
S King St
Wyanet, IL 61379
|
- sq. feet
|
- baths - beds |
show details | |

|
#40
2500 North Ave
La Moille, IL 61330
|
- sq. feet
|
- baths - beds |
show details |
| Photo | Address | Area | Beds / Baths | Price | Details |
|---|---|---|---|---|---|

|
Check over 1 million property listings on Foreclosure.com!
|
browse all offers | |||
| Photo | Address | Area | Beds / Baths | Price | Details |
|---|

Latest news about housing in Princeton, IL collected exclusively by city-data.com from local newspapers, TV, and radio stations

 | Many people are leaving Illinois (313 replies) |
| Here's what they are teaching our kids in Illinois public schools (87 replies) |
| N. Princeton Ave in Villa Park (10 replies) |
| North Shore vs. Barrington area vs. Oak Brook/Hinsdale (9 replies) |
| Safe apartments and places to live in Peoria, IL (19 replies) |
| Tell me more about Princeton, IL (6 replies) |

Median year apartment built: 1973
Household type by relationship:
Households: 7,642- Male householders: 1,645 (505 living alone), Female householders: 1,794 (845 living alone)
1,474 spouses (1,433 opposite-sex spouses), 263 unmarried partners, (263 opposite-sex unmarried partners), 1,937 children (1,882 natural, 9 adopted, 45 stepchildren), 81 grandchildren, 5 brothers or sisters, 95 parents, 11 foster children, 14 other relatives, 81 non-relatives
- In group quarters: 234
Size of family households: 1,044 2-persons, 363 3-persons, 223 4-persons, 236 5-persons, 44 6-persons.
Size of nonfamily households: 1,423 1-person, 206 2-persons, 14 3-persons.
926 married couples with children.
425 single-parent households (55 men, 370 women).
96.9% of residents of Princeton speak English at home.
1.2% of residents speak Spanish at home (56% speak English very well, 30% speak English well, 15% don't speak English at all).
0.6% of residents speak other Indo-European language at home (57% speak English very well, 15% speak English well, 28% speak English not well).
0.8% of residents speak Asian or Pacific Island language at home (100% speak English very well).
0.6% of residents speak other language at home (49% speak English very well, 51% speak English well).
Foreign born population: 196 (2.6%)
(25.5% of them are naturalized citizens)
| Here: | 6.5 |
| State: | 6.4 |
| Here: | 4.0 |
| State: | 4.1 |

- Bedrooms in owner-occupied houses and condos in Princeton, Illinois
- 0no bedroom
- 861 bedroom
- 5592 bedrooms
- 1,4853 bedrooms
- 3364 bedrooms
- 735+ bedrooms

- Bedrooms in renter-occupied apartments in Princeton, Illinois
- 99no bedroom
- 3471 bedroom
- 3212 bedrooms
- 1993 bedrooms
- 334 bedrooms
- 125+ bedrooms

- Cars and other vehicles available in Princeton in owner-occupied houses/condos
- 26no vehicle
- 8301 vehicle
- 1,2432 vehicles
- 3663 vehicles
- 624 vehicles
- 115+ vehicles

- Cars and other vehicles available in Princeton in renter-occupied apartments
- 212no vehicle
- 6251 vehicle
- 1532 vehicles
- 143 vehicles
- 04 vehicles
- 75+ vehicles

- Rooms in owner-occupied houses in Princeton, Illinois
- 01 room
- 02 rooms
- 383 rooms
- 2174 rooms
- 4605 rooms
- 5456 rooms
- 5217 rooms
- 3418 rooms
- 4179+ rooms

- Rooms in renter-occupied apartments in Princeton, Illinois
- 921 room
- 212 rooms
- 2383 rooms
- 2454 rooms
- 1405 rooms
- 1306 rooms
- 557 rooms
- 158 rooms
- 739+ rooms


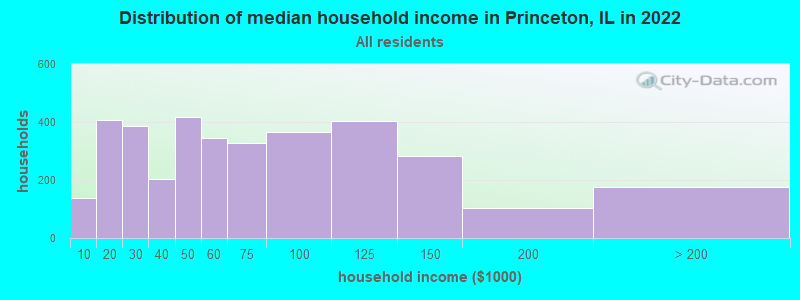
Princeton, IL household income distribution

- 137Less than $10,000
- 408$10,000 to $19,999
- 386$20,000 to $29,999
- 204$30,000 to $39,999
- 416$40,000 to $49,999
- 345$50,000 to $59,999
- 329$60,000 to $74,999
- 366$75,000 to $99,999
- 403$100,000 to $124,999
- 283$125,000 to $149,999
- 103$150,000 to $199,999
- 176$200,000 or more
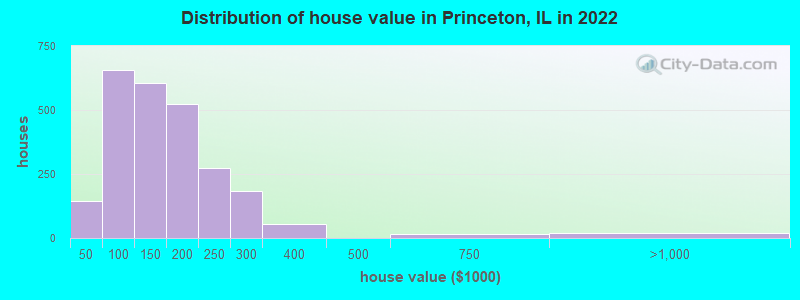
Home value of owner - occupied houses in 2022 in Princeton, IL
-
- 38Less than $10,000
- 14$15,000 to $19,999
- 22$20,000 to $24,999
- 14$25,000 to $29,999
- 55$40,000 to $49,999
- 107$50,000 to $59,999
- 96$60,000 to $69,999
- 191$70,000 to $79,999
- 66$80,000 to $89,999
- 137$90,000 to $99,999
- 306$100,000 to $124,999
- 299$125,000 to $149,999
- 386$150,000 to $174,999
- 138$175,000 to $199,999
- 273$200,000 to $249,999
- 184$250,000 to $299,999
- 55$300,000 to $399,999
- 16$500,000 to $749,999
- 19$750,000 to $999,999
Rent paid by renters in 2022 in Princeton, IL
-
- 7$100 to $149
- 48$200 to $249
- 22$250 to $299
- 32$350 to $399
- 59$400 to $449
- 141$450 to $499
- 45$500 to $549
- 29$550 to $599
- 72$600 to $649
- 116$650 to $699
- 150$700 to $749
- 62$750 to $799
- 35$800 to $899
- 4$1,250 to $1,499
- 9$2,000 to $2,499
- 14$3,500 or more
- 154No cash rent


Percentage of workers working in this county: 85.2%
Number of people working at home: 339 (10.2% of all workers)
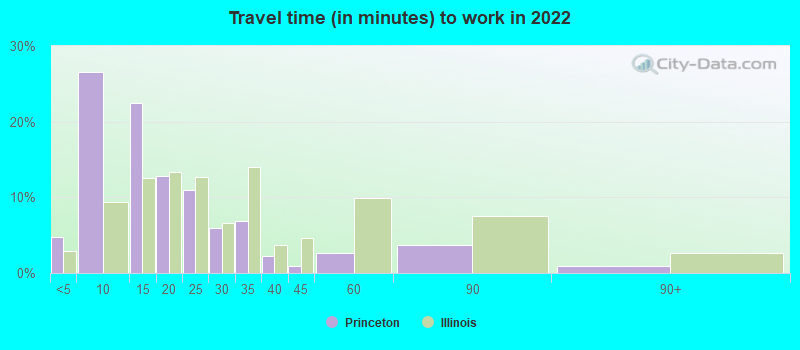
Travel time to work (commute)
- Less than 5 minutes: 183
- 5 to 9 minutes: 1,063
- 10 to 14 minutes: 518
- 15 to 19 minutes: 118
- 20 to 24 minutes: 492
- 25 to 29 minutes: 162
- 30 to 34 minutes: 230
- 35 to 39 minutes: 4
- 40 to 44 minutes: 19
- 45 to 59 minutes: 81
- 60 to 89 minutes: 79
- 90 or more minutes: 30

Means of transportation to work:
- Drove a car alone: 3,781 (78.9%)
- Carpooled: 424 (8.9%)
- Bus: 23 (0.5%)
- Taxi: 36 (0.8%)
- Bicycle: 37 (0.8%)
- Walked: 93 (1.9%)
- Worked at home: 339 (7.1%)

- Unemployment by race in 2022
- Unemployment rate for White non-Hispanic residents
- 4.8%Males
- 3.9%Females
- Unemployment rate for other race residents
- 68.1%Males
- 100.0%Females

- Year of entry for the foreign-born population in Princeton, Illinois
- 1082010 or later
- 92000 to 2009
- 561990 to 1999
- 131980 to 1989
- 181970 to 1979
- 65Before 1970
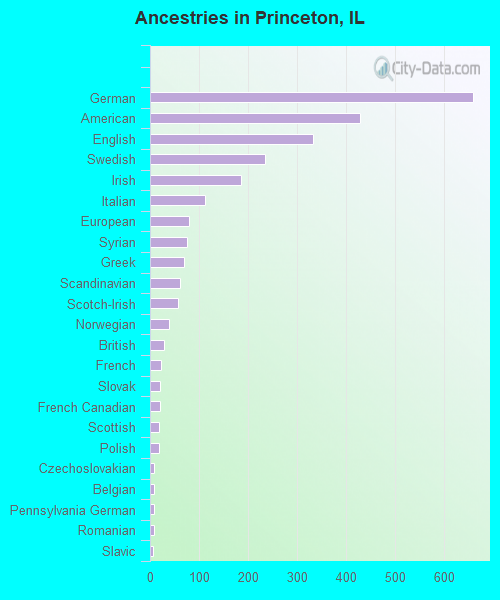
First ancestries reported:
- German: 658 (22.3%)
- American: 428 (14.5%)
- English: 332 (11.2%)
- Swedish: 234 (7.9%)
- Irish: 186 (6.3%)
- Italian: 112 (3.8%)
- European: 80 (2.7%)
- Syrian: 75 (2.5%)
- Greek: 70 (2.4%)
- Scandinavian: 61 (2.1%)
- Scotch-Irish: 58 (2.0%)
- Norwegian: 38 (1.3%)
- British: 29 (1.0%)
- French: 22 (0.7%)
- Slovak: 21 (0.7%)
- French Canadian: 20 (0.7%)
- Scottish: 19 (0.6%)
- Polish: 18 (0.6%)
- Czechoslovakian: 9 (0.3%)
- Belgian: 8 (0.3%)
- Pennsylvania German: 8 (0.3%)
- Romanian: 8 (0.3%)
- Slavic: 6 (0.2%)
- Finnish: 5 (0.2%)
Most common places of birth for foreign-born residents (%):
| Princeton: | 18.9% (37) |
| Illinois: | 9.2% (166,409) |
| Princeton: | 16.8% (33) |
| Illinois: | 5.2% (93,003) |
| Princeton: | 14.8% (29) |
| Illinois: | 0.4% (6,781) |
| Princeton: | 14.3% (28) |
| Illinois: | 0.5% (8,551) |
| Princeton: | 10.2% (20) |
| Illinois: | 0.9% (16,553) |
| Princeton: | 9.2% (18) |
| Illinois: | 34.7% (626,958) |
| Princeton: | 8.7% (17) |
| Illinois: | 1.0% (18,753) |
| Princeton: | 4.1% (8) |
| Illinois: | 0.1% (2,376) |
| Princeton: | 3.6% (7) |
| Illinois: | 0.8% (14,736) |
| Princeton: | 2.0% (4) |
| Illinois: | 6.9% (124,474) |
Place of birth for U.S.-born residents:
- This state: 5,929
- Other state: 1,458
- Northeast: 48
- Midwest: 821
- South: 364
- West: 225
85.9% of Princeton residents lived in the same house 1 years ago.
Out of people who lived in different houses, 35.5% lived in this county.
Out of people who lived in different counties, 75.4% lived in Illinois.
| Princeton: | 85.9% |
| State average: | 88.3% |
Education attainment for males 25 years and older:
- No schooling: 1
- Nursery to 4th grade: 0
- 5th and 6th grade: 11
- 7th and 8th grade: 7
- 9th grade: 15
- 10th grade: 14
- 11th grade: 66
- 12th grade, no diploma: 92
- High school graduate (or equivalency): 931
- Less than 1 year of college: 163
- Some college more than 1 year, no degree: 345
- Associate degree: 230
- Bachelor's degree: 423
- Master's degree: 153
- Professional school degree: 65
- Doctorate degree: 10

Education attainment for females 25 years and older:
- No schooling: 22
- Nursery to 4th grade: 0
- 5th and 6th grade: 6
- 7th and 8th grade: 28
- 9th grade: 8
- 10th grade: 4
- 11th grade: 92
- 12th grade, no diploma: 66
- High school graduate (or equivalency): 963
- Less than 1 year of college: 378
- Some college more than 1 year, no degree: 321
- Associate degree: 312
- Bachelor's degree: 528
- Master's degree: 370
- Professional school degree: 19
- Doctorate degree: 15


Housing units in structures:
- One, detached: 2,776
- One, attached: 102
- Two: 197
- 3 or 4: 152
- 5 to 9: 229
- 10 to 19: 144
- 20 to 49: 41
- 50 or more: 91
- Mobile homes: 121
Median worth of mobile homes: $30,319
Housing units lacking complete kitchen facilities in 2022: 0.8%
House/condo owner moved in on average 10 years ago
Renter moved in on average 7 years ago

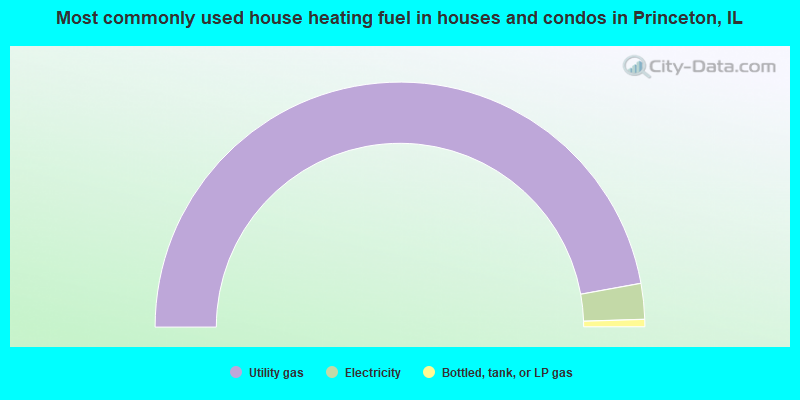
- 94.2%Utility gas
- 4.7%Electricity
- 1.0%Bottled, tank, or LP gas
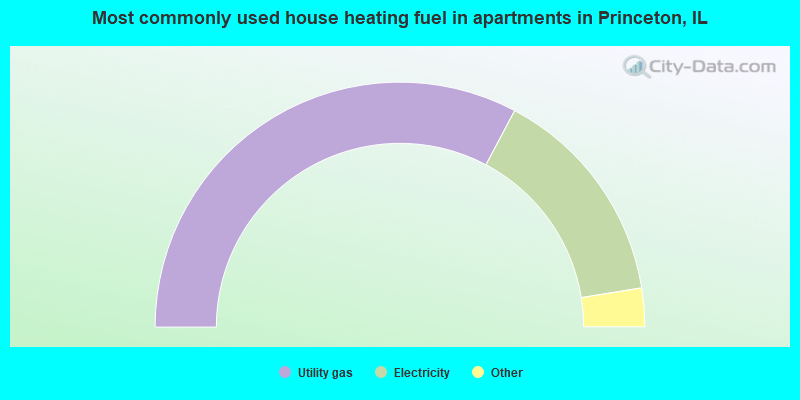
- 65.6%Utility gas
- 29.4%Electricity
- 1.7%Bottled, tank, or LP gas
- 1.7%No fuel used
- 1.6%Other fuel
Private vs. public school enrollment:
| Here: | 24.8% |
| Illinois: | 13.3% |
| Here: | 1.9% |
| Illinois: | 9.9% |
| Here: | 13.5% |
| Illinois: | 27.4% |


