Potomac, MD (Maryland) Houses and Residents
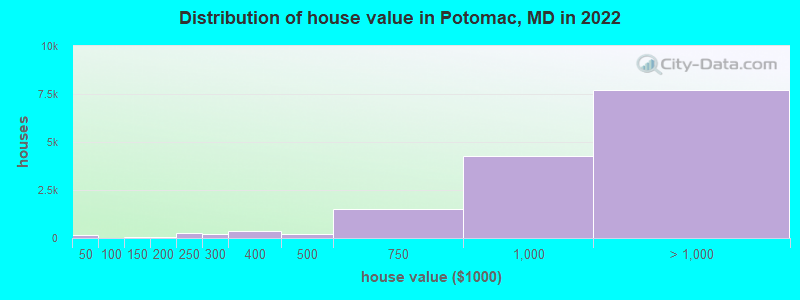
Estimated median house or condo value in 2022: $1,089,436 (it was $439,200 in 2000 )
Potomac:
$1,089,436Maryland:
$398,100
Lower value quartile - upper value quartile: $818,041 - $1,438,421Mean price in 2022: Detached houses: $1,441,223 Here:
$1,441,223State:
$526,819
Townhouses or other attached units: $944,075 Here:
$944,075State:
$328,305
In 5-or-more-unit structures: $436,433 Here:
$436,433State:
$350,378
Total population: 44,965 (Urban population: 44,632, Rural population: 189 (all nonfarm) )
Houses: 16,993 (16,457 occupied: 14,130 owner occupied, 2,452 renter occupied )
% of renters here:
15%State:
32%
Housing density: 675 houses/condos per square mile
Median price asked for vacant for-sale houses and condos in 2022: $1,972,587.
Median contract rent in 2022: over $2,000
Median rent asked for vacant for-rent units in 2022: $9,808
Median gross rent in Potomac, MD in 2022: over $2,000
Housing units in Potomac with a mortgage: 9,059 (1,124 second mortgage, 21 home equity loan, 1,048 both second mortgage and home equity loan )Houses without a mortgage: 162
Median household income for houses/condos with a mortgage: $241,073
Median household income for apartments without a mortgage: $172,508
Median monthly housing costs: $2,795
Data:
Median house or condo value ($)
Median house or condo value ($ change since 2000)
Median house or condo value ($) - White
Median house or condo value ($) - Black or African American
Median house or condo value ($) - Asian
Median house or condo value ($) - Hispanic or Latino
Median house or condo value ($) - American Indian and Alaska Native
Median house or condo value ($) - Multirace
Median house or condo value ($) - Other Race
Median price asked for mobile homes ($)
Household density (households per square mile)
Mean house or condo value by units in structure - 1, detached ($)
Mean house or condo value by units in structure - 1, attached ($)
Mean house or condo value by units in structure - 2 ($)
Mean house or condo value by units in structure by units in structure - 3 or 4 ($)
Mean house or condo value by units in structure - 5 or more ($)
Mean house or condo value by units in structure - Boat, RV, van, etc. ($)
Mean house or condo value by units in structure - Mobile home ($)
Median contract rent ($)
Median contract rent - Lower quartile ($)
Median contract rent - Upper quartile ($)
Median gross rent ($)
Urban houses (%)
Rural houses (%)
Houses occupied (%)
Houses occupied (% change since 2000)
Houses owner occupied (%)
Houses owner occupied (% change since 2000)
Houses renter occupied (%)
Houses renter occupied (% change since 2000)
Vacant housing units - For rent (%)
Vacant housing units - For rent (% change since 2000)
Vacant housing units - For sale only (%)
Vacant housing units - For sale only (% change since 2000)
Vacant housing units - Rented or sold, not occupied (%)
Vacant housing units - Rented or sold, not occupied (% change since 2000)
Vacant housing units - For seasonal, recreational, or occasional use (%)
Vacant housing units - For seasonal, recreational, or occasional use (% change since 2000)
Vacant housing units - For migrant workers (%)
Vacant housing units - For migrant workers (% change since 2000)
Vacant housing units - Other vacant (%)
Vacant housing units - Other vacant (% change since 2000)
Median monthly housing costs ($)
Median household income for houses/condos with a mortgage ($)
Median household income for houses/condos without a mortgage ($)
Median household income ($)
Median household income ($) - White
Median household income ($) - Black or African American
Median household income ($) - Asian
Median household income ($) - Hispanic or Latino
Median household income ($) - American Indian and Alaska Native
Median household income ($) - Multirace
Median household income ($) - Other Race
Mortgage status - with mortgage (%)
Mortgage status - with second mortgage (%)
Mortgage status - with home equity loan (%)
Mortgage status - with both second mortgage and home equity loan (%)
Mortgage status - without a mortgage (%)
Median year house/condo built
Median year apartment built
Household type by relationship - Male householder living alone (%)
Household type by relationship - Male householder not living alone (%)
Household type by relationship - Female householder living alone (%)
Household type by relationship - Female householder not living alone (%)
Household type by relationship - Opposite-Sex spouse (%)
Household type by relationship - Same-Sex spouse (%)
Household type by relationship - Opposite-Sex unmarried partner (%)
Household type by relationship - Same-Sex unmarried partner (%)
Household type by relationship - In group quarters (%)
Size of family households - 2-person household (%)
Size of family households - 3-person household (%)
Size of family households - 4-person household (%)
Size of family households - 5-person household (%)
Size of family households - 6-person household (%)
Size of family households - 7-or-more-person household (%)
Size of nonfamily households - 1-person household (%)
Size of nonfamily households - 2-person household (%)
Size of nonfamily households - 3-person household (%)
Size of nonfamily households - 4-person household (%)
Size of nonfamily households - 5-person household (%)
Size of nonfamily households - 6-person household (%)
Size of nonfamily households - 7-or-moreperson household (%)
Year house built - Built 2010 or later (%)
Year house built - Built 2000 to 2009 (%)
Year house built - Built 1990 to 1999 (%)
Year house built - Built 1980 to 1989 (%)
Year house built - Built 1970 to 1979 (%)
Year house built - Built 1960 to 1969 (%)
Year house built - Built 1950 to 1959 (%)
Year house built - Built 1940 to 1949 (%)
Year house built - Built 1939 or earlier (%)
Median number of rooms in houses and condos
Median number of rooms in apartments
Median number of bedrooms in owner occupied houses
Mean number of bedrooms in owner occupied houses
Median number of bedrooms in renter occupied houses
Mean number of bedrooms in renter occupied houses
Median number of vehichles in owner occupied houses
Mean number of vehichles in owner occupied houses
Median number of vehichles in renter occupied houses
Mean number of vehichles in renter occupied houses
Rooms in owner-occupied houses - 1 room (%)
Rooms in owner-occupied houses - 2 rooms (%)
Rooms in owner-occupied houses - 3 rooms (%)
Rooms in owner-occupied houses - 4 rooms (%)
Rooms in owner-occupied houses - 5 rooms (%)
Rooms in owner-occupied houses - 6 rooms (%)
Rooms in owner-occupied houses - 7 rooms (%)
Rooms in owner-occupied houses - 8 rooms (%)
Rooms in owner-occupied houses - 9+ rooms (%)
Rooms in renter-occupied houses - 1 room (%)
Rooms in renter-occupied houses - 2 rooms (%)
Rooms in renter-occupied houses - 3 rooms (%)
Rooms in renter-occupied houses - 4 rooms (%)
Rooms in renter-occupied houses - 5 rooms (%)
Rooms in renter-occupied houses - 6 rooms (%)
Rooms in renter-occupied houses - 7 rooms (%)
Rooms in renter-occupied houses - 8 rooms (%)
Rooms in renter-occupied houses - 9+ rooms (%)
Bedrooms in owner-occupied houses - no bedrooms (%)
Bedrooms in owner-occupied houses - 1 bedroom (%)
Bedrooms in owner-occupied houses - 2 bedrooms (%)
Bedrooms in owner-occupied houses - 3 bedrooms (%)
Bedrooms in owner-occupied houses - 4 bedrooms (%)
Bedrooms in owner-occupied houses - 5+ bedrooms (%)
Bedrooms in renter-occupied houses - no bedrooms (%)
Bedrooms in renter-occupied houses - 1 bedroom (%)
Bedrooms in renter-occupied houses - 2 bedrooms (%)
Bedrooms in renter-occupied houses - 3 bedrooms (%)
Bedrooms in renter-occupied houses - 4 bedrooms (%)
Bedrooms in renter-occupied houses - 5+ bedrooms (%)
Vehicles available in owner-occupied houses - no vehicle available (%)
Vehicles available in owner-occupied houses - 1 vehicle available(%)
Vehicles available in owner-occupied houses - 2 Vehicles available (%)
Vehicles available in owner-occupied houses - 3 Vehicles available (%)
Vehicles available in owner-occupied houses - 4 Vehicles available (%)
Vehicles available in owner-occupied houses - 5+ Vehicles available (%)
Vehicles available in renter-occupied houses - no vehicle available (%)
Vehicles available in renter-occupied houses - 1 vehicle available (%)
Vehicles available in renter-occupied houses - 2 Vehicles available (%)
Vehicles available in renter-occupied houses - 3 Vehicles available (%)
Vehicles available in renter-occupied houses - 4 Vehicles available (%)
Vehicles available in renter-occupied houses - 5+ Vehicles available (%)
Housing units in structures - 1, detached (%)
Housing units in structures - 1, attached (%)
Housing units in structures - 2 (%)
Housing units in structures - 3 or 4 (%)
Housing units in structures - 5 to 9 (%)
Housing units in structures - 10 to 19 (%)
Housing units in structures - 20 to 49 (%)
Housing units in structures - 50 or more (%)
Housing units in structures - Mobile home (%)
Housing units in structures - Boat, RV, van, etc. (%)
Housing units in structures - Owners - 1, detached (%)
Housing units in structures - Owners - 1, attached (%)
Housing units in structures - Owners - 2 (%)
Housing units in structures - Owners - 3 or 4 (%)
Housing units in structures - Owners - 5 to 9 (%)
Housing units in structures - Owners - 10 to 19 (%)
Housing units in structures - Owners - 20 to 49 (%)
Housing units in structures - Owners - 50 or more (%)
Housing units in structures - Owners - Mobile home (%)
Housing units in structures - Owners - Boat, RV, van, etc. (%)
Housing units in structures - Renters - 1, detached (%)
Housing units in structures - Renters - 1, attached (%)
Housing units in structures - Renters - 2 (%)
Housing units in structures - Renters - 3 or 4 (%)
Housing units in structures - Renters - 5 to 9 (%)
Housing units in structures - Renters - 10 to 19 (%)
Housing units in structures - Renters - 20 to 49 (%)
Housing units in structures - Renters - 50 or more (%)
Housing units in structures - Renters - Mobile home (%)
Housing units in structures - Renters - Boat, RV, van, etc. (%)
House/condo owner moved in on average (years ago)
Renter moved in on average (years ago)
Year householder moved into unit - Moved in 1999 to March 2000 (%)
Year householder moved into unit - Moved in 1999 to March 2000 (%) - White
Year householder moved into unit - Moved in 1999 to March 2000 (%) - Black or African American
Year householder moved into unit - Moved in 1999 to March 2000 (%) - Asian
Year householder moved into unit - Moved in 1999 to March 2000 (%) - Hispanic or Latino
Year householder moved into unit - Moved in 1999 to March 2000 (%) - American Indian and Alaska Native
Year householder moved into unit - Moved in 1999 to March 2000 (%) - Multirace
Year householder moved into unit - Moved in 1999 to March 2000 (%) - Other Race
Year householder moved into unit - Moved in 1995 to 1998 (%)
Year householder moved into unit - Moved in 1995 to 1998 (%) - White
Year householder moved into unit - Moved in 1995 to 1998 (%) - Black or African American
Year householder moved into unit - Moved in 1995 to 1998 (%) - Asian
Year householder moved into unit - Moved in 1995 to 1998 (%) - Hispanic or Latino
Year householder moved into unit - Moved in 1995 to 1998 (%) - American Indian and Alaska Native
Year householder moved into unit - Moved in 1995 to 1998 (%) - Multirace
Year householder moved into unit - Moved in 1995 to 1998 (%) - Other Race
Year householder moved into unit - Moved in 1990 to 1994 (%)
Year householder moved into unit - Moved in 1990 to 1994 (%) - White
Year householder moved into unit - Moved in 1990 to 1994 (%) - Black or African American
Year householder moved into unit - Moved in 1990 to 1994 (%) - Asian
Year householder moved into unit - Moved in 1990 to 1994 (%) - Hispanic or Latino
Year householder moved into unit - Moved in 1990 to 1994 (%) - American Indian and Alaska Native
Year householder moved into unit - Moved in 1990 to 1994 (%) - Multirace
Year householder moved into unit - Moved in 1990 to 1994 (%) - Other Race
Year householder moved into unit - Moved in 1980 to 1989 (%)
Year householder moved into unit - Moved in 1980 to 1989 (%) - White
Year householder moved into unit - Moved in 1980 to 1989 (%) - Black or African American
Year householder moved into unit - Moved in 1980 to 1989 (%) - Asian
Year householder moved into unit - Moved in 1980 to 1989 (%) - Hispanic or Latino
Year householder moved into unit - Moved in 1980 to 1989 (%) - American Indian and Alaska Native
Year householder moved into unit - Moved in 1980 to 1989 (%) - Multirace
Year householder moved into unit - Moved in 1980 to 1989 (%) - Other Race
Year householder moved into unit - Moved in 1970 to 1979 (%)
Year householder moved into unit - Moved in 1970 to 1979 (%) - White
Year householder moved into unit - Moved in 1970 to 1979 (%) - Black or African American
Year householder moved into unit - Moved in 1970 to 1979 (%) - Asian
Year householder moved into unit - Moved in 1970 to 1979 (%) - Hispanic or Latino
Year householder moved into unit - Moved in 1970 to 1979 (%) - American Indian and Alaska Native
Year householder moved into unit - Moved in 1970 to 1979 (%) - Multirace
Year householder moved into unit - Moved in 1970 to 1979 (%) - Other Race
Year householder moved into unit - Moved in 1969 or earlier (%)
Year householder moved into unit - Moved in 1969 or earlier (%) - White
Year householder moved into unit - Moved in 1969 or earlier (%) - Black or African American
Year householder moved into unit - Moved in 1969 or earlier (%) - Asian
Year householder moved into unit - Moved in 1969 or earlier (%) - Hispanic or Latino
Year householder moved into unit - Moved in 1969 or earlier (%) - American Indian and Alaska Native
Year householder moved into unit - Moved in 1969 or earlier (%) - Multirace
Year householder moved into unit - Moved in 1969 or earlier (%) - Other Race
Housing units lacking complete plumbing facilities (%)
Housing units lacking complete kitchen facilities (%)
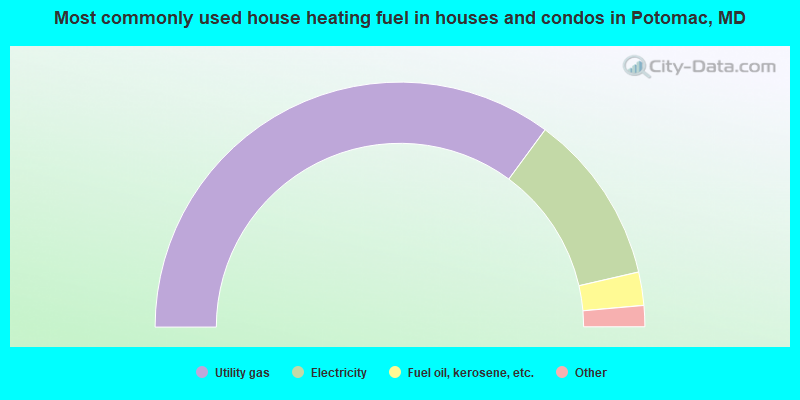
House heating fuel used in houses and condos - Utility gas (%)
House heating fuel used in houses and condos - Bottled, tank, or LP gas (%)
House heating fuel used in houses and condos - Electricity (%)
House heating fuel used in houses and condos - Fuel oil, kerosene, etc. (%)
House heating fuel used in houses and condos - Coal or coke (%)
House heating fuel used in houses and condos - Wood (%)
House heating fuel used in houses and condos - Solar energy (%)
House heating fuel used in houses and condos - Other fuel (%)
House heating fuel used in houses and condos - No fuel used (%)
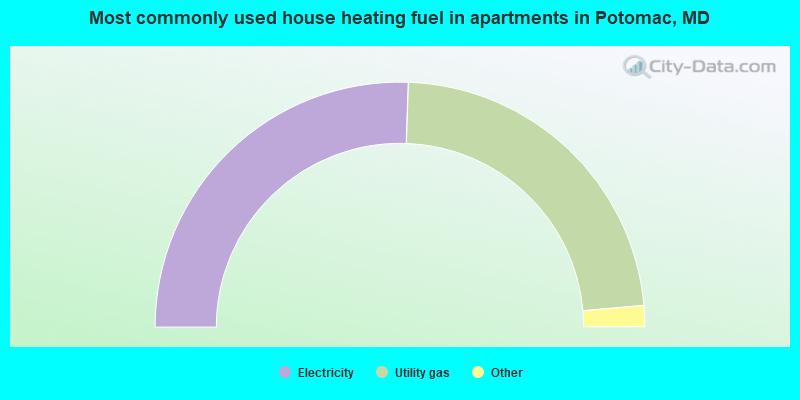
House heating fuel used in apartments - Utility gas (%)
House heating fuel used in apartments - Bottled, tank, or LP gas (%)
House heating fuel used in apartments - Electricity (%)
House heating fuel used in apartments - Fuel oil, kerosene, etc. (%)
House heating fuel used in apartments - Coal or coke (%)
House heating fuel used in apartments - Wood (%)
House heating fuel used in apartments - Solar energy (%)
House heating fuel used in apartments - Other fuel (%)
House heating fuel used in apartments - No fuel used (%)
Latest news about housing in Potomac, MD collected exclusively by city-data.com from local newspapers, TV, and radio stations
Median year house/condo built: 1976Median year apartment built: 1986Household type by relationship:
Households: 46,305
Male householders: 8,893 (1,011 living alone ), Female householders: 7,366 (2,064 living alone )11,650 spouses (11,573 opposite-sex spouses ), 162 unmarried partners , (152 opposite-sex unmarried partners ), 14,796 children (14,252 natural , 228 adopted , 315 stepchildren ), 315 grandchildren , 252 brothers or sisters , 876 parents , 11 foster children , 683 other relatives , 920 non-relatives In group quarters: 376
Size of family households: 5,402 2-persons , 2,816 3-persons , 2,797 4-persons , 1,189 5-persons , 306 6-persons , 152 7-or-more-persons .
Size of nonfamily households: 3,513 1-person , 226 2-persons , 40 3-persons , 7 4-persons , 55 5-persons .
9,231 married couples with children. single-parent households (173 men , 884 women ).
60.7% of residents of Potomac speak English at home. of residents speak Spanish at home (84% speak English very well , 8% speak English well , 4% speak English not well , 4% don't speak English at all ).of residents speak other Indo-European language at home (84% speak English very well , 12% speak English well , 3% speak English not well , 1% don't speak English at all ).of residents speak Asian or Pacific Island language at home (66% speak English very well , 21% speak English well , 9% speak English not well , 3% don't speak English at all ).of residents speak other language at home (77% speak English very well , 15% speak English well , 8% don't speak English at all ).
Foreign born population: 14,104 (30.5%)of them are naturalized citizens )
Median number of rooms in houses and condos:
Median number of rooms in apartments
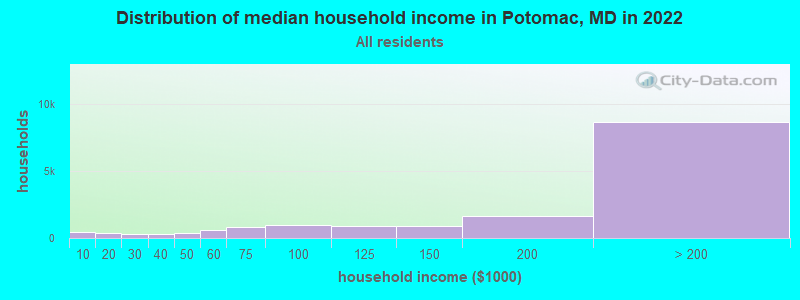
Potomac, MD household income distribution 435 Less than $10,000347 $10,000 to $19,999327 $20,000 to $29,999318 $30,000 to $39,999349 $40,000 to $49,999610 $50,000 to $59,999804 $60,000 to $74,999967 $75,000 to $99,999876 $100,000 to $124,999907 $125,000 to $149,9991,669 $150,000 to $199,9998,672 $200,000 or more
Home value of owner - occupied houses in 2022 in Potomac, MD 130 Less than $10,00015 $25,000 to $29,9996 $70,000 to $79,9995 $80,000 to $89,99927 $100,000 to $124,99915 $125,000 to $149,99921 $150,000 to $174,9999 $175,000 to $199,999239 $200,000 to $249,999187 $250,000 to $299,999348 $300,000 to $399,999205 $400,000 to $499,9991,485 $500,000 to $749,9994,267 $750,000 to $999,9994,623 $1,000,000 to $1,499,9992,045 $1,500,000 to $1,999,9991,060 $2,000,000 or moreRent paid by renters in 2022 in Potomac, MD 7 Less than $10019 $100 to $14941 $150 to $19927 $200 to $24929 $250 to $29934 $300 to $3495 $350 to $3996 $400 to $44922 $600 to $6497 $700 to $74936 $800 to $89914 $900 to $999128 $1,000 to $1,249290 $1,250 to $1,499256 $1,500 to $1,999249 $2,000 to $2,499263 $2,500 to $2,999316 $3,000 to $3,499240 $3,500 or more327 No cash rent
Percentage of workers working in this county: 71.3%Number of people working at home: 7,753 (35.4% of all workers )
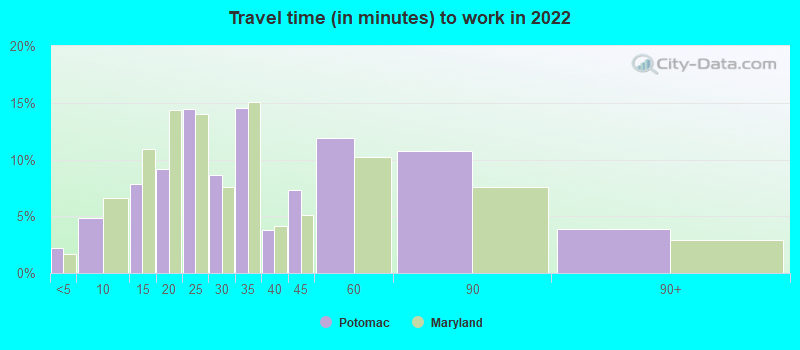
Travel time to work (commute)
Less than 5 minutes: 2855 to 9 minutes: 71210 to 14 minutes: 1,40815 to 19 minutes: 2,04820 to 24 minutes: 2,05625 to 29 minutes: 73130 to 34 minutes: 2,10635 to 39 minutes: 80940 to 44 minutes: 1,11745 to 59 minutes: 1,93460 to 89 minutes: 1,21090 or more minutes: 235
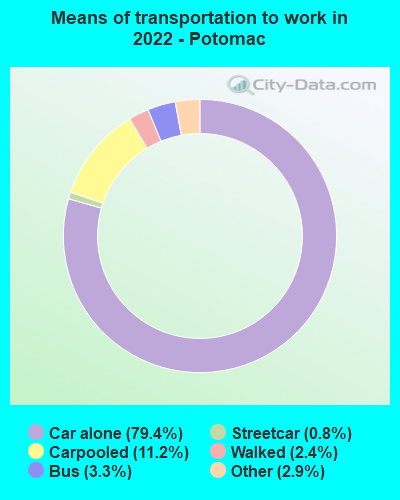
Means of transportation to work:
Drove a car alone: 9,759 (50.3%)Carpooled: 1,470 (7.6%)Bus : 350 (1.8%)Subway or elevated rail : 77 (0.4%)Taxi: 384 (2.0%)Bicycle: 4 (0.0%)Walked: 245 (1.3%)Worked at home: 7,753 (40.0%)
Unemployment by race in 2022
Unemployment rate for White non-Hispanic residents 3.5% Males2.2% FemalesUnemployment rate for Black residents 8.4% Males12.1% FemalesUnemployment rate for Asian residents 1.2% Males1.6% FemalesUnemployment rate for two or more race residents 3.7% MalesUnemployment rate for Hispanic or Latino residents 5.4% Males7.4% Females
Year of entry for the foreign-born population in Potomac, Maryland
3,136 2010 or later 2,500 2000 to 2009 2,819 1990 to 1999 2,518 1980 to 1989 2,262 1970 to 1979 2,524 Before 1970
First ancestries reported:
Iranian: 1,754 (6.3%)
German: 1,671 (6.0%)
American: 1,434 (5.2%)
Irish: 1,083 (3.9%)
European: 866 (3.1%)
Russian: 813 (2.9%)
Eastern European: 784 (2.8%)
English: 702 (2.5%)
Polish: 676 (2.4%)
Italian: 492 (1.8%)
Ukrainian: 379 (1.4%)
African: 374 (1.4%)
French: 323 (1.2%)
Greek: 257 (0.9%)
Romanian: 240 (0.9%)
Belgian: 180 (0.7%)
British: 166 (0.6%)
Brazilian: 142 (0.5%)
Northern European: 141 (0.5%)
Nigerian: 139 (0.5%)
Egyptian: 129 (0.5%)
Sierra Leonean: 102 (0.4%)
Scottish: 100 (0.4%)
Turkish: 98 (0.4%)
Lebanese: 98 (0.4%)
Scotch-Irish: 95 (0.3%)
Moroccan: 78 (0.3%)
Lithuanian: 77 (0.3%)
Ethiopian: 76 (0.3%)
Norwegian: 74 (0.3%)
Portuguese: 70 (0.3%)
Hungarian: 69 (0.2%)
Swedish: 58 (0.2%)
Finnish: 57 (0.2%)
Swiss: 56 (0.2%)
Armenian: 52 (0.2%)
Iraqi: 48 (0.2%)
Kenyan: 44 (0.2%)
Czech: 42 (0.2%)
Bulgarian: 41 (0.1%)
Haitian: 37 (0.1%)
Dutch: 28 (0.1%)
Slovak: 25 (0.09%)
Austrian: 24 (0.09%)
Canadian: 22 (0.08%)
Jamaican: 21 (0.08%)
Slovene: 18 (0.07%)
West Indian: 17 (0.06%)
Barbadian: 14 (0.05%)
Latvian: 13 (0.05%)
Syrian: 12 (0.04%)
Trinidadian and Tobagonian: 11 (0.04%)
U.S. Virgin Islander: 11 (0.04%)
Serbian: 9 (0.03%)
Australian: 8 (0.03%)
Welsh: 8 (0.03%)
French Canadian: 3 (0.01%)
Most common places of birth for foreign-born residents (%): China, excluding Hong Kong and Taiwan Potomac:
17.7% (2,492)Maryland:
4.6% (44,742)
Iran Potomac:
11.5% (1,618)Maryland:
1.3% (12,074)
India Potomac:
9.2% (1,291)Maryland:
6.4% (61,725)
Korea Potomac:
5.7% (802)Maryland:
3.4% (32,635)
Taiwan Potomac:
4.6% (652)Maryland:
0.9% (8,520)
Germany Potomac:
3.2% (450)Maryland:
1.2% (11,265)
Russia Potomac:
2.7% (377)Maryland:
1.0% (9,481)
Colombia Potomac:
2.5% (354)Maryland:
1.3% (12,898)
Brazil Potomac:
2.3% (318)Maryland:
1.2% (11,980)
France Potomac:
2.0% (286)Maryland:
0.4% (4,217)
Bangladesh Potomac:
1.9% (263)Maryland:
0.7% (7,124)
Ukraine Potomac:
1.6% (221)Maryland:
0.7% (6,326)
Place of birth for U.S.-born residents:
This state: 9,196Other state: 21,856Northeast: 6,879Midwest: 2,896South: 10,654West: 1,346 91.3% of Potomac residents lived in the same house 1 years ago.
Out of people who lived in different houses, 38.6% lived in this county.
Out of people who lived in different counties, 14.2% lived in Maryland.
Potomac:
91.3%State average:
88.5%
Education attainment for males 25 years and older:
No schooling: 79Nursery to 4th grade: 95th and 6th grade: 77th and 8th grade: 359th grade: 410th grade: 711th grade: 012th grade, no diploma: 55High school graduate (or equivalency): 371Less than 1 year of college: 120Some college more than 1 year, no degree: 528Associate degree: 309Bachelor's degree: 3,827Master's degree: 4,467Professional school degree: 2,992Doctorate degree: 2,150
Education attainment for females 25 years and older:
No schooling: 173Nursery to 4th grade: 1025th and 6th grade: 337th and 8th grade: 109th grade: 010th grade: 6111th grade: 2712th grade, no diploma: 172High school graduate (or equivalency): 886Less than 1 year of college: 332Some college more than 1 year, no degree: 904Associate degree: 529Bachelor's degree: 6,108Master's degree: 4,784Professional school degree: 1,924Doctorate degree: 1,493
Housing units in structures:
One, detached: 11,927One, attached: 2,476Two: 343 or 4: 905 to 9: 21510 to 19: 12220 to 49: 28950 or more: 1,817Mobile homes: 20Housing units lacking complete plumbing facilities in 2022: 0.0%Housing units lacking complete kitchen facilities in 2022: 0.3%House/condo owner moved in on average 16 years ago
Renter moved in on average 5 years ago
Private vs. public school enrollment:
Students in private schools in grades 1 to 8 (elementary and middle school): 763 Students in private schools in grades 9 to 12 (high school): 930 Students in private undergraduate colleges: 713