Post Falls, ID (Idaho) Houses and Residents
| Post Falls: | $496,116 |
| Idaho: | $432,500 |
Mean price in 2022:
Detached houses: $562,545
Here: $562,545 State: $527,539 Townhouses or other attached units: $302,631
Here: $302,631 State: $416,749 In 5-or-more-unit structures: $644,485
Here: $644,485 State: $590,418 Mobile homes: $98,273
Here: $98,273 State: $150,232
Total population: 29,896 (Urban population: 17,028, Rural population: 0)
Houses: 16,235 (15,382 occupied: 10,436 owner occupied, 4,921 renter occupied)
| % of renters here: | 32% |
| State: | 28% |
Housing density: 1,681 houses/condos per square mile
Median price asked for vacant for-sale houses and condos in 2022: $556,098.
Median contract rent in 2022: $1,313 (lower quartile is $821, upper quartile is $1,797)
Median rent asked for vacant for-rent units in 2022: $2,584
Median gross rent in Post Falls, ID in 2022: $1,436
Housing units in Post Falls with a mortgage: 7,732 (606 second mortgage, 0 home equity loan, 562 both second mortgage and home equity loan)
Houses without a mortgage: 83
Median household income for houses/condos with a mortgage: $96,537
Median household income for apartments without a mortgage: $62,306
Median monthly housing costs: $1,387
Compare current foreclosures in Post Falls, ID:
| Photo | Address | Area | Beds / Baths | Price | Details |
|---|---|---|---|---|---|

|
#1
S Dunbar St
Post Falls, ID 83854
|
1,296 sq. feet
|
2 baths 3 beds |
show details | |

|
#2
W Riverview Dr
Post Falls, ID 83854
|
1,500 sq. feet
|
2 baths 4 beds |
show details | |

|
#3
N Glasgow Dr
Post Falls, ID 83854
|
2,874 sq. feet
|
2 baths 2 beds |
show details | |

|
#4
E Warm Springs Ave
Post Falls, ID 83854
|
1,657 sq. feet
|
3 baths 5 beds |
show details | |

|
#5
W Chicory Ln
Post Falls, ID 83854
|
1,115 sq. feet
|
3 baths 4 beds |
show details | |

|
#6
E Meadow Ln
Post Falls, ID 83854
|
1,232 sq. feet
|
1 baths 3 beds |
show details | |

|
#7
N Post St
Post Falls, ID 83854
|
1,181 sq. feet
|
3 baths 5 beds |
show details | |

|
#8
E Teton Ave
Post Falls, ID 83854
|
952 sq. feet
|
1 baths 3 beds |
show details | |

|
#9
Triumph
Post Falls, ID 83854
|
1,218 sq. feet
|
2 baths 3 beds |
show details | |

|
#10
E Windwood Ct
Post Falls, ID 83854
|
978 sq. feet
|
2 baths 3 beds |
show details |
| Photo | Address | Area | Beds / Baths | Price | Details |
|---|---|---|---|---|---|

|
#11
N Chehalis St
Post Falls, ID 83854
|
1,378 sq. feet
|
2 baths 3 beds |
show details | |

|
#12
W Hauserview Dr
Post Falls, ID 83854
|
1,044 sq. feet
|
2 baths 3 beds |
show details | |

|
#13
N Hauser Lake Rd
Post Falls, ID 83854
|
1,000 sq. feet
|
2 baths 3 beds |
show details | |

|
#14
W Citruswood Dr
Post Falls, ID 83854
|
1,287 sq. feet
|
3 baths 5 beds |
show details | |

|
#15
E Velora Dr
Post Falls, ID 83854
|
1,028 sq. feet
|
2 baths 4 beds |
show details | |

|
#16
E Plaza Dr
Post Falls, ID 83854
|
1,444 sq. feet
|
3 baths 3 beds |
show details | |

|
#17
E Lapis Ave
Post Falls, ID 83854
|
2,828 sq. feet
|
3 baths 5 beds |
show details | |

|
#18
Dallan Dr
Post Falls, ID 83854
|
1,160 sq. feet
|
2 baths 3 beds |
show details | |

|
#19
N Ivy Ln
Post Falls, ID 83854
|
1,271 sq. feet
|
2 baths 3 beds |
show details | |

|
#20
E Shoreline Dr
Post Falls, ID 83854
|
3,240 sq. feet
|
4 baths 5 beds |
show details |
| Photo | Address | Area | Beds / Baths | Price | Details |
|---|---|---|---|---|---|

|
#21
E 10th Ave
Post Falls, ID 83854
|
1,154 sq. feet
|
1 baths 3 beds |
show details | |

|
#22
N Chehalis St
Post Falls, ID 83854
|
1,200 sq. feet
|
2 baths 3 beds |
show details | |

|
#23
S Penny Ln
Post Falls, ID 83854
|
929 sq. feet
|
1 baths 3 beds |
show details | |

|
#24
E 17th Ave
Post Falls, ID 83854
|
1,420 sq. feet
|
2 baths 3 beds |
show details | |

|
#25
N Summer Rose St
Post Falls, ID 83854
|
1,260 sq. feet
|
2 baths 3 beds |
show details | |

|
#26
E Woodland Dr
Post Falls, ID 83854
|
1,434 sq. feet
|
2 baths 5 beds |
show details | |

|
#27
N Arbor Ct
Post Falls, ID 83854
|
1,018 sq. feet
|
1 baths 2 beds |
show details | |

|
#28
E Mossberg Cir
Post Falls, ID 83854
|
1,195 sq. feet
|
3 baths 3 beds |
show details | |

|
#29
E Plaza Dr
Post Falls, ID 83854
|
1,232 sq. feet
|
3 baths 4 beds |
show details | |

|
#30
E 3rd Ave
Post Falls, ID 83854
|
1,164 sq. feet
|
2 baths 3 beds |
show details |
| Photo | Address | Area | Beds / Baths | Price | Details |
|---|---|---|---|---|---|

|
#31
N Cliff House Rd
Post Falls, ID 83854
|
1,186 sq. feet
|
2 baths 3 beds |
show details | |

|
#32
N Tucson St
Post Falls, ID 83854
|
- sq. feet
|
- baths - beds |
show details | |

|
#33
W Expo Pkwy, Apt 102
Post Falls, ID 83854
|
- sq. feet
|
- baths - beds |
show details | |

|
#34
E Poleline Ave # 204
Post Falls, ID 83854
|
- sq. feet
|
- baths - beds |
show details | |

|
#35
N Garden Plz Apt 163
Post Falls, ID 83854
|
- sq. feet
|
- baths - beds |
show details | |

|
#36
N Candlewood Ln
Post Falls, ID 83854
|
- sq. feet
|
- baths - beds |
show details | |

|
#37
N Cecil Rd, Apt 141
Post Falls, ID 83854
|
- sq. feet
|
- baths - beds |
show details | |

|
#38
N Garden Plz Apt 265
Post Falls, ID 83854
|
- sq. feet
|
- baths - beds |
show details | |

|
#39
N Frederick St
Post Falls, ID 83854
|
- sq. feet
|
- baths - beds |
show details | |

|
#40
E 2nd Ave Apt A
Post Falls, ID 83854
|
- sq. feet
|
- baths - beds |
show details |
| Photo | Address | Area | Beds / Baths | Price | Details |
|---|---|---|---|---|---|

|
#41
N Spokane St Apt B
Post Falls, ID 83854
|
- sq. feet
|
- baths - beds |
show details | |

|
#42
N Greensferry Rd Unit 3247
Post Falls, ID 83877
|
- sq. feet
|
- baths - beds |
show details | |

|
#43
W Hayden Ave
Post Falls, ID 83854
|
- sq. feet
|
- baths - beds |
show details | |

|
#44
E Cinder Ave
Post Falls, ID 83854
|
- sq. feet
|
- baths - beds |
show details | |

|
#45
Crown Pt
Post Falls, ID 83854
|
- sq. feet
|
- baths - beds |
show details | |

|
#46
E Knapp Cir
Post Falls, ID 83854
|
- sq. feet
|
- baths - beds |
show details | |

|
#47
W Staples Rd
Post Falls, ID 83854
|
- sq. feet
|
- baths - beds |
show details | |

|
#48
N Spokane St Apt A
Post Falls, ID 83854
|
- sq. feet
|
- baths - beds |
show details | |

|
#49
W Santiago Cir
Post Falls, ID 83854
|
- sq. feet
|
- baths - beds |
show details | |

|
Check over 1 million property listings on Foreclosure.com!
|
browse all offers | |||


Median year apartment built: 2008
Household type by relationship:
Households: 42,350- Male householders: 6,890 (1,357 living alone), Female householders: 8,387 (2,477 living alone)
7,821 spouses (7,727 opposite-sex spouses), 1,286 unmarried partners, (1,286 opposite-sex unmarried partners), 12,903 children (11,955 natural, 244 adopted, 704 stepchildren), 906 grandchildren, 920 brothers or sisters, 423 parents, 0 foster children, 654 other relatives, 1,797 non-relatives
- In group quarters: 359
Size of family households: 4,067 2-persons, 2,032 3-persons, 2,393 4-persons, 963 5-persons, 541 6-persons, 268 7-or-more-persons.
Size of nonfamily households: 4,190 1-person, 673 2-persons, 230 3-persons, 37 4-persons, 3 6-persons, 28 7-or-more-persons.
7,555 married couples with children.
2,842 single-parent households (689 men, 2,153 women).
96.6% of residents of Post Falls speak English at home.
1.8% of residents speak Spanish at home (81% speak English very well, 12% speak English well, 7% speak English not well).
0.7% of residents speak other Indo-European language at home (63% speak English very well, 11% speak English well, 26% speak English not well).
0.2% of residents speak Asian or Pacific Island language at home (66% speak English very well, 34% speak English well).
0.5% of residents speak other language at home (79% speak English very well, 21% speak English well).
Foreign born population: 519 (1.2%)
(67.4% of them are naturalized citizens)
| Here: | 6.2 |
| State: | 6.5 |
| Here: | 4.9 |
| State: | 4.4 |

- Bedrooms in owner-occupied houses and condos in Post Falls, Idaho
- 21no bedroom
- 1061 bedroom
- 1,0432 bedrooms
- 5,9323 bedrooms
- 2,6364 bedrooms
- 6975+ bedrooms

- Bedrooms in renter-occupied apartments in Post Falls, Idaho
- 101no bedroom
- 8351 bedroom
- 1,7362 bedrooms
- 1,7743 bedrooms
- 4484 bedrooms
- 275+ bedrooms

- Cars and other vehicles available in Post Falls in owner-occupied houses/condos
- 424no vehicle
- 1,7701 vehicle
- 4,8172 vehicles
- 2,5713 vehicles
- 6094 vehicles
- 2465+ vehicles

- Cars and other vehicles available in Post Falls in renter-occupied apartments
- 322no vehicle
- 2,2621 vehicle
- 1,6952 vehicles
- 4993 vehicles
- 1434 vehicles
- 05+ vehicles

- Rooms in owner-occupied houses in Post Falls, Idaho
- 01 room
- 722 rooms
- 1993 rooms
- 1,4354 rooms
- 2,0725 rooms
- 2,0376 rooms
- 1,7317 rooms
- 1,5788 rooms
- 1,3129+ rooms

- Rooms in renter-occupied apartments in Post Falls, Idaho
- 1011 room
- 902 rooms
- 8073 rooms
- 1,2554 rooms
- 1,1755 rooms
- 7036 rooms
- 5407 rooms
- 1098 rooms
- 1429+ rooms


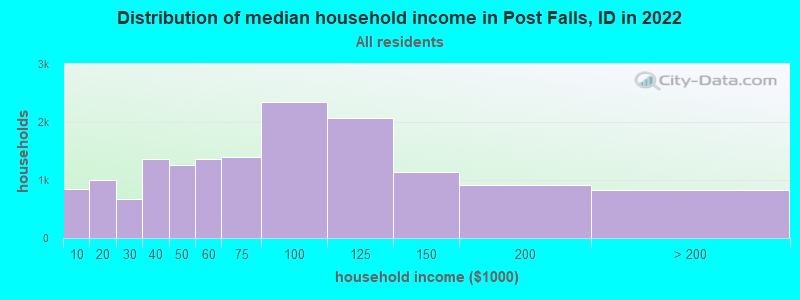
Post Falls, ID household income distribution

- 849Less than $10,000
- 1,001$10,000 to $19,999
- 677$20,000 to $29,999
- 1,355$30,000 to $39,999
- 1,253$40,000 to $49,999
- 1,369$50,000 to $59,999
- 1,394$60,000 to $74,999
- 2,338$75,000 to $99,999
- 2,071$100,000 to $124,999
- 1,130$125,000 to $149,999
- 912$150,000 to $199,999
- 825$200,000 or more
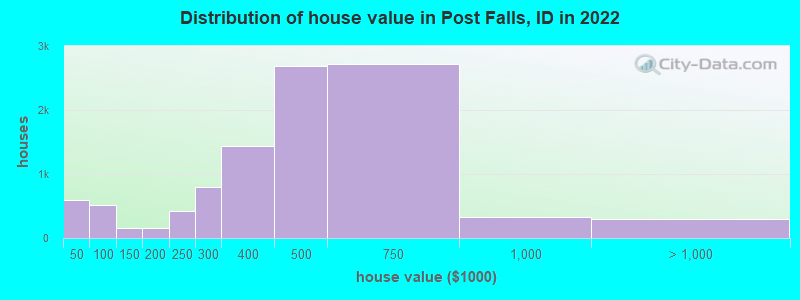
Home value of owner - occupied houses in 2022 in Post Falls, ID
-
- 78Less than $10,000
- 53$10,000 to $14,999
- 12$15,000 to $19,999
- 59$20,000 to $24,999
- 13$25,000 to $29,999
- 30$30,000 to $34,999
- 86$35,000 to $39,999
- 265$40,000 to $49,999
- 23$50,000 to $59,999
- 69$60,000 to $69,999
- 36$70,000 to $79,999
- 34$80,000 to $89,999
- 91$90,000 to $99,999
- 12$100,000 to $124,999
- 146$125,000 to $149,999
- 19$150,000 to $174,999
- 135$175,000 to $199,999
- 428$200,000 to $249,999
- 802$250,000 to $299,999
- 1,432$300,000 to $399,999
- 2,686$400,000 to $499,999
- 2,720$500,000 to $749,999
- 321$750,000 to $999,999
- 92$1,000,000 to $1,499,999
- 22$1,500,000 to $1,999,999
- 177$2,000,000 or more
Rent paid by renters in 2022 in Post Falls, ID
-
- 15$150 to $199
- 80$200 to $249
- 19$250 to $299
- 271$300 to $349
- 38$350 to $399
- 41$400 to $449
- 106$450 to $499
- 107$500 to $549
- 279$550 to $599
- 41$600 to $649
- 71$650 to $699
- 57$700 to $749
- 214$750 to $799
- 239$800 to $899
- 292$900 to $999
- 756$1,000 to $1,249
- 714$1,250 to $1,499
- 1,153$1,500 to $1,999
- 172$2,000 to $2,499
- 159$2,500 to $2,999
- 64$3,000 to $3,499
- 55$3,500 or more
- 348No cash rent


Percentage of workers working in this county: 73.0%
Number of people working at home: 2,460 (12.9% of all workers)
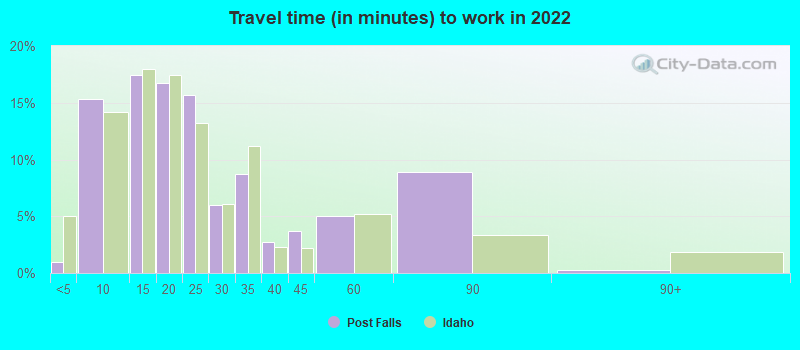
Travel time to work (commute)
- Less than 5 minutes: 76
- 5 to 9 minutes: 2,217
- 10 to 14 minutes: 1,981
- 15 to 19 minutes: 3,434
- 20 to 24 minutes: 3,246
- 25 to 29 minutes: 1,705
- 30 to 34 minutes: 1,706
- 35 to 39 minutes: 482
- 40 to 44 minutes: 339
- 45 to 59 minutes: 672
- 60 to 89 minutes: 455
- 90 or more minutes: 226
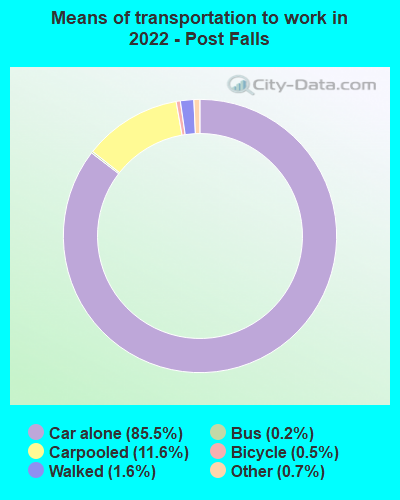
Means of transportation to work:
- Drove a car alone: 10,589 (70.5%)
- Carpooled: 1,409 (9.4%)
- Bus: 26 (0.2%)
- Taxi: 200 (1.3%)
- Bicycle: 79 (0.5%)
- Walked: 189 (1.3%)
- Worked at home: 2,460 (16.4%)

- Unemployment by race in 2022
- Unemployment rate for White non-Hispanic residents
- 2.8%Males
- 2.9%Females
- Unemployment rate for other race residents
- 6.9%Males
- Unemployment rate for two or more race residents
- 12.0%Males
- 2.3%Females
- Unemployment rate for Hispanic or Latino residents
- 1.0%Males
- 7.1%Females

- Year of entry for the foreign-born population in Post Falls, Idaho
- 1052010 or later
- 792000 to 2009
- 1181990 to 1999
- 1061980 to 1989
- 431970 to 1979
- 145Before 1970
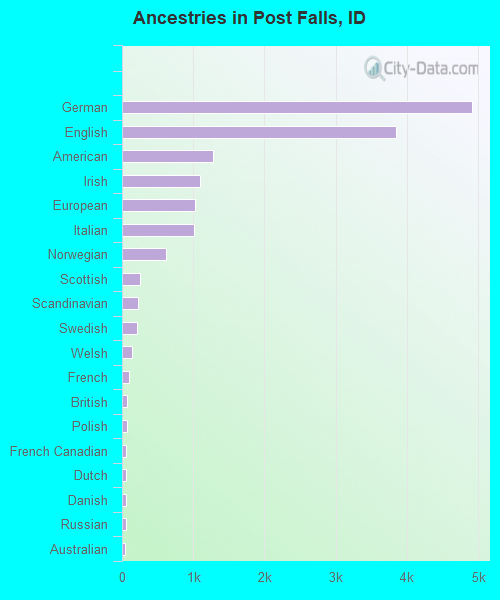
First ancestries reported:
- German: 4,909 (26.8%)
- English: 3,847 (21.0%)
- American: 1,277 (7.0%)
- Irish: 1,099 (6.0%)
- European: 1,027 (5.6%)
- Italian: 1,013 (5.5%)
- Norwegian: 616 (3.4%)
- Scottish: 247 (1.3%)
- Scandinavian: 227 (1.2%)
- Swedish: 217 (1.2%)
- Welsh: 143 (0.8%)
- French: 101 (0.6%)
- British: 76 (0.4%)
- Polish: 74 (0.4%)
- French Canadian: 63 (0.3%)
- Dutch: 61 (0.3%)
- Danish: 60 (0.3%)
- Russian: 56 (0.3%)
- Australian: 46 (0.3%)
- Bulgarian: 44 (0.2%)
- Lebanese: 42 (0.2%)
- Canadian: 40 (0.2%)
- Swiss: 38 (0.2%)
- Brazilian: 30 (0.2%)
- Greek: 30 (0.2%)
- Portuguese: 29 (0.2%)
- Belgian: 28 (0.2%)
- Finnish: 25 (0.1%)
- Slavic: 18 (0.10%)
- Czech: 17 (0.09%)
- Scotch-Irish: 16 (0.09%)
- Czechoslovakian: 16 (0.09%)
- Ukrainian: 14 (0.08%)
- Maltese: 12 (0.07%)
- Northern European: 11 (0.06%)
- Lithuanian: 10 (0.05%)
Most common places of birth for foreign-born residents (%):
| Post Falls: | 18.2% (97) |
| Idaho: | 5.2% (5,503) |
| Post Falls: | 9.6% (51) |
| Idaho: | 49.9% (53,107) |
| Post Falls: | 7.7% (41) |
| Idaho: | 2.4% (2,535) |
| Post Falls: | 7.5% (40) |
| Idaho: | 0.1% (142) |
| Post Falls: | 6.9% (37) |
| Idaho: | 0.7% (771) |
| Post Falls: | 6.6% (35) |
| Idaho: | 0.0% (31) |
| Post Falls: | 5.8% (31) |
| Idaho: | 0.8% (816) |
| Post Falls: | 5.4% (29) |
| Idaho: | 0.0% (50) |
| Post Falls: | 5.3% (28) |
| Idaho: | 1.2% (1,274) |
| Post Falls: | 4.9% (26) |
| Idaho: | 0.4% (434) |
| Post Falls: | 4.5% (24) |
| Idaho: | 2.1% (2,230) |
| Post Falls: | 3.4% (18) |
| Idaho: | 1.5% (1,595) |
| Post Falls: | 2.8% (15) |
| Idaho: | 0.1% (82) |
| Post Falls: | 2.6% (14) |
| Idaho: | 0.3% (314) |
| Post Falls: | 2.3% (12) |
| Idaho: | 0.1% (96) |
| Post Falls: | 2.1% (11) |
| Idaho: | 0.4% (474) |
Place of birth for U.S.-born residents:
- This state: 12,838
- Other state: 28,661
- Northeast: 1,023
- Midwest: 2,471
- South: 1,885
- West: 23,460
86.9% of Post Falls residents lived in the same house 1 years ago.
Out of people who lived in different houses, 36.1% lived in this county.
Out of people who lived in different counties, 20.4% lived in Idaho.
| Post Falls: | 86.9% |
| State average: | 85.1% |
Education attainment for males 25 years and older:
- No schooling: 19
- Nursery to 4th grade: 10
- 5th and 6th grade: 42
- 7th and 8th grade: 44
- 9th grade: 101
- 10th grade: 100
- 11th grade: 235
- 12th grade, no diploma: 203
- High school graduate (or equivalency): 4,132
- Less than 1 year of college: 1,171
- Some college more than 1 year, no degree: 2,522
- Associate degree: 1,730
- Bachelor's degree: 2,410
- Master's degree: 520
- Professional school degree: 61
- Doctorate degree: 76

Education attainment for females 25 years and older:
- No schooling: 196
- Nursery to 4th grade: 42
- 5th and 6th grade: 0
- 7th and 8th grade: 99
- 9th grade: 0
- 10th grade: 217
- 11th grade: 135
- 12th grade, no diploma: 296
- High school graduate (or equivalency): 3,989
- Less than 1 year of college: 1,370
- Some college more than 1 year, no degree: 2,884
- Associate degree: 1,320
- Bachelor's degree: 3,025
- Master's degree: 606
- Professional school degree: 106
- Doctorate degree: 78


Housing units in structures:
- One, detached: 11,281
- One, attached: 338
- Two: 529
- 3 or 4: 737
- 5 to 9: 646
- 10 to 19: 637
- 20 to 49: 475
- 50 or more: 470
- Mobile homes: 1,118
Median worth of mobile homes: $107,253
Housing units lacking complete kitchen facilities in 2022: 2.1%
House/condo owner moved in on average 7 years ago
Renter moved in on average 3 years ago

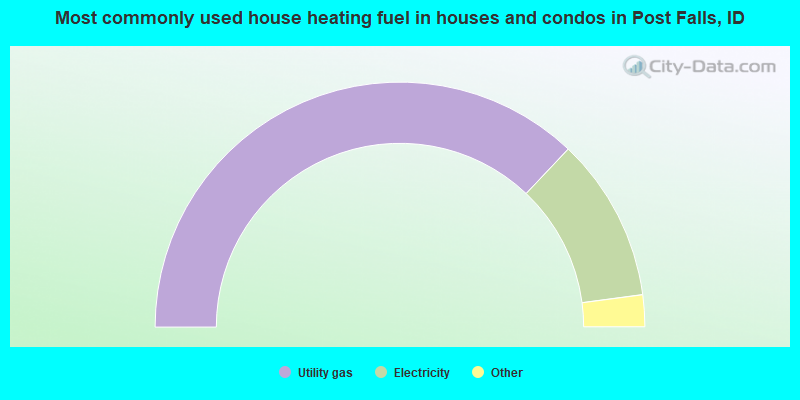
- 74.2%Utility gas
- 21.7%Electricity
- 2.8%Wood
- 0.9%Bottled, tank, or LP gas
- 0.5%Other fuel
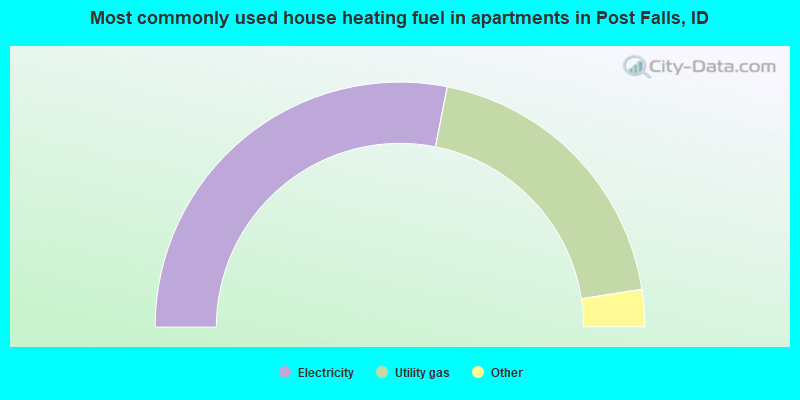
- 56.2%Electricity
- 38.9%Utility gas
- 2.3%Bottled, tank, or LP gas
- 1.5%No fuel used
- 1.0%Solar energy
Private vs. public school enrollment:
| Here: | 40.8% |
| Idaho: | 13.5% |
| Here: | 13.0% |
| Idaho: | 8.5% |
| Here: | 20.4% |
| Idaho: | 30.0% |


