Port Angeles, WA (Washington) Houses and Residents
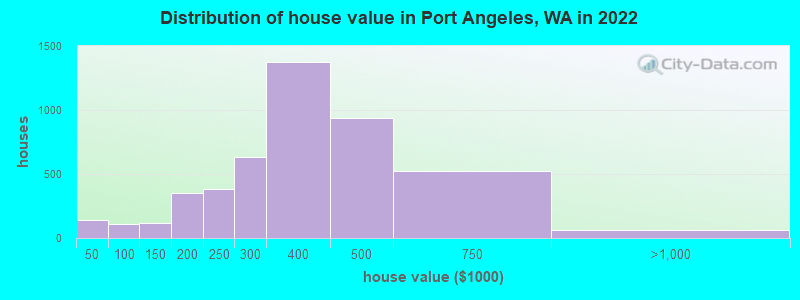
Estimated median house or condo value in 2022: $358,443 (it was $110,200 in 2000 )
Port Angeles:
$358,443Washington:
$569,500
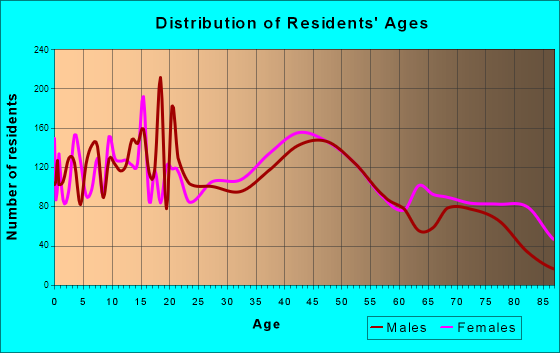
Lower value quartile - upper value quartile: $293,192 - $497,993Total population: 19,256 (Urban population: 18,316 (all inside urban clusters), Rural population: 156 (all nonfarm) )
Houses: 10,092 (9,235 occupied: 5,263 owner occupied, 4,196 renter occupied )
% of renters here:
44%State:
36%
Housing density: 1,000 houses/condos per square mile
Median price asked for vacant for-sale houses and condos in 2022: $352,685.
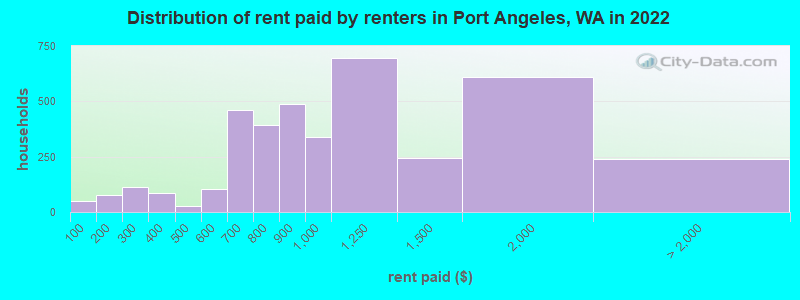
Median contract rent in 2022: $956 (lower quartile is $718, upper quartile is $1,201)
Median rent asked for vacant for-rent units in 2022: $1,435
Median gross rent in Port Angeles, WA in 2022: $1,081
Housing units in Port Angeles with a mortgage: 3,285 (232 second mortgage, 0 home equity loan, 234 both second mortgage and home equity loan )Houses without a mortgage: 55
Median household income for houses/condos with a mortgage: $75,054
Median household income for apartments without a mortgage: $78,817
Median monthly housing costs: $1,119
Data:
Median house or condo value ($)
Median house or condo value ($ change since 2000)
Median house or condo value ($) - White
Median house or condo value ($) - Black or African American
Median house or condo value ($) - Asian
Median house or condo value ($) - Hispanic or Latino
Median house or condo value ($) - American Indian and Alaska Native
Median house or condo value ($) - Multirace
Median house or condo value ($) - Other Race
Median price asked for mobile homes ($)
Household density (households per square mile)
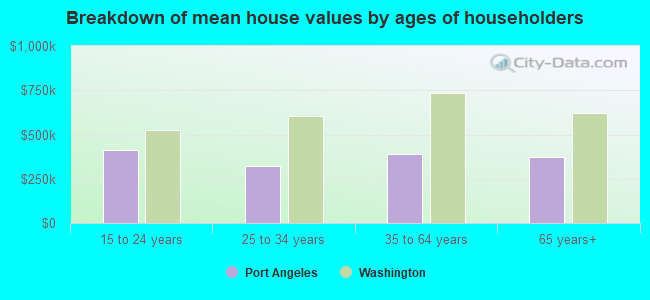
Mean house or condo value by units in structure - 1, detached ($)
Mean house or condo value by units in structure - 1, attached ($)
Mean house or condo value by units in structure - 2 ($)
Mean house or condo value by units in structure by units in structure - 3 or 4 ($)
Mean house or condo value by units in structure - 5 or more ($)
Mean house or condo value by units in structure - Boat, RV, van, etc. ($)
Mean house or condo value by units in structure - Mobile home ($)
Median contract rent ($)
Median contract rent - Lower quartile ($)
Median contract rent - Upper quartile ($)
Median gross rent ($)
Urban houses (%)
Rural houses (%)
Houses occupied (%)
Houses occupied (% change since 2000)
Houses owner occupied (%)
Houses owner occupied (% change since 2000)
Houses renter occupied (%)
Houses renter occupied (% change since 2000)
Vacant housing units - For rent (%)
Vacant housing units - For rent (% change since 2000)
Vacant housing units - For sale only (%)
Vacant housing units - For sale only (% change since 2000)
Vacant housing units - Rented or sold, not occupied (%)
Vacant housing units - Rented or sold, not occupied (% change since 2000)
Vacant housing units - For seasonal, recreational, or occasional use (%)
Vacant housing units - For seasonal, recreational, or occasional use (% change since 2000)
Vacant housing units - For migrant workers (%)
Vacant housing units - For migrant workers (% change since 2000)
Vacant housing units - Other vacant (%)
Vacant housing units - Other vacant (% change since 2000)
Median monthly housing costs ($)
Median household income for houses/condos with a mortgage ($)
Median household income for houses/condos without a mortgage ($)
Median household income ($)
Median household income ($) - White
Median household income ($) - Black or African American
Median household income ($) - Asian
Median household income ($) - Hispanic or Latino
Median household income ($) - American Indian and Alaska Native
Median household income ($) - Multirace
Median household income ($) - Other Race
Mortgage status - with mortgage (%)
Mortgage status - with second mortgage (%)
Mortgage status - with home equity loan (%)
Mortgage status - with both second mortgage and home equity loan (%)
Mortgage status - without a mortgage (%)
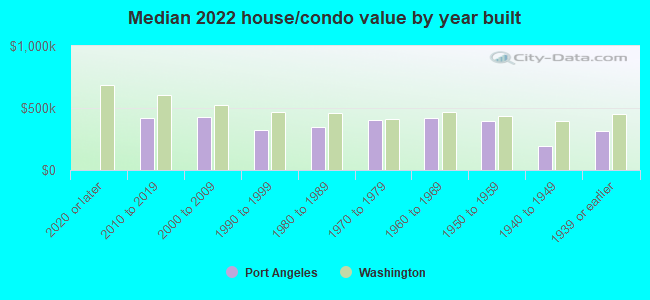
Median year house/condo built
Median year apartment built
Household type by relationship - Male householder living alone (%)
Household type by relationship - Male householder not living alone (%)
Household type by relationship - Female householder living alone (%)
Household type by relationship - Female householder not living alone (%)
Household type by relationship - Opposite-Sex spouse (%)
Household type by relationship - Same-Sex spouse (%)
Household type by relationship - Opposite-Sex unmarried partner (%)
Household type by relationship - Same-Sex unmarried partner (%)
Household type by relationship - In group quarters (%)
Size of family households - 2-person household (%)
Size of family households - 3-person household (%)
Size of family households - 4-person household (%)
Size of family households - 5-person household (%)
Size of family households - 6-person household (%)
Size of family households - 7-or-more-person household (%)
Size of nonfamily households - 1-person household (%)
Size of nonfamily households - 2-person household (%)
Size of nonfamily households - 3-person household (%)
Size of nonfamily households - 4-person household (%)
Size of nonfamily households - 5-person household (%)
Size of nonfamily households - 6-person household (%)
Size of nonfamily households - 7-or-moreperson household (%)
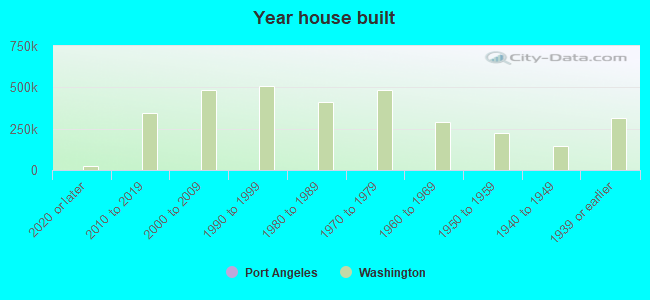
Year house built - Built 2010 or later (%)
Year house built - Built 2000 to 2009 (%)
Year house built - Built 1990 to 1999 (%)
Year house built - Built 1980 to 1989 (%)
Year house built - Built 1970 to 1979 (%)
Year house built - Built 1960 to 1969 (%)
Year house built - Built 1950 to 1959 (%)
Year house built - Built 1940 to 1949 (%)
Year house built - Built 1939 or earlier (%)
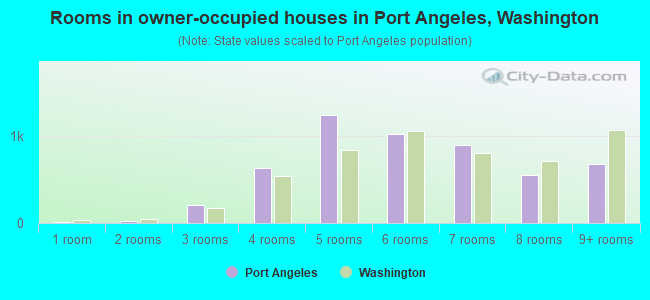
Median number of rooms in houses and condos
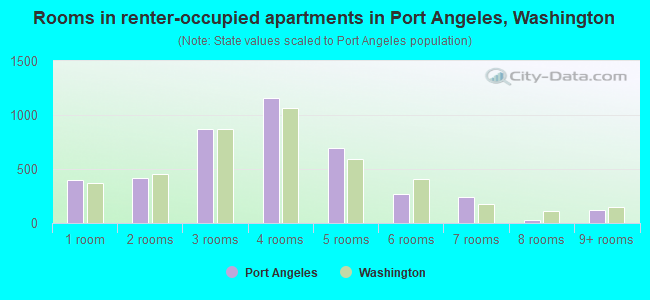
Median number of rooms in apartments
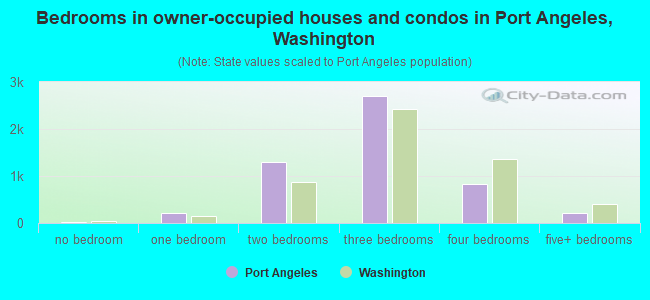
Median number of bedrooms in owner occupied houses
Mean number of bedrooms in owner occupied houses
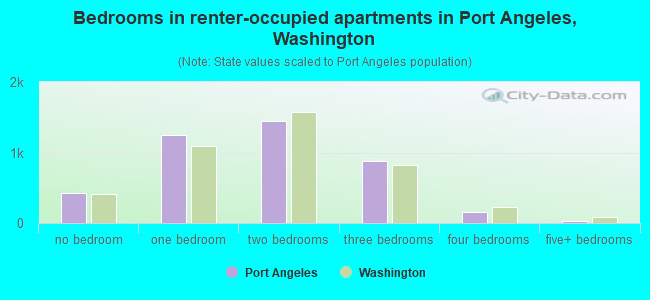
Median number of bedrooms in renter occupied houses
Mean number of bedrooms in renter occupied houses
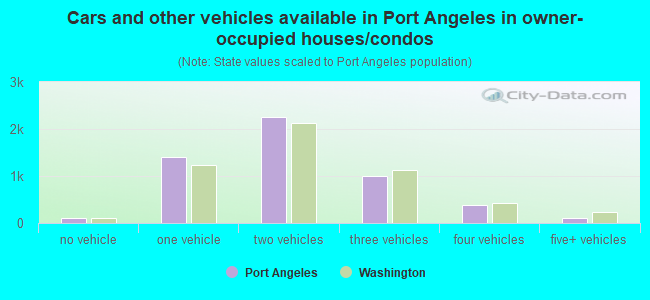
Median number of vehichles in owner occupied houses
Mean number of vehichles in owner occupied houses
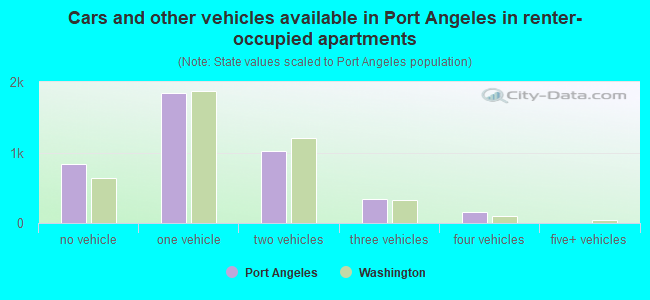
Median number of vehichles in renter occupied houses
Mean number of vehichles in renter occupied houses
Rooms in owner-occupied houses - 1 room (%)
Rooms in owner-occupied houses - 2 rooms (%)
Rooms in owner-occupied houses - 3 rooms (%)
Rooms in owner-occupied houses - 4 rooms (%)
Rooms in owner-occupied houses - 5 rooms (%)
Rooms in owner-occupied houses - 6 rooms (%)
Rooms in owner-occupied houses - 7 rooms (%)
Rooms in owner-occupied houses - 8 rooms (%)
Rooms in owner-occupied houses - 9+ rooms (%)
Rooms in renter-occupied houses - 1 room (%)
Rooms in renter-occupied houses - 2 rooms (%)
Rooms in renter-occupied houses - 3 rooms (%)
Rooms in renter-occupied houses - 4 rooms (%)
Rooms in renter-occupied houses - 5 rooms (%)
Rooms in renter-occupied houses - 6 rooms (%)
Rooms in renter-occupied houses - 7 rooms (%)
Rooms in renter-occupied houses - 8 rooms (%)
Rooms in renter-occupied houses - 9+ rooms (%)
Bedrooms in owner-occupied houses - no bedrooms (%)
Bedrooms in owner-occupied houses - 1 bedroom (%)
Bedrooms in owner-occupied houses - 2 bedrooms (%)
Bedrooms in owner-occupied houses - 3 bedrooms (%)
Bedrooms in owner-occupied houses - 4 bedrooms (%)
Bedrooms in owner-occupied houses - 5+ bedrooms (%)
Bedrooms in renter-occupied houses - no bedrooms (%)
Bedrooms in renter-occupied houses - 1 bedroom (%)
Bedrooms in renter-occupied houses - 2 bedrooms (%)
Bedrooms in renter-occupied houses - 3 bedrooms (%)
Bedrooms in renter-occupied houses - 4 bedrooms (%)
Bedrooms in renter-occupied houses - 5+ bedrooms (%)
Vehicles available in owner-occupied houses - no vehicle available (%)
Vehicles available in owner-occupied houses - 1 vehicle available(%)
Vehicles available in owner-occupied houses - 2 Vehicles available (%)
Vehicles available in owner-occupied houses - 3 Vehicles available (%)
Vehicles available in owner-occupied houses - 4 Vehicles available (%)
Vehicles available in owner-occupied houses - 5+ Vehicles available (%)
Vehicles available in renter-occupied houses - no vehicle available (%)
Vehicles available in renter-occupied houses - 1 vehicle available (%)
Vehicles available in renter-occupied houses - 2 Vehicles available (%)
Vehicles available in renter-occupied houses - 3 Vehicles available (%)
Vehicles available in renter-occupied houses - 4 Vehicles available (%)
Vehicles available in renter-occupied houses - 5+ Vehicles available (%)
Housing units in structures - 1, detached (%)
Housing units in structures - 1, attached (%)
Housing units in structures - 2 (%)
Housing units in structures - 3 or 4 (%)
Housing units in structures - 5 to 9 (%)
Housing units in structures - 10 to 19 (%)
Housing units in structures - 20 to 49 (%)
Housing units in structures - 50 or more (%)
Housing units in structures - Mobile home (%)
Housing units in structures - Boat, RV, van, etc. (%)
Housing units in structures - Owners - 1, detached (%)
Housing units in structures - Owners - 1, attached (%)
Housing units in structures - Owners - 2 (%)
Housing units in structures - Owners - 3 or 4 (%)
Housing units in structures - Owners - 5 to 9 (%)
Housing units in structures - Owners - 10 to 19 (%)
Housing units in structures - Owners - 20 to 49 (%)
Housing units in structures - Owners - 50 or more (%)
Housing units in structures - Owners - Mobile home (%)
Housing units in structures - Owners - Boat, RV, van, etc. (%)
Housing units in structures - Renters - 1, detached (%)
Housing units in structures - Renters - 1, attached (%)
Housing units in structures - Renters - 2 (%)
Housing units in structures - Renters - 3 or 4 (%)
Housing units in structures - Renters - 5 to 9 (%)
Housing units in structures - Renters - 10 to 19 (%)
Housing units in structures - Renters - 20 to 49 (%)
Housing units in structures - Renters - 50 or more (%)
Housing units in structures - Renters - Mobile home (%)
Housing units in structures - Renters - Boat, RV, van, etc. (%)
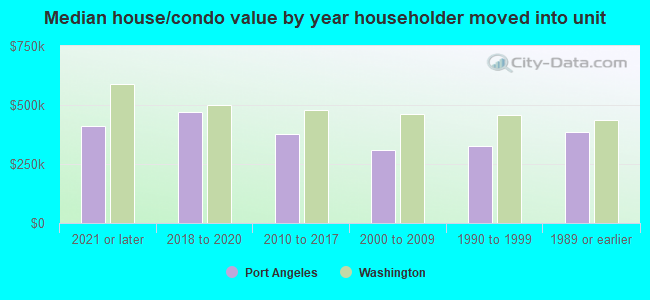
House/condo owner moved in on average (years ago)
Renter moved in on average (years ago)
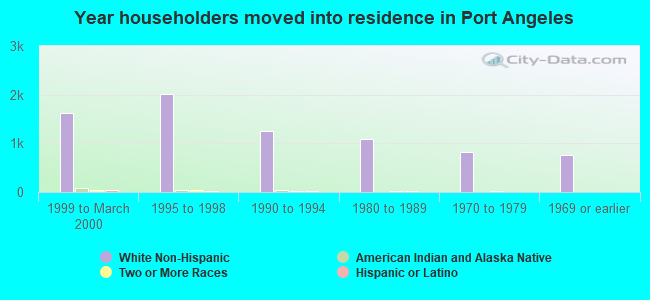
Year householder moved into unit - Moved in 1999 to March 2000 (%)
Year householder moved into unit - Moved in 1999 to March 2000 (%) - White
Year householder moved into unit - Moved in 1999 to March 2000 (%) - Black or African American
Year householder moved into unit - Moved in 1999 to March 2000 (%) - Asian
Year householder moved into unit - Moved in 1999 to March 2000 (%) - Hispanic or Latino
Year householder moved into unit - Moved in 1999 to March 2000 (%) - American Indian and Alaska Native
Year householder moved into unit - Moved in 1999 to March 2000 (%) - Multirace
Year householder moved into unit - Moved in 1999 to March 2000 (%) - Other Race
Year householder moved into unit - Moved in 1995 to 1998 (%)
Year householder moved into unit - Moved in 1995 to 1998 (%) - White
Year householder moved into unit - Moved in 1995 to 1998 (%) - Black or African American
Year householder moved into unit - Moved in 1995 to 1998 (%) - Asian
Year householder moved into unit - Moved in 1995 to 1998 (%) - Hispanic or Latino
Year householder moved into unit - Moved in 1995 to 1998 (%) - American Indian and Alaska Native
Year householder moved into unit - Moved in 1995 to 1998 (%) - Multirace
Year householder moved into unit - Moved in 1995 to 1998 (%) - Other Race
Year householder moved into unit - Moved in 1990 to 1994 (%)
Year householder moved into unit - Moved in 1990 to 1994 (%) - White
Year householder moved into unit - Moved in 1990 to 1994 (%) - Black or African American
Year householder moved into unit - Moved in 1990 to 1994 (%) - Asian
Year householder moved into unit - Moved in 1990 to 1994 (%) - Hispanic or Latino
Year householder moved into unit - Moved in 1990 to 1994 (%) - American Indian and Alaska Native
Year householder moved into unit - Moved in 1990 to 1994 (%) - Multirace
Year householder moved into unit - Moved in 1990 to 1994 (%) - Other Race
Year householder moved into unit - Moved in 1980 to 1989 (%)
Year householder moved into unit - Moved in 1980 to 1989 (%) - White
Year householder moved into unit - Moved in 1980 to 1989 (%) - Black or African American
Year householder moved into unit - Moved in 1980 to 1989 (%) - Asian
Year householder moved into unit - Moved in 1980 to 1989 (%) - Hispanic or Latino
Year householder moved into unit - Moved in 1980 to 1989 (%) - American Indian and Alaska Native
Year householder moved into unit - Moved in 1980 to 1989 (%) - Multirace
Year householder moved into unit - Moved in 1980 to 1989 (%) - Other Race
Year householder moved into unit - Moved in 1970 to 1979 (%)
Year householder moved into unit - Moved in 1970 to 1979 (%) - White
Year householder moved into unit - Moved in 1970 to 1979 (%) - Black or African American
Year householder moved into unit - Moved in 1970 to 1979 (%) - Asian
Year householder moved into unit - Moved in 1970 to 1979 (%) - Hispanic or Latino
Year householder moved into unit - Moved in 1970 to 1979 (%) - American Indian and Alaska Native
Year householder moved into unit - Moved in 1970 to 1979 (%) - Multirace
Year householder moved into unit - Moved in 1970 to 1979 (%) - Other Race
Year householder moved into unit - Moved in 1969 or earlier (%)
Year householder moved into unit - Moved in 1969 or earlier (%) - White
Year householder moved into unit - Moved in 1969 or earlier (%) - Black or African American
Year householder moved into unit - Moved in 1969 or earlier (%) - Asian
Year householder moved into unit - Moved in 1969 or earlier (%) - Hispanic or Latino
Year householder moved into unit - Moved in 1969 or earlier (%) - American Indian and Alaska Native
Year householder moved into unit - Moved in 1969 or earlier (%) - Multirace
Year householder moved into unit - Moved in 1969 or earlier (%) - Other Race
Housing units lacking complete plumbing facilities (%)
Housing units lacking complete kitchen facilities (%)
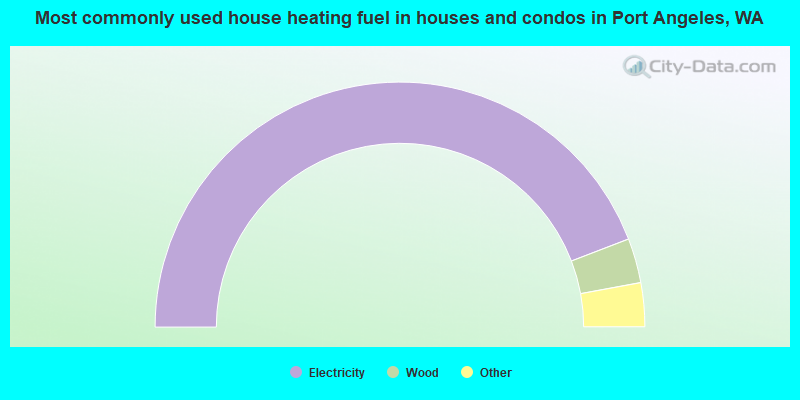
House heating fuel used in houses and condos - Utility gas (%)
House heating fuel used in houses and condos - Bottled, tank, or LP gas (%)
House heating fuel used in houses and condos - Electricity (%)
House heating fuel used in houses and condos - Fuel oil, kerosene, etc. (%)
House heating fuel used in houses and condos - Coal or coke (%)
House heating fuel used in houses and condos - Wood (%)
House heating fuel used in houses and condos - Solar energy (%)
House heating fuel used in houses and condos - Other fuel (%)
House heating fuel used in houses and condos - No fuel used (%)
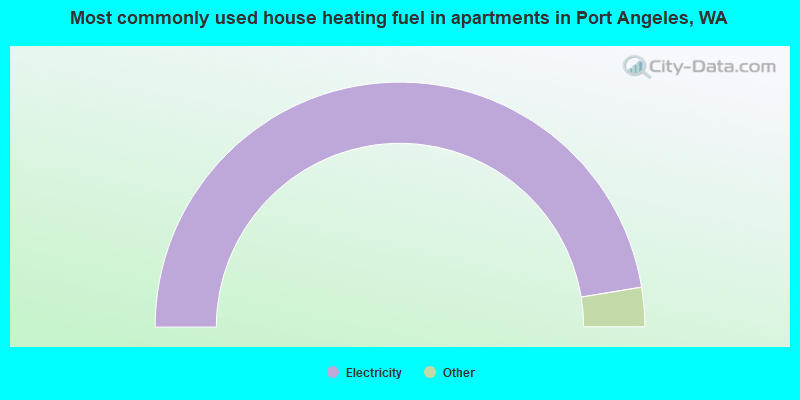
House heating fuel used in apartments - Utility gas (%)
House heating fuel used in apartments - Bottled, tank, or LP gas (%)
House heating fuel used in apartments - Electricity (%)
House heating fuel used in apartments - Fuel oil, kerosene, etc. (%)
House heating fuel used in apartments - Coal or coke (%)
House heating fuel used in apartments - Wood (%)
House heating fuel used in apartments - Solar energy (%)
House heating fuel used in apartments - Other fuel (%)
House heating fuel used in apartments - No fuel used (%)
Median year house/condo built: 1968Median year apartment built: 1971Household type by relationship:
Households: 20,129
Male householders: 4,066 (1,634 living alone ), Female householders: 5,075 (1,941 living alone )3,531 spouses (3,466 opposite-sex spouses ), 803 unmarried partners , (774 opposite-sex unmarried partners ), 4,743 children (4,282 natural , 200 adopted , 260 stepchildren ), 235 grandchildren , 260 brothers or sisters , 63 parents , 8 foster children , 149 other relatives , 698 non-relatives In group quarters: 491
Size of family households: 2,684 2-persons , 1,006 3-persons , 607 4-persons , 276 5-persons , 116 6-persons , 62 7-or-more-persons .
Size of nonfamily households: 3,872 1-person , 772 2-persons , 40 3-persons , 9 4-persons , 9 5-persons .
2,230 married couples with children. single-parent households (493 men , 677 women ).
93.0% of residents of Port Angeles speak English at home. of residents speak Spanish at home (61% speak English very well , 25% speak English well , 4% speak English not well , 10% don't speak English at all ).of residents speak other Indo-European language at home (95% speak English very well , 5% speak English well ).of residents speak Asian or Pacific Island language at home (50% speak English very well , 41% speak English well , 9% speak English not well , 1% don't speak English at all ).of residents speak other language at home (100% speak English very well ).
Foreign born population: 936 (4.7%)of them are naturalized citizens )
Median number of rooms in houses and condos:
Median number of rooms in apartments
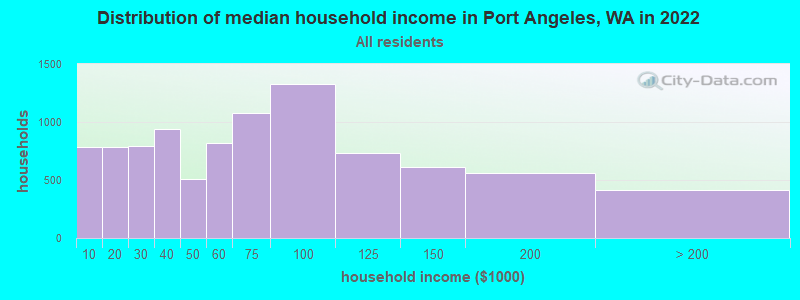
Port Angeles, WA household income distribution 785 Less than $10,000782 $10,000 to $19,999792 $20,000 to $29,999942 $30,000 to $39,999510 $40,000 to $49,999815 $50,000 to $59,9991,080 $60,000 to $74,9991,325 $75,000 to $99,999734 $100,000 to $124,999613 $125,000 to $149,999558 $150,000 to $199,999410 $200,000 or more
Home value of owner - occupied houses in 2022 in Port Angeles, WA 47 Less than $10,0007 $10,000 to $14,99923 $15,000 to $19,99916 $20,000 to $24,99930 $25,000 to $29,9992 $35,000 to $39,99916 $40,000 to $49,99917 $50,000 to $59,99923 $60,000 to $69,99952 $90,000 to $99,99942 $100,000 to $124,99974 $125,000 to $149,999217 $150,000 to $174,999131 $175,000 to $199,999383 $200,000 to $249,999629 $250,000 to $299,9991,374 $300,000 to $399,999935 $400,000 to $499,999524 $500,000 to $749,99958 $750,000 to $999,9998 $2,000,000 or moreRent paid by renters in 2022 in Port Angeles, WA 50 Less than $10015 $100 to $14959 $150 to $19962 $200 to $24948 $250 to $29929 $300 to $34955 $350 to $39926 $400 to $44965 $500 to $54938 $550 to $599331 $600 to $649130 $650 to $699176 $700 to $749214 $750 to $799489 $800 to $899339 $900 to $999695 $1,000 to $1,249244 $1,250 to $1,499607 $1,500 to $1,99923 $2,000 to $2,49965 $3,500 or more152 No cash rent
Percentage of workers working in this county: 97.1%Number of people working at home: 1,090 (11.8% of all workers )
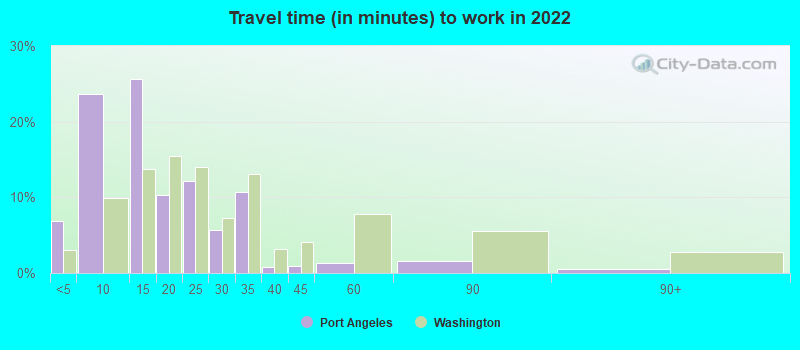
Travel time to work (commute)
Less than 5 minutes: 6075 to 9 minutes: 2,15610 to 14 minutes: 2,09015 to 19 minutes: 61120 to 24 minutes: 80725 to 29 minutes: 22530 to 34 minutes: 73335 to 39 minutes: 16940 to 44 minutes: 4645 to 59 minutes: 7160 to 89 minutes: 39090 or more minutes: 72
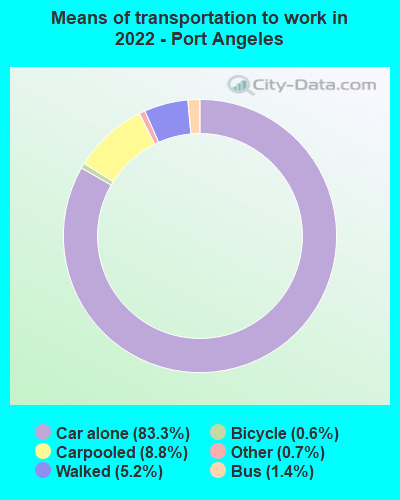
Means of transportation to work:
Drove a car alone: 8,183 (73.4%)Carpooled: 897 (8.0%)Bus : 93 (0.8%)Subway or elevated rail : 1 (0.0%)Taxi: 67 (0.6%)Bicycle: 49 (0.4%)Walked: 516 (4.6%)Worked at home: 1,090 (9.8%)
Unemployment by race in 2022
Unemployment rate for White non-Hispanic residents 4.1% Males4.4% FemalesUnemployment rate for Black residents 3.3% MalesUnemployment rate for American Indian and Alaska Native residents 17.7% MalesUnemployment rate for Asian residents 1.0% MalesUnemployment rate for other race residents 7.3% MalesUnemployment rate for two or more race residents 11.4% MalesUnemployment rate for Hispanic or Latino residents 13.4% Males
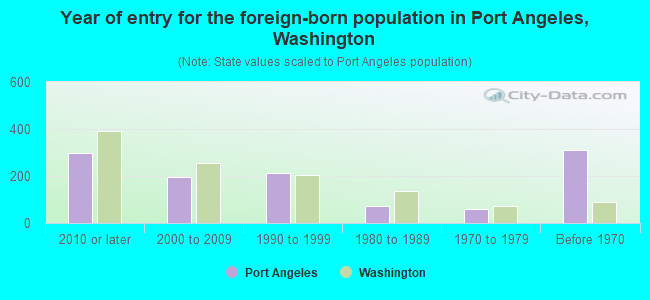
Year of entry for the foreign-born population in Port Angeles, Washington
299 2010 or later 196 2000 to 2009 214 1990 to 1999 71 1980 to 1989 58 1970 to 1979 309 Before 1970
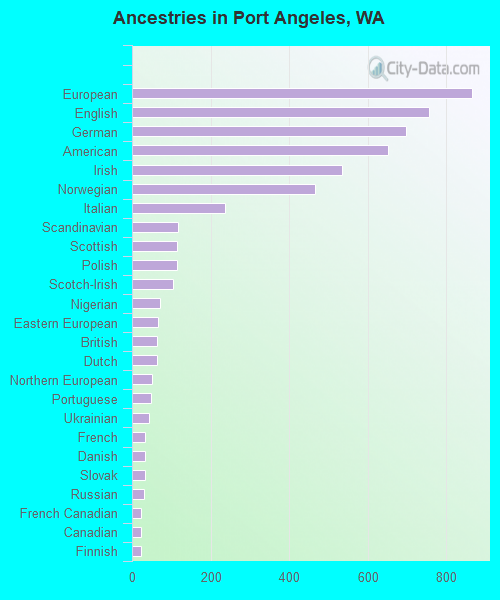
First ancestries reported:
European: 865 (11.0%)
English: 756 (9.6%)
German: 698 (8.9%)
American: 652 (8.3%)
Irish: 534 (6.8%)
Norwegian: 465 (5.9%)
Italian: 236 (3.0%)
Scandinavian: 117 (1.5%)
Scottish: 115 (1.5%)
Polish: 115 (1.5%)
Scotch-Irish: 104 (1.3%)
Nigerian: 70 (0.9%)
Eastern European: 67 (0.9%)
British: 64 (0.8%)
Dutch: 63 (0.8%)
Northern European: 50 (0.6%)
Portuguese: 49 (0.6%)
Ukrainian: 42 (0.5%)
French: 34 (0.4%)
Danish: 34 (0.4%)
Slovak: 34 (0.4%)
Russian: 30 (0.4%)
French Canadian: 24 (0.3%)
Canadian: 23 (0.3%)
Finnish: 23 (0.3%)
Croatian: 20 (0.3%)
Welsh: 19 (0.2%)
Swedish: 17 (0.2%)
Swiss: 14 (0.2%)
Haitian: 12 (0.2%)
Jamaican: 12 (0.2%)
Czech: 9 (0.1%)
Maltese: 8 (0.1%)
Pennsylvania German: 3 (0.04%) Most common places of birth for foreign-born residents (%): Mexico Port Angeles:
30.4% (358)Washington:
21.1% (241,655)
Canada Port Angeles:
13.9% (163)Washington:
4.1% (47,238)
Honduras Port Angeles:
8.8% (103)Washington:
0.6% (6,500)
Germany Port Angeles:
4.9% (58)Washington:
1.6% (17,761)
Other Eastern Europe Port Angeles:
3.6% (42)Washington:
0.3% (3,673)
Vietnam Port Angeles:
3.1% (36)Washington:
5.4% (62,003)
Netherlands Port Angeles:
2.7% (32)Washington:
0.3% (3,414)
Korea Port Angeles:
2.7% (32)Washington:
4.3% (48,886)
India Port Angeles:
2.4% (28)Washington:
8.9% (101,353)
Philippines Port Angeles:
2.0% (24)Washington:
6.3% (71,661)
Haiti Port Angeles:
2.0% (24)Washington:
0.2% (2,421)
China, excluding Hong Kong and Taiwan Port Angeles:
1.9% (22)Washington:
7.4% (84,470)
England Port Angeles:
1.7% (20)Washington:
0.8% (9,457)
Poland Port Angeles:
1.7% (20)Washington:
0.4% (4,963)
Thailand Port Angeles:
1.6% (19)Washington:
0.9% (9,937)
Japan Port Angeles:
1.5% (18)Washington:
1.5% (17,453)
Asia, n.e.c. Port Angeles:
1.5% (18)Washington:
0.1% (813)
Guatemala Port Angeles:
1.5% (18)Washington:
1.2% (13,855)
Place of birth for U.S.-born residents:
This state: 9,763Other state: 9,197Northeast: 753Midwest: 2,084South: 1,692West: 4,690 86.5% of Port Angeles residents lived in the same house 1 years ago.
Out of people who lived in different houses, 41.8% lived in this county.
Out of people who lived in different counties, 45.0% lived in Washington.
Port Angeles:
86.5%State average:
85.2%
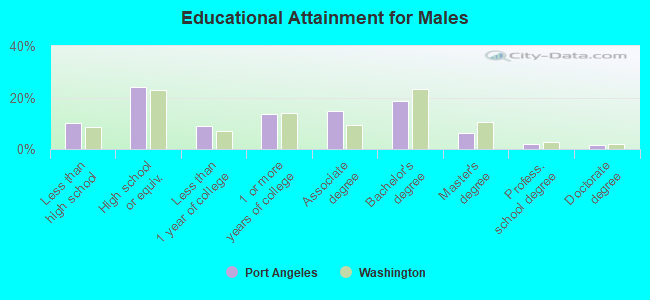
Education attainment for males 25 years and older:
No schooling: 199Nursery to 4th grade: 05th and 6th grade: 77th and 8th grade: 889th grade: 14310th grade: 13111th grade: 4012th grade, no diploma: 176High school graduate (or equivalency): 1,842Less than 1 year of college: 670Some college more than 1 year, no degree: 1,051Associate degree: 1,140Bachelor's degree: 1,424Master's degree: 475Professional school degree: 147Doctorate degree: 114
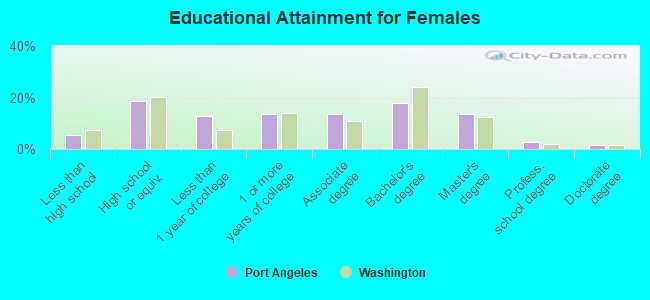
Education attainment for females 25 years and older:
No schooling: 103Nursery to 4th grade: 135th and 6th grade: 07th and 8th grade: 69th grade: 610th grade: 3811th grade: 4612th grade, no diploma: 202High school graduate (or equivalency): 1,405Less than 1 year of college: 983Some college more than 1 year, no degree: 1,037Associate degree: 1,035Bachelor's degree: 1,355Master's degree: 1,037Professional school degree: 213Doctorate degree: 123
Housing units in structures:
One, detached: 7,184One, attached: 171Two: 2983 or 4: 2975 to 9: 34010 to 19: 34520 to 49: 87950 or more: 302Mobile homes: 243Boats, RVs, vans, etc.: 27Housing units lacking complete plumbing facilities in 2022: 0.2%Housing units lacking complete kitchen facilities in 2022: 2.9%House/condo owner moved in on average 13 years ago
Renter moved in on average 3 years ago
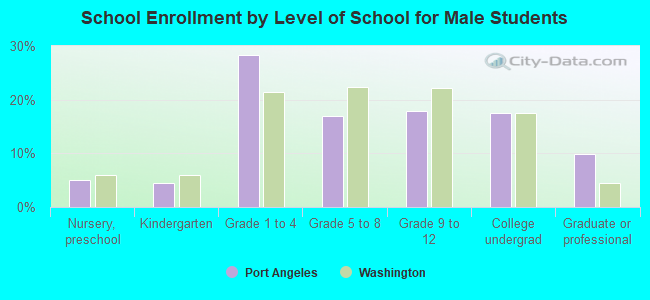
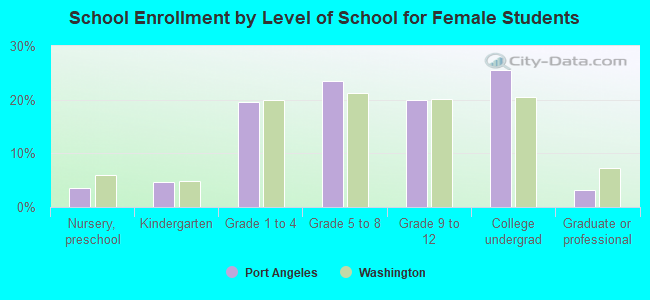
Private vs. public school enrollment:
Students in private schools in grades 1 to 8 (elementary and middle school): 196 Here:
11.5%Washington:
12.4%
Students in private schools in grades 9 to 12 (high school): 65 Students in private undergraduate colleges: 117 Here:
14.0%Washington:
16.5%