Pontiac, IL (Illinois) Houses and Residents
| Pontiac: | $117,119 |
| Illinois: | $251,600 |
Mean price in 2022:
Detached houses: $169,359
Here: $169,359 State: $310,164 Townhouses or other attached units: $183,540
Here: $183,540 State: $286,230 In 2-unit structures: $406,842
Here: $406,842 State: $299,638 In 3-to-4-unit structures: $151,714
Here: $151,714 State: $330,907 In 5-or-more-unit structures: $110,897
Here: $110,897 State: $318,887 Mobile homes: $125,401
Here: $125,401 State: $78,855
Total population: 11,599 (All urban)
Houses: 4,953 (4,630 occupied: 2,881 owner occupied, 1,808 renter occupied)
| % of renters here: | 39% |
| State: | 33% |
Housing density: 945 houses/condos per square mile
Median price asked for vacant for-sale houses and condos in 2022: $42,907.
Median contract rent in 2022: $634 (lower quartile is $478, upper quartile is $770)
Median rent asked for vacant for-rent units in 2022: $655
Median gross rent in Pontiac, IL in 2022: $797
Housing units in Pontiac with a mortgage: 1,810 (114 second mortgage, 0 home equity loan, 87 both second mortgage and home equity loan)
Houses without a mortgage: 16
Median household income for houses/condos with a mortgage: $78,920
Median household income for apartments without a mortgage: $51,910
Median monthly housing costs: $855
Compare current foreclosures near Pontiac, IL:
| Photo | Address | Area | Beds / Baths | Price | Details |
|---|---|---|---|---|---|

|
#1
N Walnut St
Pontiac, IL 61764
|
1,188 sq. feet
|
- baths 3 beds |
show details | |

|
#2
W Prairie St
Pontiac, IL 61764
|
960 sq. feet
|
- baths 3 beds |
show details | |

|
#3
N 1000 East Rd
Pontiac, IL 61764
|
1,740 sq. feet
|
- baths 3 beds |
show details | |

|
#4
E Howard St
Pontiac, IL 61764
|
768 sq. feet
|
- baths 2 beds |
show details | |

|
#5
E Payson St
Pontiac, IL 61764
|
1,641 sq. feet
|
- baths 3 beds |
show details | |

|
#6
W Humiston St
Pontiac, IL 61764
|
1,038 sq. feet
|
- baths 3 beds |
show details | |

|
#7
W Livingston St
Pontiac, IL 61764
|
1,260 sq. feet
|
- baths 2 beds |
show details | |

|
#8
N Main St
Pontiac, IL 61764
|
2,409 sq. feet
|
- baths 3 beds |
show details | |

|
#9
1/2 S Mill St
Pontiac, IL 61764
|
- sq. feet
|
- baths - beds |
show details | |

|
#10
E 1875 North Rd
Pontiac, IL 61764
|
1,624 sq. feet
|
- baths - beds |
show details |
| Photo | Address | Area | Beds / Baths | Price | Details |
|---|---|---|---|---|---|

|
#11
E Washington St
Pontiac, IL 61764
|
1,591 sq. feet
|
- baths - beds |
show details | |

|
#12
N Illini Ave
Pontiac, IL 61764
|
- sq. feet
|
- baths - beds |
show details | |

|
#13
W North St # 1
Pontiac, IL 61764
|
- sq. feet
|
- baths - beds |
show details | |

|
#14
W Lincoln Ave
Pontiac, IL 61764
|
- sq. feet
|
- baths - beds |
show details | |

|
#15
E Scott St
Odell, IL 60460
|
1,320 sq. feet
|
1 baths 3 beds |
show details | |

|
#16
E 3000 North Rd
Chenoa, IL 61726
|
1,898 sq. feet
|
1 baths - beds |
show details | |

|
#17
Livingston St
Gridley, IL 61744
|
1,381 sq. feet
|
1 baths - beds |
show details | |

|
#18
N Ford St
Gridley, IL 61744
|
864 sq. feet
|
1 baths - beds |
show details | |

|
#19
E 3000 North Rd Bldg 178
Streator, IL 61364
|
946 sq. feet
|
- baths 3 beds |
show details | |

|
#20
E North St
Forrest, IL 61741
|
1,480 sq. feet
|
- baths 3 beds |
show details |
| Photo | Address | Area | Beds / Baths | Price | Details |
|---|---|---|---|---|---|

|
#21
E Vermillion St
Odell, IL 60460
|
1,260 sq. feet
|
- baths 3 beds |
show details | |

|
#22
E 1317 North Rd
Forrest, IL 61741
|
1,132 sq. feet
|
- baths 3 beds |
show details | |

|
#23
S Jackson St
Flanagan, IL 61740
|
2,596 sq. feet
|
- baths 5 beds |
show details | |

|
#24
N Monroe St
Flanagan, IL 61740
|
1,248 sq. feet
|
- baths 3 beds |
show details | |

|
#25
S Main St
Flanagan, IL 61740
|
- sq. feet
|
- baths - beds |
show details | |

|
#26
N Jackson St
Flanagan, IL 61740
|
- sq. feet
|
- baths - beds |
show details | |

|
#27
E 6th St
Long Point, IL 61333
|
- sq. feet
|
- baths - beds |
show details | |

|
#28
N Center St
Gridley, IL 61744
|
- sq. feet
|
- baths - beds |
show details | |

|
#29
E 1st St
Gridley, IL 61744
|
- sq. feet
|
- baths - beds |
show details | |

|
Check over 1 million property listings on Foreclosure.com!
|
browse all offers | |||

Latest news about housing in Pontiac, IL collected exclusively by city-data.com from local newspapers, TV, and radio stations

 | Overrated and underrated suburbs Chicago (119 replies) |
| Dwight and Pontiac: new Chicago suburbs? (3 replies) |
| Rank your top 10 cities in the Chicago metro? (35 replies) |
| Peoria/Chicago—where to live in between? (21 replies) |
| Pontiac, Illinois (3 replies) |
| Pros and Cons of Springfield (8 replies) |

Median year apartment built: 1968
Household type by relationship:
Households: 11,293- Male householders: 1,694 (579 living alone), Female householders: 2,851 (1,221 living alone)
1,680 spouses (1,680 opposite-sex spouses), 234 unmarried partners, (234 opposite-sex unmarried partners), 2,750 children (2,662 natural, 10 adopted, 76 stepchildren), 103 grandchildren, 24 brothers or sisters, 52 parents, 5 foster children, 99 other relatives, 163 non-relatives
- In group quarters: 1,632
Size of family households: 1,157 2-persons, 624 3-persons, 433 4-persons, 293 5-persons, 23 6-persons, 21 7-or-more-persons.
Size of nonfamily households: 1,897 1-person, 208 2-persons, 27 3-persons, 9 4-persons.
1,134 married couples with children.
901 single-parent households (200 men, 701 women).
95.7% of residents of Pontiac speak English at home.
3.3% of residents speak Spanish at home (72% speak English very well, 25% speak English well, 3% speak English not well).
0.6% of residents speak other Indo-European language at home (100% speak English very well).
0.1% of residents speak other language at home (100% speak English very well).
Foreign born population: 229 (2.0%)
(63.8% of them are naturalized citizens)
| Here: | 6.1 |
| State: | 6.4 |
| Here: | 4.3 |
| State: | 4.1 |

- Bedrooms in owner-occupied houses and condos in Pontiac, Illinois
- 0no bedroom
- 351 bedroom
- 6852 bedrooms
- 1,5643 bedrooms
- 4764 bedrooms
- 1225+ bedrooms

- Bedrooms in renter-occupied apartments in Pontiac, Illinois
- 26no bedroom
- 5401 bedroom
- 7742 bedrooms
- 3743 bedrooms
- 804 bedrooms
- 125+ bedrooms

- Cars and other vehicles available in Pontiac in owner-occupied houses/condos
- 93no vehicle
- 9441 vehicle
- 1,0912 vehicles
- 5633 vehicles
- 1094 vehicles
- 825+ vehicles

- Cars and other vehicles available in Pontiac in renter-occupied apartments
- 355no vehicle
- 1,1221 vehicle
- 2282 vehicles
- 1033 vehicles
- 04 vehicles
- 05+ vehicles

- Rooms in owner-occupied houses in Pontiac, Illinois
- 01 room
- 02 rooms
- 543 rooms
- 3274 rooms
- 6395 rooms
- 6556 rooms
- 5027 rooms
- 2298 rooms
- 4769+ rooms

- Rooms in renter-occupied apartments in Pontiac, Illinois
- 261 room
- 542 rooms
- 3293 rooms
- 5414 rooms
- 4215 rooms
- 2366 rooms
- 967 rooms
- 938 rooms
- 129+ rooms


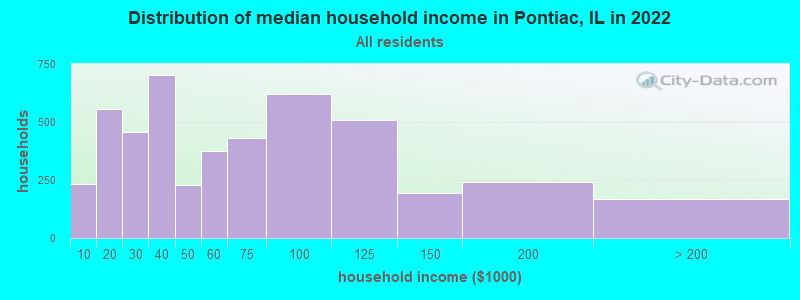
Pontiac, IL household income distribution

- 233Less than $10,000
- 556$10,000 to $19,999
- 459$20,000 to $29,999
- 701$30,000 to $39,999
- 229$40,000 to $49,999
- 377$50,000 to $59,999
- 433$60,000 to $74,999
- 620$75,000 to $99,999
- 508$100,000 to $124,999
- 192$125,000 to $149,999
- 243$150,000 to $199,999
- 170$200,000 or more
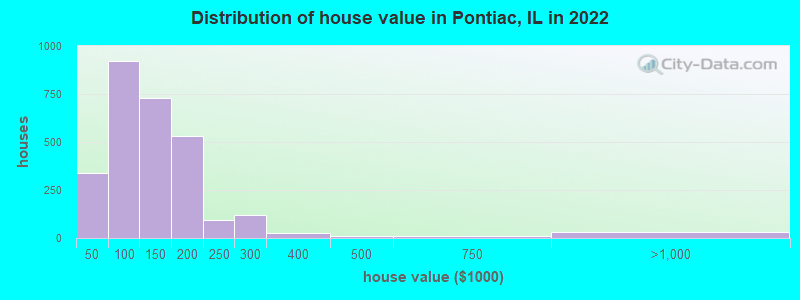
Home value of owner - occupied houses in 2022 in Pontiac, IL
-
- 117Less than $10,000
- 61$10,000 to $14,999
- 20$15,000 to $19,999
- 30$20,000 to $24,999
- 14$25,000 to $29,999
- 11$30,000 to $34,999
- 18$35,000 to $39,999
- 66$40,000 to $49,999
- 59$50,000 to $59,999
- 132$60,000 to $69,999
- 185$70,000 to $79,999
- 251$80,000 to $89,999
- 228$90,000 to $99,999
- 422$100,000 to $124,999
- 305$125,000 to $149,999
- 255$150,000 to $174,999
- 272$175,000 to $199,999
- 94$200,000 to $249,999
- 121$250,000 to $299,999
- 23$300,000 to $399,999
- 9$400,000 to $499,999
- 9$500,000 to $749,999
- 18$750,000 to $999,999
- 13$1,000,000 to $1,499,999
Rent paid by renters in 2022 in Pontiac, IL
-
- 20Less than $100
- 22$100 to $149
- 145$150 to $199
- 28$200 to $249
- 81$250 to $299
- 16$350 to $399
- 16$400 to $449
- 103$450 to $499
- 151$500 to $549
- 114$550 to $599
- 123$600 to $649
- 168$650 to $699
- 217$700 to $749
- 62$750 to $799
- 174$800 to $899
- 106$900 to $999
- 52$1,000 to $1,249
- 9$1,500 to $1,999
- 8$2,000 to $2,499
- 45$3,500 or more
- 125No cash rent

Percentage of workers working in this county: 88.4%
Number of people working at home: 287 (5.8% of all workers)
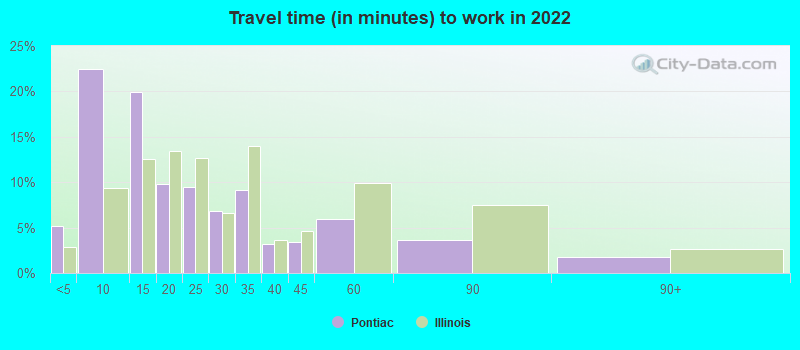
Travel time to work (commute)
- Less than 5 minutes: 370
- 5 to 9 minutes: 1,615
- 10 to 14 minutes: 1,119
- 15 to 19 minutes: 322
- 20 to 24 minutes: 231
- 25 to 29 minutes: 119
- 30 to 34 minutes: 223
- 35 to 39 minutes: 94
- 40 to 44 minutes: 149
- 45 to 59 minutes: 178
- 60 to 89 minutes: 66
- 90 or more minutes: 69
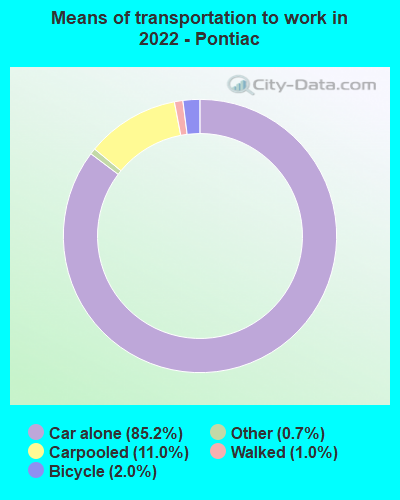
Means of transportation to work:
- Drove a car alone: 5,775 (79.6%)
- Carpooled: 794 (10.9%)
- Bus: 1 (0.0%)
- Ferryboat: 2 (0.0%)
- Taxi: 53 (0.7%)
- Bicycle: 146 (2.0%)
- Walked: 66 (0.9%)
- Worked at home: 287 (4.0%)
- Unemployment by race in 2022
- Unemployment rate for White non-Hispanic residents
- 1.9%Males
- 4.5%Females
- Unemployment rate for two or more race residents
- 10.3%Females
- Unemployment rate for Hispanic or Latino residents
- 18.2%Females

- Year of entry for the foreign-born population in Pontiac, Illinois
- 1072010 or later
- 262000 to 2009
- 761990 to 1999
- 371980 to 1989
- 721970 to 1979
- 35Before 1970
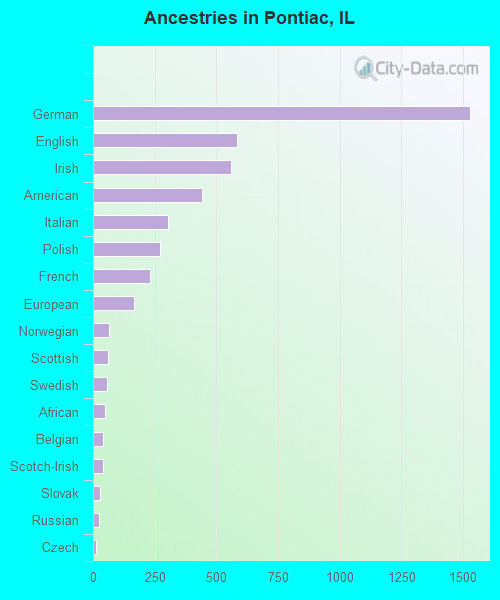
First ancestries reported:
- German: 1,529 (24.4%)
- English: 583 (9.3%)
- Irish: 561 (9.0%)
- American: 440 (7.0%)
- Italian: 305 (4.9%)
- Polish: 271 (4.3%)
- French: 230 (3.7%)
- European: 165 (2.6%)
- Norwegian: 65 (1.0%)
- Scottish: 60 (1.0%)
- Swedish: 57 (0.9%)
- African: 48 (0.8%)
- Belgian: 41 (0.7%)
- Scotch-Irish: 40 (0.6%)
- Slovak: 29 (0.5%)
- Russian: 26 (0.4%)
- Czech: 14 (0.2%)
- French Canadian: 13 (0.2%)
- Eastern European: 10 (0.2%)
- Austrian: 9 (0.1%)
- Nigerian: 9 (0.1%)
- Hungarian: 8 (0.1%)
- Slavic: 7 (0.1%)
- Dutch: 2 (0.03%)
Most common places of birth for foreign-born residents (%):
| Pontiac: | 30.1% (69) |
| Illinois: | 5.2% (93,003) |
| Pontiac: | 30.1% (69) |
| Illinois: | 34.7% (626,958) |
| Pontiac: | 12.2% (28) |
| Illinois: | 1.6% (29,519) |
| Pontiac: | 8.3% (19) |
| Illinois: | 0.5% (9,688) |
| Pontiac: | 4.4% (10) |
| Illinois: | 0.9% (16,308) |
| Pontiac: | 3.9% (9) |
| Illinois: | 1.2% (21,186) |
| Pontiac: | 3.5% (8) |
| Illinois: | 0.0% (404) |
| Pontiac: | 3.1% (7) |
| Illinois: | 4.1% (74,364) |
| Pontiac: | 2.2% (5) |
| Illinois: | 9.2% (166,409) |
Place of birth for U.S.-born residents:
- This state: 9,212
- Other state: 1,739
- Northeast: 95
- Midwest: 861
- South: 555
- West: 221
85.8% of Pontiac residents lived in the same house 1 years ago.
Out of people who lived in different houses, 31.4% lived in this county.
Out of people who lived in different counties, 89.6% lived in Illinois.
| Pontiac: | 85.8% |
| State average: | 88.3% |
Education attainment for males 25 years and older:
- No schooling: 18
- Nursery to 4th grade: 18
- 5th and 6th grade: 8
- 7th and 8th grade: 136
- 9th grade: 168
- 10th grade: 135
- 11th grade: 199
- 12th grade, no diploma: 63
- High school graduate (or equivalency): 1,925
- Less than 1 year of college: 195
- Some college more than 1 year, no degree: 789
- Associate degree: 48
- Bachelor's degree: 307
- Master's degree: 178
- Professional school degree: 76
- Doctorate degree: 3

Education attainment for females 25 years and older:
- No schooling: 31
- Nursery to 4th grade: 12
- 5th and 6th grade: 0
- 7th and 8th grade: 22
- 9th grade: 17
- 10th grade: 99
- 11th grade: 38
- 12th grade, no diploma: 8
- High school graduate (or equivalency): 1,453
- Less than 1 year of college: 363
- Some college more than 1 year, no degree: 625
- Associate degree: 356
- Bachelor's degree: 514
- Master's degree: 154
- Professional school degree: 61
- Doctorate degree: 136


Housing units in structures:
- One, detached: 3,201
- One, attached: 156
- Two: 117
- 3 or 4: 404
- 5 to 9: 249
- 10 to 19: 213
- 20 to 49: 26
- 50 or more: 264
- Mobile homes: 319
Median worth of mobile homes: $12,126
Housing units lacking complete kitchen facilities in 2022: 3.6%
House/condo owner moved in on average 11 years ago
Renter moved in on average 3 years ago

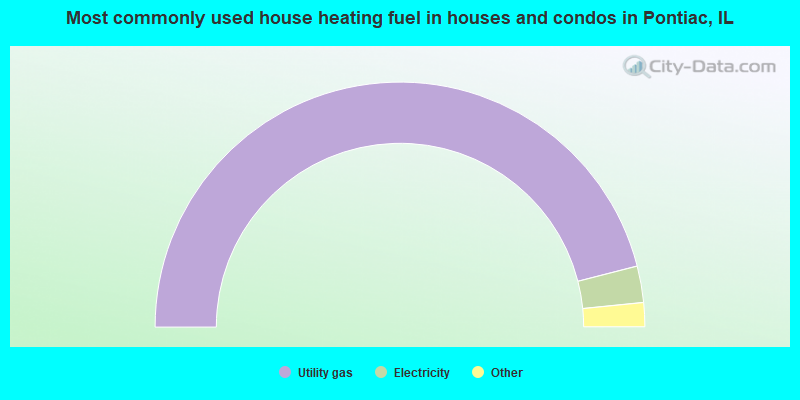
- 92.1%Utility gas
- 4.8%Electricity
- 2.9%Bottled, tank, or LP gas
- 0.3%No fuel used
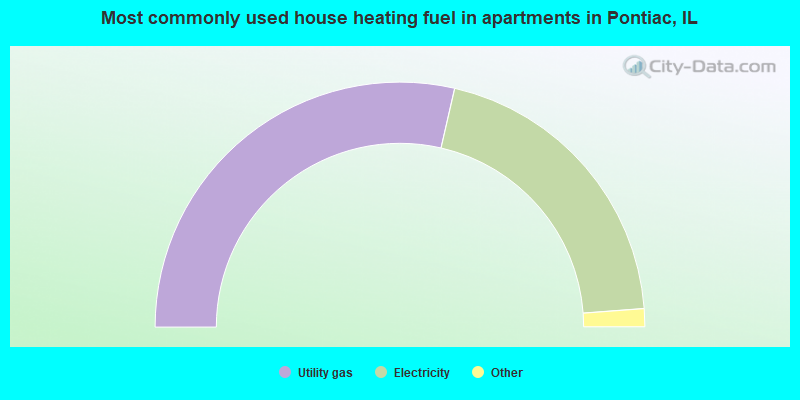
- 57.2%Utility gas
- 40.4%Electricity
- 1.1%No fuel used
- 0.7%Solar energy
- 0.6%Bottled, tank, or LP gas
Private vs. public school enrollment:
| Here: | 12.2% |
| Illinois: | 13.3% |
| Here: | 5.6% |
| Illinois: | 9.9% |
| Here: | 7.1% |
| Illinois: | 27.4% |


