Pitman, NJ (New Jersey) Houses and Residents
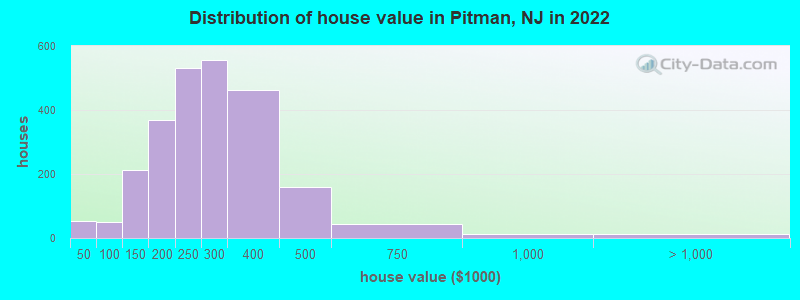
Estimated median house or condo value in 2022: $256,804 (it was $118,400 in 2000 )
Pitman:
$256,804New Jersey:
$428,900
Lower value quartile - upper value quartile: $194,695 - $320,911Mean price in 2022: Detached houses: $294,858 Here:
$294,858State:
$537,591
Townhouses or other attached units: $330,729 Here:
$330,729State:
$381,113
In 2-unit structures: $322,371 Here:
$322,371State:
$444,476
In 5-or-more-unit structures: $168,858 Here:
$168,858State:
$368,745
Total population: 8,895 (All urban)
Houses: 3,954 (3,694 occupied: 2,664 owner occupied, 1,065 renter occupied )
% of renters here:
29%State:
35%
Housing density: 1,724 houses/condos per square mile
Median price asked for vacant for-sale houses and condos in 2022: $250,875.
Median contract rent in 2022: $1,168 (lower quartile is $780, upper quartile is $1,589)
Median rent asked for vacant for-rent units in 2022: $1,326
Median gross rent in Pitman, NJ in 2022: $1,294
Housing units in Pitman with a mortgage: 1,797 (208 second mortgage, 23 home equity loan, 161 both second mortgage and home equity loan )Houses without a mortgage: 70
Median household income for houses/condos with a mortgage: $110,652
Median household income for apartments without a mortgage: $90,605
Median monthly housing costs: $1,475
Data:
Median house or condo value ($)
Median house or condo value ($ change since 2000)
Median house or condo value ($) - White
Median house or condo value ($) - Black or African American
Median house or condo value ($) - Asian
Median house or condo value ($) - Hispanic or Latino
Median house or condo value ($) - American Indian and Alaska Native
Median house or condo value ($) - Multirace
Median house or condo value ($) - Other Race
Median price asked for mobile homes ($)
Household density (households per square mile)
Mean house or condo value by units in structure - 1, detached ($)
Mean house or condo value by units in structure - 1, attached ($)
Mean house or condo value by units in structure - 2 ($)
Mean house or condo value by units in structure by units in structure - 3 or 4 ($)
Mean house or condo value by units in structure - 5 or more ($)
Mean house or condo value by units in structure - Boat, RV, van, etc. ($)
Mean house or condo value by units in structure - Mobile home ($)
Median contract rent ($)
Median contract rent - Lower quartile ($)
Median contract rent - Upper quartile ($)
Median gross rent ($)
Urban houses (%)
Rural houses (%)
Houses occupied (%)
Houses occupied (% change since 2000)
Houses owner occupied (%)
Houses owner occupied (% change since 2000)
Houses renter occupied (%)
Houses renter occupied (% change since 2000)
Vacant housing units - For rent (%)
Vacant housing units - For rent (% change since 2000)
Vacant housing units - For sale only (%)
Vacant housing units - For sale only (% change since 2000)
Vacant housing units - Rented or sold, not occupied (%)
Vacant housing units - Rented or sold, not occupied (% change since 2000)
Vacant housing units - For seasonal, recreational, or occasional use (%)
Vacant housing units - For seasonal, recreational, or occasional use (% change since 2000)
Vacant housing units - For migrant workers (%)
Vacant housing units - For migrant workers (% change since 2000)
Vacant housing units - Other vacant (%)
Vacant housing units - Other vacant (% change since 2000)
Median monthly housing costs ($)
Median household income for houses/condos with a mortgage ($)
Median household income for houses/condos without a mortgage ($)
Median household income ($)
Median household income ($) - White
Median household income ($) - Black or African American
Median household income ($) - Asian
Median household income ($) - Hispanic or Latino
Median household income ($) - American Indian and Alaska Native
Median household income ($) - Multirace
Median household income ($) - Other Race
Mortgage status - with mortgage (%)
Mortgage status - with second mortgage (%)
Mortgage status - with home equity loan (%)
Mortgage status - with both second mortgage and home equity loan (%)
Mortgage status - without a mortgage (%)
Median year house/condo built
Median year apartment built
Household type by relationship - Male householder living alone (%)
Household type by relationship - Male householder not living alone (%)
Household type by relationship - Female householder living alone (%)
Household type by relationship - Female householder not living alone (%)
Household type by relationship - Opposite-Sex spouse (%)
Household type by relationship - Same-Sex spouse (%)
Household type by relationship - Opposite-Sex unmarried partner (%)
Household type by relationship - Same-Sex unmarried partner (%)
Household type by relationship - In group quarters (%)
Size of family households - 2-person household (%)
Size of family households - 3-person household (%)
Size of family households - 4-person household (%)
Size of family households - 5-person household (%)
Size of family households - 6-person household (%)
Size of family households - 7-or-more-person household (%)
Size of nonfamily households - 1-person household (%)
Size of nonfamily households - 2-person household (%)
Size of nonfamily households - 3-person household (%)
Size of nonfamily households - 4-person household (%)
Size of nonfamily households - 5-person household (%)
Size of nonfamily households - 6-person household (%)
Size of nonfamily households - 7-or-moreperson household (%)
Year house built - Built 2010 or later (%)
Year house built - Built 2000 to 2009 (%)
Year house built - Built 1990 to 1999 (%)
Year house built - Built 1980 to 1989 (%)
Year house built - Built 1970 to 1979 (%)
Year house built - Built 1960 to 1969 (%)
Year house built - Built 1950 to 1959 (%)
Year house built - Built 1940 to 1949 (%)
Year house built - Built 1939 or earlier (%)
Median number of rooms in houses and condos
Median number of rooms in apartments
Median number of bedrooms in owner occupied houses
Mean number of bedrooms in owner occupied houses
Median number of bedrooms in renter occupied houses
Mean number of bedrooms in renter occupied houses
Median number of vehichles in owner occupied houses
Mean number of vehichles in owner occupied houses
Median number of vehichles in renter occupied houses
Mean number of vehichles in renter occupied houses
Rooms in owner-occupied houses - 1 room (%)
Rooms in owner-occupied houses - 2 rooms (%)
Rooms in owner-occupied houses - 3 rooms (%)
Rooms in owner-occupied houses - 4 rooms (%)
Rooms in owner-occupied houses - 5 rooms (%)
Rooms in owner-occupied houses - 6 rooms (%)
Rooms in owner-occupied houses - 7 rooms (%)
Rooms in owner-occupied houses - 8 rooms (%)
Rooms in owner-occupied houses - 9+ rooms (%)
Rooms in renter-occupied houses - 1 room (%)
Rooms in renter-occupied houses - 2 rooms (%)
Rooms in renter-occupied houses - 3 rooms (%)
Rooms in renter-occupied houses - 4 rooms (%)
Rooms in renter-occupied houses - 5 rooms (%)
Rooms in renter-occupied houses - 6 rooms (%)
Rooms in renter-occupied houses - 7 rooms (%)
Rooms in renter-occupied houses - 8 rooms (%)
Rooms in renter-occupied houses - 9+ rooms (%)
Bedrooms in owner-occupied houses - no bedrooms (%)
Bedrooms in owner-occupied houses - 1 bedroom (%)
Bedrooms in owner-occupied houses - 2 bedrooms (%)
Bedrooms in owner-occupied houses - 3 bedrooms (%)
Bedrooms in owner-occupied houses - 4 bedrooms (%)
Bedrooms in owner-occupied houses - 5+ bedrooms (%)
Bedrooms in renter-occupied houses - no bedrooms (%)
Bedrooms in renter-occupied houses - 1 bedroom (%)
Bedrooms in renter-occupied houses - 2 bedrooms (%)
Bedrooms in renter-occupied houses - 3 bedrooms (%)
Bedrooms in renter-occupied houses - 4 bedrooms (%)
Bedrooms in renter-occupied houses - 5+ bedrooms (%)
Vehicles available in owner-occupied houses - no vehicle available (%)
Vehicles available in owner-occupied houses - 1 vehicle available(%)
Vehicles available in owner-occupied houses - 2 Vehicles available (%)
Vehicles available in owner-occupied houses - 3 Vehicles available (%)
Vehicles available in owner-occupied houses - 4 Vehicles available (%)
Vehicles available in owner-occupied houses - 5+ Vehicles available (%)
Vehicles available in renter-occupied houses - no vehicle available (%)
Vehicles available in renter-occupied houses - 1 vehicle available (%)
Vehicles available in renter-occupied houses - 2 Vehicles available (%)
Vehicles available in renter-occupied houses - 3 Vehicles available (%)
Vehicles available in renter-occupied houses - 4 Vehicles available (%)
Vehicles available in renter-occupied houses - 5+ Vehicles available (%)
Housing units in structures - 1, detached (%)
Housing units in structures - 1, attached (%)
Housing units in structures - 2 (%)
Housing units in structures - 3 or 4 (%)
Housing units in structures - 5 to 9 (%)
Housing units in structures - 10 to 19 (%)
Housing units in structures - 20 to 49 (%)
Housing units in structures - 50 or more (%)
Housing units in structures - Mobile home (%)
Housing units in structures - Boat, RV, van, etc. (%)
Housing units in structures - Owners - 1, detached (%)
Housing units in structures - Owners - 1, attached (%)
Housing units in structures - Owners - 2 (%)
Housing units in structures - Owners - 3 or 4 (%)
Housing units in structures - Owners - 5 to 9 (%)
Housing units in structures - Owners - 10 to 19 (%)
Housing units in structures - Owners - 20 to 49 (%)
Housing units in structures - Owners - 50 or more (%)
Housing units in structures - Owners - Mobile home (%)
Housing units in structures - Owners - Boat, RV, van, etc. (%)
Housing units in structures - Renters - 1, detached (%)
Housing units in structures - Renters - 1, attached (%)
Housing units in structures - Renters - 2 (%)
Housing units in structures - Renters - 3 or 4 (%)
Housing units in structures - Renters - 5 to 9 (%)
Housing units in structures - Renters - 10 to 19 (%)
Housing units in structures - Renters - 20 to 49 (%)
Housing units in structures - Renters - 50 or more (%)
Housing units in structures - Renters - Mobile home (%)
Housing units in structures - Renters - Boat, RV, van, etc. (%)
House/condo owner moved in on average (years ago)
Renter moved in on average (years ago)
Year householder moved into unit - Moved in 1999 to March 2000 (%)
Year householder moved into unit - Moved in 1999 to March 2000 (%) - White
Year householder moved into unit - Moved in 1999 to March 2000 (%) - Black or African American
Year householder moved into unit - Moved in 1999 to March 2000 (%) - Asian
Year householder moved into unit - Moved in 1999 to March 2000 (%) - Hispanic or Latino
Year householder moved into unit - Moved in 1999 to March 2000 (%) - American Indian and Alaska Native
Year householder moved into unit - Moved in 1999 to March 2000 (%) - Multirace
Year householder moved into unit - Moved in 1999 to March 2000 (%) - Other Race
Year householder moved into unit - Moved in 1995 to 1998 (%)
Year householder moved into unit - Moved in 1995 to 1998 (%) - White
Year householder moved into unit - Moved in 1995 to 1998 (%) - Black or African American
Year householder moved into unit - Moved in 1995 to 1998 (%) - Asian
Year householder moved into unit - Moved in 1995 to 1998 (%) - Hispanic or Latino
Year householder moved into unit - Moved in 1995 to 1998 (%) - American Indian and Alaska Native
Year householder moved into unit - Moved in 1995 to 1998 (%) - Multirace
Year householder moved into unit - Moved in 1995 to 1998 (%) - Other Race
Year householder moved into unit - Moved in 1990 to 1994 (%)
Year householder moved into unit - Moved in 1990 to 1994 (%) - White
Year householder moved into unit - Moved in 1990 to 1994 (%) - Black or African American
Year householder moved into unit - Moved in 1990 to 1994 (%) - Asian
Year householder moved into unit - Moved in 1990 to 1994 (%) - Hispanic or Latino
Year householder moved into unit - Moved in 1990 to 1994 (%) - American Indian and Alaska Native
Year householder moved into unit - Moved in 1990 to 1994 (%) - Multirace
Year householder moved into unit - Moved in 1990 to 1994 (%) - Other Race
Year householder moved into unit - Moved in 1980 to 1989 (%)
Year householder moved into unit - Moved in 1980 to 1989 (%) - White
Year householder moved into unit - Moved in 1980 to 1989 (%) - Black or African American
Year householder moved into unit - Moved in 1980 to 1989 (%) - Asian
Year householder moved into unit - Moved in 1980 to 1989 (%) - Hispanic or Latino
Year householder moved into unit - Moved in 1980 to 1989 (%) - American Indian and Alaska Native
Year householder moved into unit - Moved in 1980 to 1989 (%) - Multirace
Year householder moved into unit - Moved in 1980 to 1989 (%) - Other Race
Year householder moved into unit - Moved in 1970 to 1979 (%)
Year householder moved into unit - Moved in 1970 to 1979 (%) - White
Year householder moved into unit - Moved in 1970 to 1979 (%) - Black or African American
Year householder moved into unit - Moved in 1970 to 1979 (%) - Asian
Year householder moved into unit - Moved in 1970 to 1979 (%) - Hispanic or Latino
Year householder moved into unit - Moved in 1970 to 1979 (%) - American Indian and Alaska Native
Year householder moved into unit - Moved in 1970 to 1979 (%) - Multirace
Year householder moved into unit - Moved in 1970 to 1979 (%) - Other Race
Year householder moved into unit - Moved in 1969 or earlier (%)
Year householder moved into unit - Moved in 1969 or earlier (%) - White
Year householder moved into unit - Moved in 1969 or earlier (%) - Black or African American
Year householder moved into unit - Moved in 1969 or earlier (%) - Asian
Year householder moved into unit - Moved in 1969 or earlier (%) - Hispanic or Latino
Year householder moved into unit - Moved in 1969 or earlier (%) - American Indian and Alaska Native
Year householder moved into unit - Moved in 1969 or earlier (%) - Multirace
Year householder moved into unit - Moved in 1969 or earlier (%) - Other Race
Housing units lacking complete plumbing facilities (%)
Housing units lacking complete kitchen facilities (%)
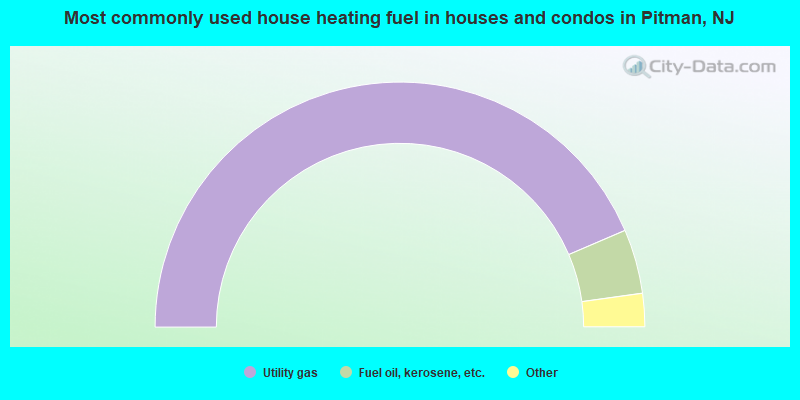
House heating fuel used in houses and condos - Utility gas (%)
House heating fuel used in houses and condos - Bottled, tank, or LP gas (%)
House heating fuel used in houses and condos - Electricity (%)
House heating fuel used in houses and condos - Fuel oil, kerosene, etc. (%)
House heating fuel used in houses and condos - Coal or coke (%)
House heating fuel used in houses and condos - Wood (%)
House heating fuel used in houses and condos - Solar energy (%)
House heating fuel used in houses and condos - Other fuel (%)
House heating fuel used in houses and condos - No fuel used (%)
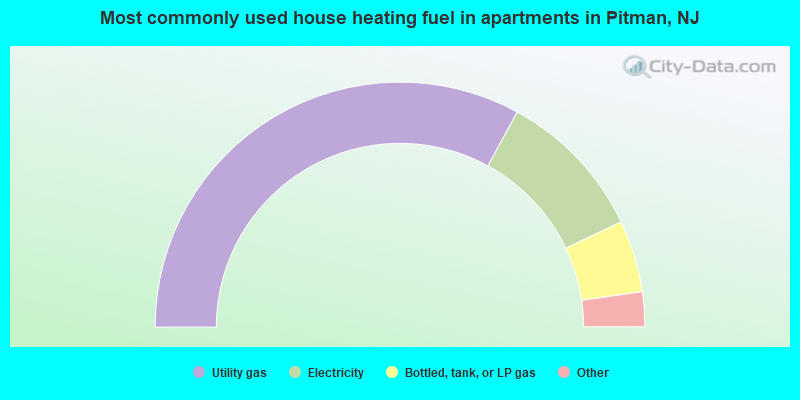
House heating fuel used in apartments - Utility gas (%)
House heating fuel used in apartments - Bottled, tank, or LP gas (%)
House heating fuel used in apartments - Electricity (%)
House heating fuel used in apartments - Fuel oil, kerosene, etc. (%)
House heating fuel used in apartments - Coal or coke (%)
House heating fuel used in apartments - Wood (%)
House heating fuel used in apartments - Solar energy (%)
House heating fuel used in apartments - Other fuel (%)
House heating fuel used in apartments - No fuel used (%)
Latest news about housing in Pitman, NJ collected exclusively by city-data.com from local newspapers, TV, and radio stations
Median year house/condo built: 1948Median year apartment built: 1948Household type by relationship:
Households: 8,920
Male householders: 1,647 (364 living alone ), Female householders: 2,070 (836 living alone )1,810 spouses (1,803 opposite-sex spouses ), 190 unmarried partners , (146 opposite-sex unmarried partners ), 2,493 children (2,373 natural , 0 adopted , 119 stepchildren ), 221 grandchildren , 16 brothers or sisters , 95 parents , 0 foster children , 129 other relatives , 101 non-relatives In group quarters: 143
Size of family households: 1,085 2-persons , 464 3-persons , 513 4-persons , 217 5-persons , 53 6-persons , 4 7-or-more-persons .
Size of nonfamily households: 1,220 1-person , 189 2-persons .
1,346 married couples with children. single-parent households (37 men , 163 women ).
95.7% of residents of Pitman speak English at home. of residents speak Spanish at home (99% speak English very well , 1% speak English well ).of residents speak other Indo-European language at home (92% speak English very well , 8% speak English well ).of residents speak Asian or Pacific Island language at home (11% speak English well , 89% speak English not well ).
Foreign born population: 521 (5.8%)of them are naturalized citizens )
Median number of rooms in houses and condos:
Median number of rooms in apartments
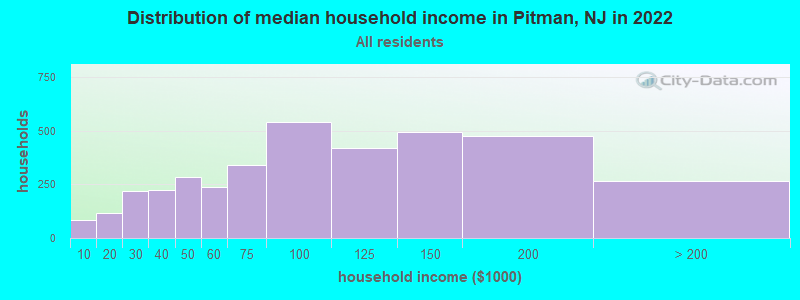
Pitman, NJ household income distribution 86 Less than $10,000117 $10,000 to $19,999220 $20,000 to $29,999222 $30,000 to $39,999285 $40,000 to $49,999238 $50,000 to $59,999340 $60,000 to $74,999540 $75,000 to $99,999417 $100,000 to $124,999492 $125,000 to $149,999477 $150,000 to $199,999267 $200,000 or more
Home value of owner - occupied houses in 2022 in Pitman, NJ 34 $20,000 to $24,9998 $30,000 to $34,9998 $40,000 to $49,99910 $50,000 to $59,99922 $80,000 to $89,9998 $90,000 to $99,999121 $100,000 to $124,99988 $125,000 to $149,999180 $150,000 to $174,999190 $175,000 to $199,999531 $200,000 to $249,999555 $250,000 to $299,999460 $300,000 to $399,999157 $400,000 to $499,99943 $500,000 to $749,99911 $750,000 to $999,9997 $1,000,000 to $1,499,9995 $2,000,000 or moreRent paid by renters in 2022 in Pitman, NJ 5 $300 to $34968 $550 to $59926 $700 to $74942 $750 to $799111 $800 to $899101 $900 to $999119 $1,000 to $1,249146 $1,250 to $1,499247 $1,500 to $1,99938 $2,000 to $2,49935 No cash rent
Percentage of workers working in this county: 65.5%Number of people working at home: 648 (14.3% of all workers )
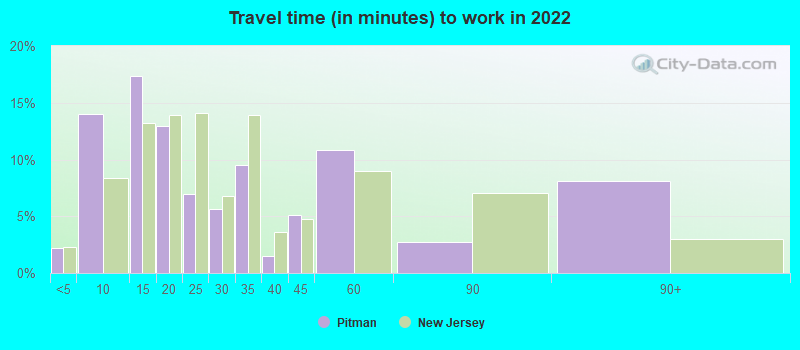
Travel time to work (commute)
Less than 5 minutes: 555 to 9 minutes: 40310 to 14 minutes: 48115 to 19 minutes: 57520 to 24 minutes: 47625 to 29 minutes: 20130 to 34 minutes: 60635 to 39 minutes: 17640 to 44 minutes: 20245 to 59 minutes: 36360 to 89 minutes: 26790 or more minutes: 90
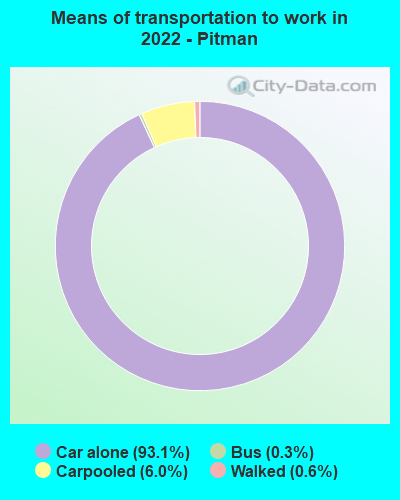
Means of transportation to work:
Drove a car alone: 1,550 (67.5%)Carpooled: 117 (5.1%)Bus : 4 (0.2%)Walked: 13 (0.6%)Worked at home: 648 (28.2%)
Unemployment by race in 2022
Unemployment rate for White non-Hispanic residents 8.4% Males5.1% FemalesUnemployment rate for Black residents 3.8% MalesUnemployment rate for two or more race residents 3.4% Males
Year of entry for the foreign-born population in Pitman, New Jersey
115 2010 or later 43 2000 to 2009 42 1990 to 1999 59 1980 to 1989 43 1970 to 1979 73 Before 1970
First ancestries reported:
English: 510 (18.8%)
Italian: 415 (15.3%)
American: 408 (15.0%)
Irish: 297 (11.0%)
German: 213 (7.9%)
Scottish: 67 (2.5%)
Norwegian: 61 (2.2%)
Greek: 46 (1.7%)
Iranian: 31 (1.1%)
Eastern European: 30 (1.1%)
Polish: 29 (1.1%)
Scotch-Irish: 29 (1.1%)
Canadian: 22 (0.8%)
Ukrainian: 20 (0.7%)
Lithuanian: 17 (0.6%)
Russian: 17 (0.6%)
Dutch: 13 (0.5%)
British: 12 (0.4%)
Latvian: 12 (0.4%)
Swedish: 12 (0.4%)
Pennsylvania German: 8 (0.3%)
Slovak: 8 (0.3%)
Hungarian: 6 (0.2%)
Turkish: 6 (0.2%)
Jamaican: 6 (0.2%)
European: 4 (0.1%) Most common places of birth for foreign-born residents (%): Canada Pitman:
39.5% (191)New Jersey:
0.9% (18,317)
Argentina Pitman:
10.7% (52)New Jersey:
0.5% (10,607)
Philippines Pitman:
10.5% (51)New Jersey:
4.0% (85,934)
India Pitman:
7.2% (35)New Jersey:
12.8% (274,609)
Italy Pitman:
5.6% (27)New Jersey:
1.5% (33,198)
England Pitman:
5.2% (25)New Jersey:
0.5% (10,886)
Switzerland Pitman:
3.3% (16)New Jersey:
0.1% (1,396)
Brazil Pitman:
2.7% (13)New Jersey:
2.1% (46,020)
Germany Pitman:
2.1% (10)New Jersey:
0.8% (17,217)
Netherlands Pitman:
1.9% (9)New Jersey:
0.1% (2,616)
Place of birth for U.S.-born residents:
This state: 5,970Other state: 2,305Northeast: 1,705Midwest: 91South: 427West: 76 90.5% of Pitman residents lived in the same house 1 years ago.
Out of people who lived in different houses, 37.8% lived in this county.
Out of people who lived in different counties, 66.3% lived in New Jersey.
Pitman:
90.5%State average:
90.4%
Education attainment for males 25 years and older:
No schooling: 2Nursery to 4th grade: 05th and 6th grade: 47th and 8th grade: 09th grade: 910th grade: 5211th grade: 612th grade, no diploma: 11High school graduate (or equivalency): 764Less than 1 year of college: 194Some college more than 1 year, no degree: 466Associate degree: 307Bachelor's degree: 738Master's degree: 263Professional school degree: 28Doctorate degree: 103
Education attainment for females 25 years and older:
No schooling: 1Nursery to 4th grade: 05th and 6th grade: 57th and 8th grade: 479th grade: 010th grade: 2711th grade: 3912th grade, no diploma: 25High school graduate (or equivalency): 1,028Less than 1 year of college: 156Some college more than 1 year, no degree: 305Associate degree: 279Bachelor's degree: 1,257Master's degree: 403Professional school degree: 84Doctorate degree: 24
Housing units in structures:
One, detached: 2,892One, attached: 161Two: 2213 or 4: 1775 to 9: 11910 to 19: 16920 to 49: 5650 or more: 126Mobile homes: 30Housing units lacking complete plumbing facilities in 2022: 2.7%Housing units lacking complete kitchen facilities in 2022: 4.7%House/condo owner moved in on average 17 years ago
Renter moved in on average 5 years ago
Private vs. public school enrollment:
Students in private schools in grades 1 to 8 (elementary and middle school): 124 Here:
16.3%New Jersey:
12.3%
Students in private schools in grades 9 to 12 (high school): 7 Here:
1.9%New Jersey:
13.1%
Students in private undergraduate colleges: 88 Here:
18.8%New Jersey:
33.2%