Housing density: 1,228 houses/condos per square mile
Median price asked for vacant for-sale houses and condos in 2022 in this county: $280,676.
Median contract rent in 2022: $1,059 (lower quartile is $770, upper quartile is $1,337)
Median rent asked for vacant for-rent units in 2022: $1,075
Median gross rent in Pennsauken, NJ in 2022: $1,166
Housing units in Pennsauken with a mortgage: 6,791 (711 second mortgage, 853 home equity loan, 16 both second mortgage and home equity loan) Houses without a mortgage: 2,671
In family households: 431,734 (82,185 male householders, 47,758 female householders)
88,462 spouses, 162,028 children (152,370 natural, 3,447 adopted, 6,211 stepchildren), 13,516 grandchildren, 6,342 brothers or sisters, 5,878 parents, foster children, 8,583 other relatives, 13,287 non-relatives
In nonfamily households: 74,509 (26,856 male householders (20,736 living alone)), 34,181 female householders (29,446 living alone)), 13,472 nonrelatives
In group quarters: 7,414 (5,604 institutionalized population)
84,681 married couples with children.
35,421 single-parent households (6,804 men, 28,617 women).
79.9% of residents of Pennsauken speak English at home.
12.5% of residents speak Spanish at home (65% speak English very well, 22% speak English well, 11% speak English not well, 3% don't speak English at all).
3.6% of residents speak other Indo-European language at home (66% speak English very well, 21% speak English well, 11% speak English not well, 2% don't speak English at all).
3.7% of residents speak Asian or Pacific Island language at home (37% speak English very well, 27% speak English well, 32% speak English not well, 4% don't speak English at all).
0.3% of residents speak other language at home (87% speak English very well, 13% speak English well).
Foreign born population: 5,114 (13.9%)
(53.9% of them are naturalized citizens)
Year of entry for the foreign-born population in Pennsauken, New Jersey
6481995 to March 2000
6131990 to 1994
3871985 to 1989
3861980 to 1984
2631975 to 1979
1281970 to 1974
931965 to 1969
304Before 1965
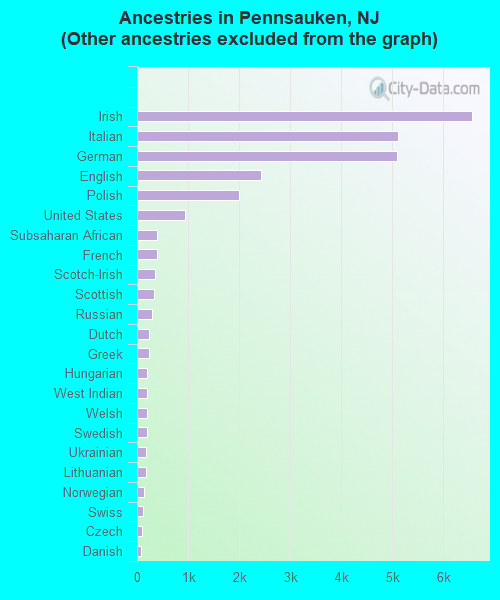
First ancestries reported:
Other: 13,667 (34.4%)
Irish: 6,567 (16.5%)
Italian: 5,118 (12.9%)
German: 5,098 (12.8%)
English: 2,425 (6.1%)
Polish: 2,007 (5.1%)
United States: 934 (2.4%)
Subsaharan African: 400 (1.0%)
French: 388 (1.0%)
Scotch-Irish: 357 (0.9%)
Scottish: 332 (0.8%)
Russian: 288 (0.7%)
Dutch: 230 (0.6%)
Greek: 230 (0.6%)
Hungarian: 202 (0.5%)
West Indian: 192 (0.5%)
Welsh: 189 (0.5%)
Swedish: 187 (0.5%)
Ukrainian: 179 (0.5%)
Lithuanian: 168 (0.4%)
Norwegian: 129 (0.3%)
Swiss: 109 (0.3%)
Czech: 89 (0.2%)
Danish: 81 (0.2%)
Arab: 49 (0.1%)
French Canadian: 44 (0.1%)
Slovak: 25 (0.06%)
Portuguese: 12 (0.03%)
Most common places of birth for foreign-born residents (%):
Vietnam
Pennsauken:
25.2% (710)
New Jersey:
0.9% (13,337)
Philippines
Pennsauken:
7.8% (220)
New Jersey:
4.7% (69,773)
Dominican Republic
Pennsauken:
5.5% (155)
New Jersey:
6.2% (91,316)
Mexico
Pennsauken:
4.9% (139)
New Jersey:
4.6% (67,667)
Nicaragua
Pennsauken:
4.8% (136)
New Jersey:
0.4% (5,508)
Jamaica
Pennsauken:
4.5% (128)
New Jersey:
2.5% (36,443)
India
Pennsauken:
3.4% (95)
New Jersey:
8.1% (119,497)
Italy
Pennsauken:
3.0% (86)
New Jersey:
4.0% (58,395)
Sierra Leone
Pennsauken:
2.7% (75)
New Jersey:
0.1% (1,719)
Greece
Pennsauken:
2.5% (70)
New Jersey:
0.8% (12,403)
Bangladesh
Pennsauken:
2.2% (62)
New Jersey:
0.4% (5,929)
China, excluding Hong Kong and Taiwan
Pennsauken:
2.2% (61)
New Jersey:
2.7% (40,092)
Panama
Pennsauken:
1.9% (55)
New Jersey:
0.2% (3,425)
Cambodia
Pennsauken:
1.8% (52)
New Jersey:
0.0% (558)
Venezuela
Pennsauken:
1.8% (51)
New Jersey:
0.3% (5,122)
Nigeria
Pennsauken:
1.7% (47)
New Jersey:
0.6% (8,389)
United Kingdom
Pennsauken:
1.6% (46)
New Jersey:
2.1% (30,355)
Germany
Pennsauken:
1.6% (44)
New Jersey:
2.3% (33,531)
Korea
Pennsauken:
1.5% (43)
New Jersey:
3.5% (51,970)
Place of birth for U.S.-born residents:
This state: 18,408
Other state: 13,217
Northeast: 10,582
Midwest: 327
South: 2,114
West: 194
66% of Pennsauken residents lived in the same house 5 years ago. Out of people who lived in different houses, 61% lived in this county. Out of people who lived in different counties, 43% lived in New Jersey.
Education attainment for males 25 years and older:
No schooling: 162
Nursery to 4th grade: 32
5th and 6th grade: 113
7th and 8th grade: 370
9th grade: 404
10th grade: 482
11th grade: 465
12th grade, no diploma: 578
High school graduate (or equivalency): 3,603
Less than 1 year of college: 747
Some college more than 1 year, no degree: 1,413
Associate degree: 457
Bachelor's degree: 1,269
Master's degree: 295
Professional school degree: 196
Doctorate degree: 80
Education attainment for females 25 years and older:
No schooling: 120
Nursery to 4th grade: 99
5th and 6th grade: 187
7th and 8th grade: 339
9th grade: 367
10th grade: 568
11th grade: 442
12th grade, no diploma: 509
High school graduate (or equivalency): 4,754
Less than 1 year of college: 954
Some college more than 1 year, no degree: 1,585
Associate degree: 697
Bachelor's degree: 1,157
Master's degree: 439
Professional school degree: 83
Doctorate degree: 17
Housing units in structures:
One, detached: 9,254
One, attached: 1,489
Two: 601
3 or 4: 527
5 to 9: 107
10 to 19: 105
20 to 49: 33
50 or more: 733
Mobile homes: 72
Boats, RVs, vans, etc.: 17
Median worth of mobile homes: $49,756
Housing units lacking complete plumbing facilities: 0.4%
Housing units lacking complete kitchen facilities: 0.4%