Paramus, NJ (New Jersey) Houses and Residents
| Paramus: | $705,655 |
| New Jersey: | $428,900 |
Mean price in 2022:
Detached houses: $790,498
Here: $790,498 State: $537,591 Townhouses or other attached units: $675,103
Here: $675,103 State: $381,113 In 2-unit structures: $731,070
Here: $731,070 State: $444,476 In 3-to-4-unit structures: $554,594
Here: $554,594 State: $457,463 In 5-or-more-unit structures: $361,839
Here: $361,839 State: $368,745
Total population: 26,832 (Urban population: 25,737, Rural population: 0)
Houses: 8,956 (8,463 occupied: 6,932 owner occupied, 1,575 renter occupied)
| % of renters here: | 19% |
| State: | 35% |
Housing density: 855 houses/condos per square mile
Median price asked for vacant for-sale houses and condos in 2022: $322,834.
Median contract rent in 2022: over $2,000 (lower quartile is $1,236, upper quartile is over $2,000)
Median rent asked for vacant for-rent units in 2022: $1,038
Median gross rent in Paramus, NJ in 2022: over $2,000
Housing units in Paramus with a mortgage: 4,094 (524 second mortgage, 71 home equity loan, 484 both second mortgage and home equity loan)
Houses without a mortgage: 226
Median household income for houses/condos with a mortgage: $160,227
Median household income for apartments without a mortgage: $109,433
Median monthly housing costs: $2,387
Compare current foreclosures in Paramus, NJ:
| Photo | Address | Area | Beds / Baths | Price | Details |
|---|---|---|---|---|---|

|
#1
Forest Ave
Paramus, NJ 07652
|
2,428 sq. feet
|
3 baths 5 beds |
$749,900
|
show details |

|
#2
Lentz Ave
Paramus, NJ 07652
|
850 sq. feet
|
- baths - beds |
show details | |

|
#3
Spencer Pl
Paramus, NJ 07652
|
2,678 sq. feet
|
- baths - beds |
show details | |

|
#4
Route 17 South
Paramus, NJ 07652
|
- sq. feet
|
- baths - beds |
show details | |

|
#5
Mackay Ave
Paramus, NJ 07652
|
1,452 sq. feet
|
- baths - beds |
show details | |

|
#6
Lincoln Dr
Paramus, NJ 07652
|
2,396 sq. feet
|
- baths - beds |
show details | |

|
#7
Soldier Hill Rd, Apt 1302
Paramus, NJ 07652
|
- sq. feet
|
- baths - beds |
show details | |

|
#8
Midwood Rd
Paramus, NJ 07652
|
3,008 sq. feet
|
- baths - beds |
show details | |

|
#9
Mulberry Ct
Paramus, NJ 07652
|
2,308 sq. feet
|
- baths - beds |
show details | |

|
#10
Knollwood Dr
Paramus, NJ 07652
|
1,625 sq. feet
|
- baths - beds |
show details |
| Photo | Address | Area | Beds / Baths | Price | Details |
|---|---|---|---|---|---|

|
#11
Bailey Rd
Paramus, NJ 07652
|
936 sq. feet
|
- baths - beds |
show details | |

|
#12
N Farview Ave
Paramus, NJ 07652
|
2,487 sq. feet
|
- baths - beds |
show details | |

|
#13
Pascack Rd
Paramus, NJ 07652
|
1,828 sq. feet
|
- baths - beds |
show details | |

|
#14
Split Rock Rd
Paramus, NJ 07652
|
2,951 sq. feet
|
- baths - beds |
show details | |

|
#15
Ferndale Rd
Paramus, NJ 07652
|
1,936 sq. feet
|
- baths - beds |
show details | |

|
#16
Willowbrook Ct
Paramus, NJ 07652
|
2,856 sq. feet
|
- baths - beds |
show details | |

|
#17
Millar Ct
Paramus, NJ 07652
|
1,836 sq. feet
|
- baths - beds |
show details | |

|
#18
Fairview Ter
Paramus, NJ 07652
|
1,606 sq. feet
|
- baths - beds |
show details | |

|
#19
N Fairview Ave
Paramus, NJ 07652
|
4,132 sq. feet
|
- baths - beds |
show details | |

|
#20
Denver Rd
Paramus, NJ 07652
|
2,076 sq. feet
|
- baths - beds |
show details |
| Photo | Address | Area | Beds / Baths | Price | Details |
|---|---|---|---|---|---|

|
#21
Sipporta Lane
Paramus, NJ 07652
|
- sq. feet
|
- baths - beds |
show details | |

|
#22
Forest Ave
Paramus, NJ 07652
|
- sq. feet
|
- baths - beds |
show details | |

|
#23
Oradell Ave
Paramus, NJ 07652
|
- sq. feet
|
- baths - beds |
show details | |

|
#24
Woodcrest Ave
Paramus, NJ 07652
|
1,144 sq. feet
|
- baths - beds |
show details | |

|
#25
Roosevelt Blvd
Paramus, NJ 07652
|
936 sq. feet
|
- baths - beds |
show details | |

|
#26
Morningside Rd
Paramus, NJ 07652
|
2,883 sq. feet
|
- baths - beds |
show details | |

|
#27
E Brook Dr
Paramus, NJ 07652
|
1,908 sq. feet
|
- baths - beds |
show details | |

|
#28
Maplewood Dr
Paramus, NJ 07652
|
2,272 sq. feet
|
- baths - beds |
show details | |

|
#29
Terhune Ave
Paramus, NJ 07652
|
822 sq. feet
|
- baths - beds |
show details | |

|
#30
Willard Rd
Paramus, NJ 07652
|
3,957 sq. feet
|
- baths - beds |
show details |
| Photo | Address | Area | Beds / Baths | Price | Details |
|---|---|---|---|---|---|

|
#31
Truman Ter
Paramus, NJ 07652
|
1,908 sq. feet
|
- baths - beds |
show details | |

|
#32
Arthur Ter
Paramus, NJ 07652
|
2,880 sq. feet
|
- baths - beds |
show details | |

|
#33
Midwood Rd
Paramus, NJ 07652
|
5,836 sq. feet
|
- baths - beds |
show details | |

|
#34
Willard Rd
Paramus, NJ 07652
|
3,957 sq. feet
|
- baths - beds |
show details | |

|
#35
Thomas Dr
Paramus, NJ 07652
|
1,314 sq. feet
|
- baths - beds |
show details | |

|
#36
Harwood Pl
Paramus, NJ 07652
|
2,228 sq. feet
|
- baths - beds |
show details | |

|
#37
Kennedy Ct
Paramus, NJ 07652
|
- sq. feet
|
- baths - beds |
show details | |

|
#38
Mulberry Ct
Paramus, NJ 07652
|
2,332 sq. feet
|
- baths - beds |
show details | |

|
#39
Lawrence Dr
Paramus, NJ 07652
|
4,683 sq. feet
|
- baths - beds |
show details | |

|
#40
Spring Valley Rd
Paramus, NJ 07652
|
1,768 sq. feet
|
- baths - beds |
show details |
| Photo | Address | Area | Beds / Baths | Price | Details |
|---|---|---|---|---|---|

|
#41
Summit Dr
Paramus, NJ 07652
|
- sq. feet
|
- baths - beds |
show details | |

|
#42
Sipporta Ln
Paramus, NJ 07652
|
- sq. feet
|
- baths - beds |
show details | |

|
#43
N State Rt 17
Paramus, NJ 07652
|
- sq. feet
|
- baths - beds |
show details | |

|
#44
S Fairview Ave
Paramus, NJ 07652
|
- sq. feet
|
- baths - beds |
show details | |

|
Check over 1 million property listings on Foreclosure.com!
|
browse all offers | |||

Latest news about housing in Paramus, NJ collected exclusively by city-data.com from local newspapers, TV, and radio stations

 | Townhouses OR Apartments ... Forget about Single Family Homes in NJ (4 replies) |
| Good Condos/Townshouses in Bergen County (0 replies) |
| Comparing Fair Lawn, NJ or River Edge, NJ or Paramus,NJ to buy house (15 replies) |
| Apartments near Paramus/Ridgewood? (25 replies) |
| AZ to Paramus area - I need help finding a home to rent (12 replies) |
| Apartments Near Paramus, NJ (9 replies) |

Median year apartment built: 1981
Household type by relationship:
Households: 26,575- Male householders: 4,129 (494 living alone), Female householders: 4,277 (913 living alone)
5,469 spouses (5,391 opposite-sex spouses), 351 unmarried partners, (303 opposite-sex unmarried partners), 8,335 children (8,096 natural, 177 adopted, 60 stepchildren), 564 grandchildren, 356 brothers or sisters, 802 parents, 5 foster children, 363 other relatives, 285 non-relatives
- In group quarters: 1,629
Size of family households: 2,243 2-persons, 1,742 3-persons, 1,700 4-persons, 608 5-persons, 246 6-persons, 197 7-or-more-persons.
Size of nonfamily households: 1,456 1-person, 231 2-persons, 35 3-persons, 16 4-persons.
3,841 married couples with children.
481 single-parent households (17 men, 464 women).
59.7% of residents of Paramus speak English at home.
9.1% of residents speak Spanish at home (73% speak English very well, 13% speak English well, 10% speak English not well, 5% don't speak English at all).
16.2% of residents speak other Indo-European language at home (71% speak English very well, 20% speak English well, 7% speak English not well, 2% don't speak English at all).
11.9% of residents speak Asian or Pacific Island language at home (55% speak English very well, 22% speak English well, 21% speak English not well, 1% don't speak English at all).
3.1% of residents speak other language at home (61% speak English very well, 30% speak English well, 8% speak English not well).
Foreign born population: 8,302 (31.2%)
(81.5% of them are naturalized citizens)
| Here: | 7.4 |
| State: | 6.8 |
| Here: | 5.4 |
| State: | 3.9 |

- Bedrooms in owner-occupied houses and condos in Paramus, New Jersey
- 8no bedroom
- 991 bedroom
- 3772 bedrooms
- 2,8493 bedrooms
- 2,6734 bedrooms
- 9275+ bedrooms

- Bedrooms in renter-occupied apartments in Paramus, New Jersey
- 184no bedroom
- 2601 bedroom
- 2612 bedrooms
- 3643 bedrooms
- 4304 bedrooms
- 765+ bedrooms

- Cars and other vehicles available in Paramus in owner-occupied houses/condos
- 74no vehicle
- 1,1011 vehicle
- 3,3612 vehicles
- 1,4333 vehicles
- 7524 vehicles
- 2135+ vehicles

- Cars and other vehicles available in Paramus in renter-occupied apartments
- 318no vehicle
- 5911 vehicle
- 5012 vehicles
- 1023 vehicles
- 574 vehicles
- 75+ vehicles

- Rooms in owner-occupied houses in Paramus, New Jersey
- 01 room
- 132 rooms
- 673 rooms
- 2104 rooms
- 7265 rooms
- 8506 rooms
- 1,5657 rooms
- 1,3438 rooms
- 2,1589+ rooms

- Rooms in renter-occupied apartments in Paramus, New Jersey
- 1841 room
- 702 rooms
- 1383 rooms
- 2884 rooms
- 1005 rooms
- 3166 rooms
- 1087 rooms
- 1028 rooms
- 2699+ rooms


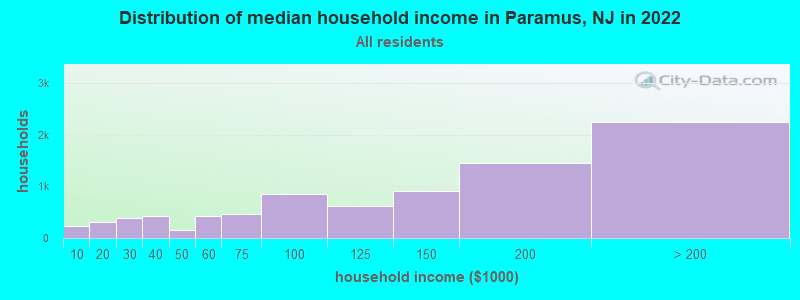
Paramus, NJ household income distribution

- 232Less than $10,000
- 312$10,000 to $19,999
- 389$20,000 to $29,999
- 429$30,000 to $39,999
- 147$40,000 to $49,999
- 429$50,000 to $59,999
- 473$60,000 to $74,999
- 847$75,000 to $99,999
- 622$100,000 to $124,999
- 922$125,000 to $149,999
- 1,450$150,000 to $199,999
- 2,252$200,000 or more
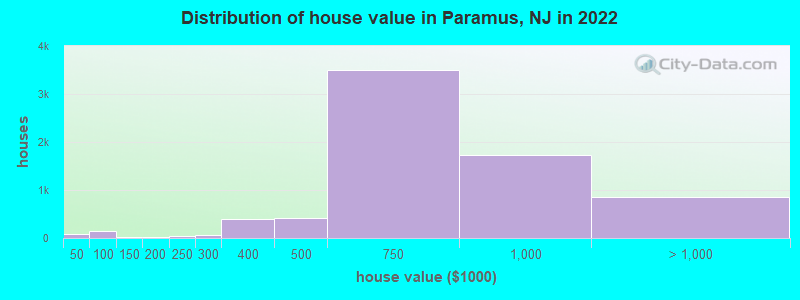
Home value of owner - occupied houses in 2022 in Paramus, NJ
-
- 62Less than $10,000
- 19$40,000 to $49,999
- 72$50,000 to $59,999
- 39$60,000 to $69,999
- 3$70,000 to $79,999
- 7$90,000 to $99,999
- 21$125,000 to $149,999
- 12$150,000 to $174,999
- 35$200,000 to $249,999
- 56$250,000 to $299,999
- 396$300,000 to $399,999
- 408$400,000 to $499,999
- 3,495$500,000 to $749,999
- 1,735$750,000 to $999,999
- 706$1,000,000 to $1,499,999
- 99$1,500,000 to $1,999,999
- 55$2,000,000 or more
Rent paid by renters in 2022 in Paramus, NJ
-
- 75$150 to $199
- 24$500 to $549
- 8$650 to $699
- 99$700 to $749
- 25$800 to $899
- 10$900 to $999
- 163$1,000 to $1,249
- 96$1,250 to $1,499
- 155$1,500 to $1,999
- 113$2,000 to $2,499
- 272$2,500 to $2,999
- 188$3,000 to $3,499
- 206$3,500 or more
- 80No cash rent


Percentage of workers working in this county: 69.6%
Number of people working at home: 3,021 (25.0% of all workers)
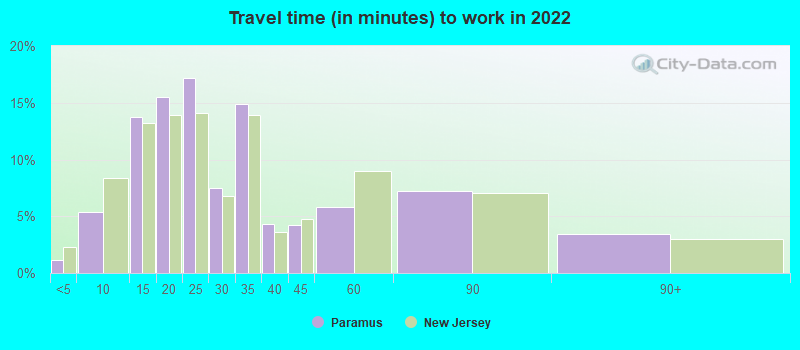
Travel time to work (commute)
- Less than 5 minutes: 206
- 5 to 9 minutes: 801
- 10 to 14 minutes: 1,036
- 15 to 19 minutes: 1,098
- 20 to 24 minutes: 1,628
- 25 to 29 minutes: 630
- 30 to 34 minutes: 908
- 35 to 39 minutes: 219
- 40 to 44 minutes: 209
- 45 to 59 minutes: 976
- 60 to 89 minutes: 1,125
- 90 or more minutes: 308
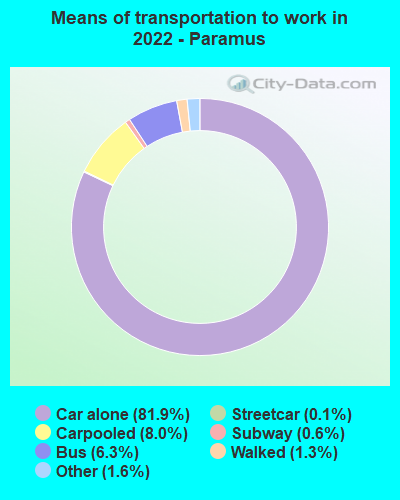
Means of transportation to work:
- Drove a car alone: 25,287 (71.2%)
- Carpooled: 2,981 (8.4%)
- Bus: 1,782 (5.0%)
- Subway or elevated rail: 39 (0.1%)
- Long-distance train or commuter rail: 123 (0.3%)
- Light rail, streetcar or trolley: 3 (0.0%)
- Taxi: 567 (1.6%)
- Walked: 436 (1.2%)
- Worked at home: 3,021 (8.5%)

- Unemployment by race in 2022
- Unemployment rate for White non-Hispanic residents
- 5.9%Males
- 3.4%Females
- Unemployment rate for Black residents
- 5.6%Males
- Unemployment rate for Asian residents
- 8.8%Males
- 5.3%Females
- Unemployment rate for other race residents
- 5.0%Males
- 33.5%Females
- Unemployment rate for two or more race residents
- 9.3%Males
- 3.3%Females
- Unemployment rate for Hispanic or Latino residents
- 10.0%Males
- 7.9%Females

- Year of entry for the foreign-born population in Paramus, New Jersey
- 1,1132010 or later
- 1,4142000 to 2009
- 1,8601990 to 1999
- 1,7341980 to 1989
- 1,2951970 to 1979
- 1,564Before 1970

First ancestries reported:
- Italian: 2,084 (12.5%)
- Irish: 942 (5.7%)
- American: 740 (4.5%)
- Polish: 364 (2.2%)
- German: 338 (2.0%)
- Iranian: 228 (1.4%)
- Greek: 221 (1.3%)
- Austrian: 186 (1.1%)
- Syrian: 146 (0.9%)
- Russian: 139 (0.8%)
- Armenian: 124 (0.7%)
- Arab: 114 (0.7%)
- Albanian: 99 (0.6%)
- Romanian: 95 (0.6%)
- Eastern European: 80 (0.5%)
- English: 77 (0.5%)
- Turkish: 72 (0.4%)
- Croatian: 66 (0.4%)
- Portuguese: 61 (0.4%)
- Ukrainian: 58 (0.3%)
- European: 57 (0.3%)
- Afghan: 57 (0.3%)
- Dutch: 52 (0.3%)
- Scottish: 49 (0.3%)
- Czechoslovakian: 47 (0.3%)
- Israeli: 44 (0.3%)
- Northern European: 38 (0.2%)
- Iraqi: 37 (0.2%)
- Egyptian: 26 (0.2%)
- French Canadian: 23 (0.1%)
- Scotch-Irish: 21 (0.1%)
- Hungarian: 20 (0.1%)
- Lebanese: 19 (0.1%)
- Nigerian: 18 (0.1%)
- Haitian: 18 (0.1%)
- Bulgarian: 16 (0.10%)
- British: 13 (0.08%)
- Moroccan: 12 (0.07%)
- French: 11 (0.07%)
- Brazilian: 11 (0.07%)
- Swedish: 11 (0.07%)
- Lithuanian: 10 (0.06%)
- Guyanese: 9 (0.05%)
- Canadian: 9 (0.05%)
- Jamaican: 9 (0.05%)
- Australian: 7 (0.04%)
- Norwegian: 7 (0.04%)
- Macedonian: 2 (0.01%)
- Kenyan: 1 (0.01%)
- Maltese: 1 (0.01%)
- Yugoslavian: 1 (0.01%)
Most common places of birth for foreign-born residents (%):
| Paramus: | 17.7% (1,471) |
| New Jersey: | 12.8% (274,609) |
| Paramus: | 12.8% (1,065) |
| New Jersey: | 3.3% (70,512) |
| Paramus: | 5.7% (474) |
| New Jersey: | 4.0% (85,934) |
| Paramus: | 4.0% (330) |
| New Jersey: | 1.3% (27,580) |
| Paramus: | 3.9% (326) |
| New Jersey: | 4.2% (90,817) |
| Paramus: | 3.4% (285) |
| New Jersey: | 3.7% (78,969) |
| Paramus: | 2.8% (235) |
| New Jersey: | 0.5% (10,975) |
| Paramus: | 2.7% (226) |
| New Jersey: | 2.7% (58,563) |
| Paramus: | 2.3% (191) |
| New Jersey: | 0.1% (1,939) |
| Paramus: | 2.3% (191) |
| New Jersey: | 0.5% (10,042) |
| Paramus: | 2.1% (177) |
| New Jersey: | 4.4% (95,275) |
| Paramus: | 2.0% (168) |
| New Jersey: | 0.1% (1,929) |
| Paramus: | 2.0% (167) |
| New Jersey: | 1.7% (37,335) |
| Paramus: | 1.9% (159) |
| New Jersey: | 0.8% (16,778) |
| Paramus: | 1.9% (157) |
| New Jersey: | 0.2% (4,947) |
| Paramus: | 1.6% (133) |
| New Jersey: | 0.1% (2,890) |
| Paramus: | 1.6% (131) |
| New Jersey: | 0.9% (20,371) |
| Paramus: | 1.6% (129) |
| New Jersey: | 2.1% (45,435) |
Place of birth for U.S.-born residents:
- This state: 11,496
- Other state: 6,340
- Northeast: 5,248
- Midwest: 170
- South: 671
- West: 237
92.6% of Paramus residents lived in the same house 1 years ago.
Out of people who lived in different houses, 32.3% lived in this county.
Out of people who lived in different counties, 33.5% lived in New Jersey.
| Paramus: | 92.6% |
| State average: | 90.4% |
Education attainment for males 25 years and older:
- No schooling: 111
- Nursery to 4th grade: 0
- 5th and 6th grade: 74
- 7th and 8th grade: 122
- 9th grade: 38
- 10th grade: 48
- 11th grade: 47
- 12th grade, no diploma: 112
- High school graduate (or equivalency): 2,169
- Less than 1 year of college: 598
- Some college more than 1 year, no degree: 876
- Associate degree: 562
- Bachelor's degree: 2,973
- Master's degree: 1,119
- Professional school degree: 393
- Doctorate degree: 246

Education attainment for females 25 years and older:
- No schooling: 138
- Nursery to 4th grade: 63
- 5th and 6th grade: 45
- 7th and 8th grade: 105
- 9th grade: 11
- 10th grade: 40
- 11th grade: 57
- 12th grade, no diploma: 20
- High school graduate (or equivalency): 2,149
- Less than 1 year of college: 851
- Some college more than 1 year, no degree: 897
- Associate degree: 462
- Bachelor's degree: 3,270
- Master's degree: 1,338
- Professional school degree: 241
- Doctorate degree: 260


Housing units in structures:
- One, detached: 7,515
- One, attached: 332
- Two: 319
- 3 or 4: 106
- 5 to 9: 51
- 10 to 19: 10
- 20 to 49: 88
- 50 or more: 525
- Mobile homes: 8
Housing units lacking complete kitchen facilities in 2022: 5.1%
House/condo owner moved in on average 20 years ago
Renter moved in on average 5 years ago

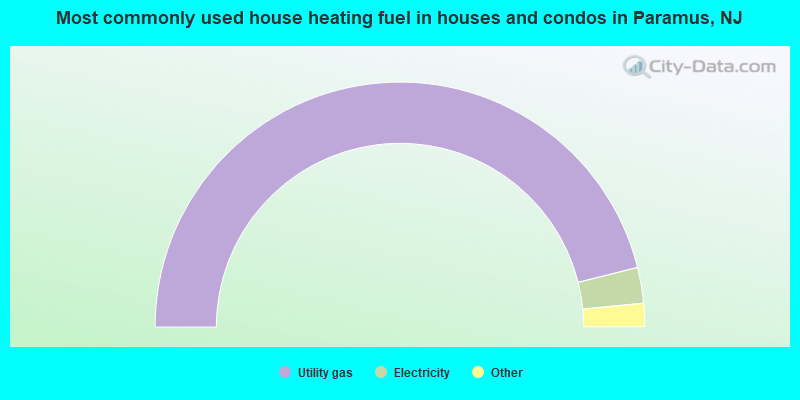
- 92.2%Utility gas
- 4.7%Electricity
- 2.1%Fuel oil, kerosene, etc.
- 0.5%Bottled, tank, or LP gas
- 0.4%No fuel used
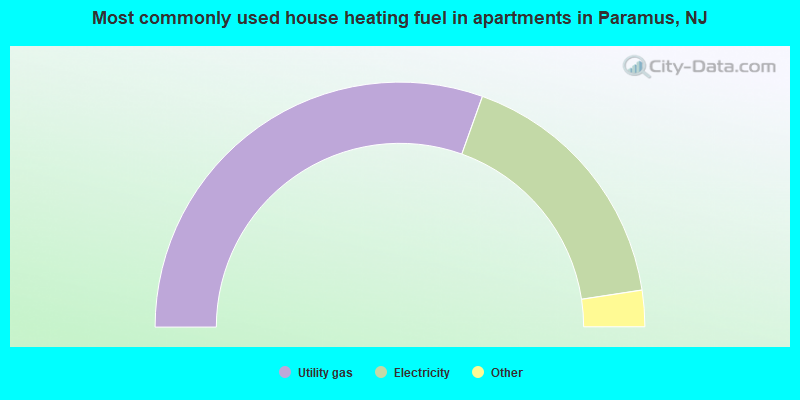
- 61.0%Utility gas
- 34.3%Electricity
- 2.7%Fuel oil, kerosene, etc.
- 1.2%Other fuel
- 0.9%Bottled, tank, or LP gas
Private vs. public school enrollment:
| Here: | 5.4% |
| New Jersey: | 12.3% |
| Here: | 10.7% |
| New Jersey: | 13.1% |
| Here: | 30.8% |
| New Jersey: | 33.2% |


