Olympia, WA (Washington) Houses and Residents
Estimated median house or condo value in 2022: $485,729 (it was $140,700 in 2000 )
Olympia:
$485,729Washington:
$569,500
Lower value quartile - upper value quartile: $407,131 - $640,199Mean price in 2022: Detached houses: $548,985 Here:
$548,985State:
$734,307
Townhouses or other attached units: $486,140 Here:
$486,140State:
$657,697
In 2-unit structures: $327,494 Here:
$327,494State:
$534,634
In 3-to-4-unit structures: $138,797 Here:
$138,797State:
$510,239
In 5-or-more-unit structures: $668,052 Here:
$668,052State:
$503,183
Mobile homes: $84,548 Here:
$84,548State:
$218,362
Total population: 49,218 (Urban population: 42,345, Rural population: 0)
Houses: 26,608 (25,268 occupied: 12,152 owner occupied, 13,024 renter occupied )
% of renters here:
52%State:
36%
Housing density: 1,592 houses/condos per square mile
Median price asked for vacant for-sale houses and condos in 2022: $869,252.
Median contract rent in 2022: $1,377 (lower quartile is $1,076, upper quartile is $1,764)
Median rent asked for vacant for-rent units in 2022: $1,025
Median gross rent in Olympia, WA in 2022: $1,519
Housing units in Olympia with a mortgage: 7,486 (787 second mortgage, 8 home equity loan, 797 both second mortgage and home equity loan )Houses without a mortgage: 290
Median household income for houses/condos with a mortgage: $117,670
Median household income for apartments without a mortgage: $87,883
Median monthly housing costs: $1,524
Data:
Median house or condo value ($)
Median house or condo value ($ change since 2000)
Median house or condo value ($) - White
Median house or condo value ($) - Black or African American
Median house or condo value ($) - Asian
Median house or condo value ($) - Hispanic or Latino
Median house or condo value ($) - American Indian and Alaska Native
Median house or condo value ($) - Multirace
Median house or condo value ($) - Other Race
Median price asked for mobile homes ($)
Household density (households per square mile)
Mean house or condo value by units in structure - 1, detached ($)
Mean house or condo value by units in structure - 1, attached ($)
Mean house or condo value by units in structure - 2 ($)
Mean house or condo value by units in structure by units in structure - 3 or 4 ($)
Mean house or condo value by units in structure - 5 or more ($)
Mean house or condo value by units in structure - Boat, RV, van, etc. ($)
Mean house or condo value by units in structure - Mobile home ($)
Median contract rent ($)
Median contract rent - Lower quartile ($)
Median contract rent - Upper quartile ($)
Median gross rent ($)
Urban houses (%)
Rural houses (%)
Houses occupied (%)
Houses occupied (% change since 2000)
Houses owner occupied (%)
Houses owner occupied (% change since 2000)
Houses renter occupied (%)
Houses renter occupied (% change since 2000)
Vacant housing units - For rent (%)
Vacant housing units - For rent (% change since 2000)
Vacant housing units - For sale only (%)
Vacant housing units - For sale only (% change since 2000)
Vacant housing units - Rented or sold, not occupied (%)
Vacant housing units - Rented or sold, not occupied (% change since 2000)
Vacant housing units - For seasonal, recreational, or occasional use (%)
Vacant housing units - For seasonal, recreational, or occasional use (% change since 2000)
Vacant housing units - For migrant workers (%)
Vacant housing units - For migrant workers (% change since 2000)
Vacant housing units - Other vacant (%)
Vacant housing units - Other vacant (% change since 2000)
Median monthly housing costs ($)
Median household income for houses/condos with a mortgage ($)
Median household income for houses/condos without a mortgage ($)
Median household income ($)
Median household income ($) - White
Median household income ($) - Black or African American
Median household income ($) - Asian
Median household income ($) - Hispanic or Latino
Median household income ($) - American Indian and Alaska Native
Median household income ($) - Multirace
Median household income ($) - Other Race
Mortgage status - with mortgage (%)
Mortgage status - with second mortgage (%)
Mortgage status - with home equity loan (%)
Mortgage status - with both second mortgage and home equity loan (%)
Mortgage status - without a mortgage (%)
Median year house/condo built
Median year apartment built
Household type by relationship - Male householder living alone (%)
Household type by relationship - Male householder not living alone (%)
Household type by relationship - Female householder living alone (%)
Household type by relationship - Female householder not living alone (%)
Household type by relationship - Opposite-Sex spouse (%)
Household type by relationship - Same-Sex spouse (%)
Household type by relationship - Opposite-Sex unmarried partner (%)
Household type by relationship - Same-Sex unmarried partner (%)
Household type by relationship - In group quarters (%)
Size of family households - 2-person household (%)
Size of family households - 3-person household (%)
Size of family households - 4-person household (%)
Size of family households - 5-person household (%)
Size of family households - 6-person household (%)
Size of family households - 7-or-more-person household (%)
Size of nonfamily households - 1-person household (%)
Size of nonfamily households - 2-person household (%)
Size of nonfamily households - 3-person household (%)
Size of nonfamily households - 4-person household (%)
Size of nonfamily households - 5-person household (%)
Size of nonfamily households - 6-person household (%)
Size of nonfamily households - 7-or-moreperson household (%)
Year house built - Built 2010 or later (%)
Year house built - Built 2000 to 2009 (%)
Year house built - Built 1990 to 1999 (%)
Year house built - Built 1980 to 1989 (%)
Year house built - Built 1970 to 1979 (%)
Year house built - Built 1960 to 1969 (%)
Year house built - Built 1950 to 1959 (%)
Year house built - Built 1940 to 1949 (%)
Year house built - Built 1939 or earlier (%)
Median number of rooms in houses and condos
Median number of rooms in apartments
Median number of bedrooms in owner occupied houses
Mean number of bedrooms in owner occupied houses
Median number of bedrooms in renter occupied houses
Mean number of bedrooms in renter occupied houses
Median number of vehichles in owner occupied houses
Mean number of vehichles in owner occupied houses
Median number of vehichles in renter occupied houses
Mean number of vehichles in renter occupied houses
Rooms in owner-occupied houses - 1 room (%)
Rooms in owner-occupied houses - 2 rooms (%)
Rooms in owner-occupied houses - 3 rooms (%)
Rooms in owner-occupied houses - 4 rooms (%)
Rooms in owner-occupied houses - 5 rooms (%)
Rooms in owner-occupied houses - 6 rooms (%)
Rooms in owner-occupied houses - 7 rooms (%)
Rooms in owner-occupied houses - 8 rooms (%)
Rooms in owner-occupied houses - 9+ rooms (%)
Rooms in renter-occupied houses - 1 room (%)
Rooms in renter-occupied houses - 2 rooms (%)
Rooms in renter-occupied houses - 3 rooms (%)
Rooms in renter-occupied houses - 4 rooms (%)
Rooms in renter-occupied houses - 5 rooms (%)
Rooms in renter-occupied houses - 6 rooms (%)
Rooms in renter-occupied houses - 7 rooms (%)
Rooms in renter-occupied houses - 8 rooms (%)
Rooms in renter-occupied houses - 9+ rooms (%)
Bedrooms in owner-occupied houses - no bedrooms (%)
Bedrooms in owner-occupied houses - 1 bedroom (%)
Bedrooms in owner-occupied houses - 2 bedrooms (%)
Bedrooms in owner-occupied houses - 3 bedrooms (%)
Bedrooms in owner-occupied houses - 4 bedrooms (%)
Bedrooms in owner-occupied houses - 5+ bedrooms (%)
Bedrooms in renter-occupied houses - no bedrooms (%)
Bedrooms in renter-occupied houses - 1 bedroom (%)
Bedrooms in renter-occupied houses - 2 bedrooms (%)
Bedrooms in renter-occupied houses - 3 bedrooms (%)
Bedrooms in renter-occupied houses - 4 bedrooms (%)
Bedrooms in renter-occupied houses - 5+ bedrooms (%)
Vehicles available in owner-occupied houses - no vehicle available (%)
Vehicles available in owner-occupied houses - 1 vehicle available(%)
Vehicles available in owner-occupied houses - 2 Vehicles available (%)
Vehicles available in owner-occupied houses - 3 Vehicles available (%)
Vehicles available in owner-occupied houses - 4 Vehicles available (%)
Vehicles available in owner-occupied houses - 5+ Vehicles available (%)
Vehicles available in renter-occupied houses - no vehicle available (%)
Vehicles available in renter-occupied houses - 1 vehicle available (%)
Vehicles available in renter-occupied houses - 2 Vehicles available (%)
Vehicles available in renter-occupied houses - 3 Vehicles available (%)
Vehicles available in renter-occupied houses - 4 Vehicles available (%)
Vehicles available in renter-occupied houses - 5+ Vehicles available (%)
Housing units in structures - 1, detached (%)
Housing units in structures - 1, attached (%)
Housing units in structures - 2 (%)
Housing units in structures - 3 or 4 (%)
Housing units in structures - 5 to 9 (%)
Housing units in structures - 10 to 19 (%)
Housing units in structures - 20 to 49 (%)
Housing units in structures - 50 or more (%)
Housing units in structures - Mobile home (%)
Housing units in structures - Boat, RV, van, etc. (%)
Housing units in structures - Owners - 1, detached (%)
Housing units in structures - Owners - 1, attached (%)
Housing units in structures - Owners - 2 (%)
Housing units in structures - Owners - 3 or 4 (%)
Housing units in structures - Owners - 5 to 9 (%)
Housing units in structures - Owners - 10 to 19 (%)
Housing units in structures - Owners - 20 to 49 (%)
Housing units in structures - Owners - 50 or more (%)
Housing units in structures - Owners - Mobile home (%)
Housing units in structures - Owners - Boat, RV, van, etc. (%)
Housing units in structures - Renters - 1, detached (%)
Housing units in structures - Renters - 1, attached (%)
Housing units in structures - Renters - 2 (%)
Housing units in structures - Renters - 3 or 4 (%)
Housing units in structures - Renters - 5 to 9 (%)
Housing units in structures - Renters - 10 to 19 (%)
Housing units in structures - Renters - 20 to 49 (%)
Housing units in structures - Renters - 50 or more (%)
Housing units in structures - Renters - Mobile home (%)
Housing units in structures - Renters - Boat, RV, van, etc. (%)
House/condo owner moved in on average (years ago)
Renter moved in on average (years ago)
Year householder moved into unit - Moved in 1999 to March 2000 (%)
Year householder moved into unit - Moved in 1999 to March 2000 (%) - White
Year householder moved into unit - Moved in 1999 to March 2000 (%) - Black or African American
Year householder moved into unit - Moved in 1999 to March 2000 (%) - Asian
Year householder moved into unit - Moved in 1999 to March 2000 (%) - Hispanic or Latino
Year householder moved into unit - Moved in 1999 to March 2000 (%) - American Indian and Alaska Native
Year householder moved into unit - Moved in 1999 to March 2000 (%) - Multirace
Year householder moved into unit - Moved in 1999 to March 2000 (%) - Other Race
Year householder moved into unit - Moved in 1995 to 1998 (%)
Year householder moved into unit - Moved in 1995 to 1998 (%) - White
Year householder moved into unit - Moved in 1995 to 1998 (%) - Black or African American
Year householder moved into unit - Moved in 1995 to 1998 (%) - Asian
Year householder moved into unit - Moved in 1995 to 1998 (%) - Hispanic or Latino
Year householder moved into unit - Moved in 1995 to 1998 (%) - American Indian and Alaska Native
Year householder moved into unit - Moved in 1995 to 1998 (%) - Multirace
Year householder moved into unit - Moved in 1995 to 1998 (%) - Other Race
Year householder moved into unit - Moved in 1990 to 1994 (%)
Year householder moved into unit - Moved in 1990 to 1994 (%) - White
Year householder moved into unit - Moved in 1990 to 1994 (%) - Black or African American
Year householder moved into unit - Moved in 1990 to 1994 (%) - Asian
Year householder moved into unit - Moved in 1990 to 1994 (%) - Hispanic or Latino
Year householder moved into unit - Moved in 1990 to 1994 (%) - American Indian and Alaska Native
Year householder moved into unit - Moved in 1990 to 1994 (%) - Multirace
Year householder moved into unit - Moved in 1990 to 1994 (%) - Other Race
Year householder moved into unit - Moved in 1980 to 1989 (%)
Year householder moved into unit - Moved in 1980 to 1989 (%) - White
Year householder moved into unit - Moved in 1980 to 1989 (%) - Black or African American
Year householder moved into unit - Moved in 1980 to 1989 (%) - Asian
Year householder moved into unit - Moved in 1980 to 1989 (%) - Hispanic or Latino
Year householder moved into unit - Moved in 1980 to 1989 (%) - American Indian and Alaska Native
Year householder moved into unit - Moved in 1980 to 1989 (%) - Multirace
Year householder moved into unit - Moved in 1980 to 1989 (%) - Other Race
Year householder moved into unit - Moved in 1970 to 1979 (%)
Year householder moved into unit - Moved in 1970 to 1979 (%) - White
Year householder moved into unit - Moved in 1970 to 1979 (%) - Black or African American
Year householder moved into unit - Moved in 1970 to 1979 (%) - Asian
Year householder moved into unit - Moved in 1970 to 1979 (%) - Hispanic or Latino
Year householder moved into unit - Moved in 1970 to 1979 (%) - American Indian and Alaska Native
Year householder moved into unit - Moved in 1970 to 1979 (%) - Multirace
Year householder moved into unit - Moved in 1970 to 1979 (%) - Other Race
Year householder moved into unit - Moved in 1969 or earlier (%)
Year householder moved into unit - Moved in 1969 or earlier (%) - White
Year householder moved into unit - Moved in 1969 or earlier (%) - Black or African American
Year householder moved into unit - Moved in 1969 or earlier (%) - Asian
Year householder moved into unit - Moved in 1969 or earlier (%) - Hispanic or Latino
Year householder moved into unit - Moved in 1969 or earlier (%) - American Indian and Alaska Native
Year householder moved into unit - Moved in 1969 or earlier (%) - Multirace
Year householder moved into unit - Moved in 1969 or earlier (%) - Other Race
Housing units lacking complete plumbing facilities (%)
Housing units lacking complete kitchen facilities (%)
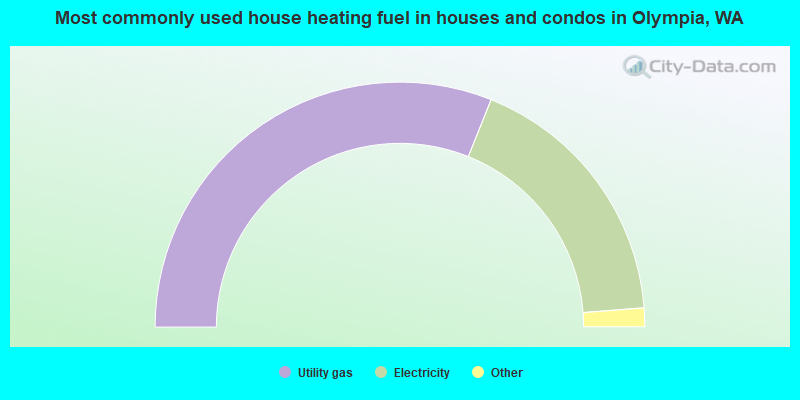
House heating fuel used in houses and condos - Utility gas (%)
House heating fuel used in houses and condos - Bottled, tank, or LP gas (%)
House heating fuel used in houses and condos - Electricity (%)
House heating fuel used in houses and condos - Fuel oil, kerosene, etc. (%)
House heating fuel used in houses and condos - Coal or coke (%)
House heating fuel used in houses and condos - Wood (%)
House heating fuel used in houses and condos - Solar energy (%)
House heating fuel used in houses and condos - Other fuel (%)
House heating fuel used in houses and condos - No fuel used (%)
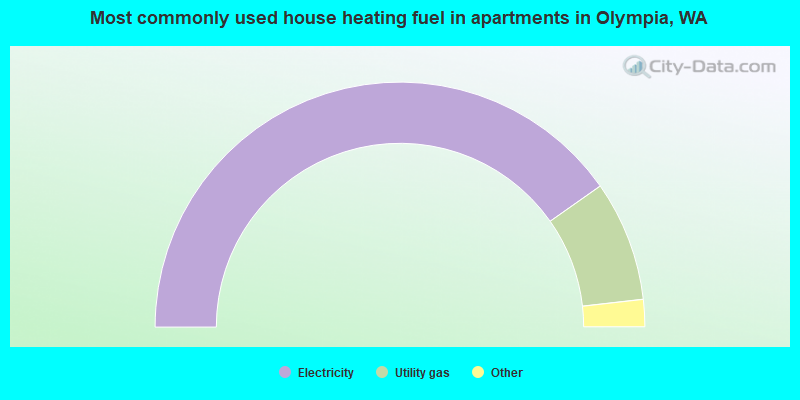
House heating fuel used in apartments - Utility gas (%)
House heating fuel used in apartments - Bottled, tank, or LP gas (%)
House heating fuel used in apartments - Electricity (%)
House heating fuel used in apartments - Fuel oil, kerosene, etc. (%)
House heating fuel used in apartments - Coal or coke (%)
House heating fuel used in apartments - Wood (%)
House heating fuel used in apartments - Solar energy (%)
House heating fuel used in apartments - Other fuel (%)
House heating fuel used in apartments - No fuel used (%)
Latest news about housing in Olympia, WA collected exclusively by city-data.com from local newspapers, TV, and radio stations
Median year house/condo built: 1976Median year apartment built: 1988Household type by relationship:
Households: 55,991
Male householders: 11,179 (3,208 living alone ), Female householders: 13,761 (5,548 living alone )9,002 spouses (8,863 opposite-sex spouses ), 2,485 unmarried partners , (2,276 opposite-sex unmarried partners ), 13,180 children (12,157 natural , 448 adopted , 574 stepchildren ), 488 grandchildren , 423 brothers or sisters , 641 parents , 53 foster children , 400 other relatives , 3,419 non-relatives In group quarters: 955
Size of family households: 6,502 2-persons , 2,610 3-persons , 2,438 4-persons , 711 5-persons , 293 6-persons , 145 7-or-more-persons .
Size of nonfamily households: 9,636 1-person , 2,744 2-persons , 257 3-persons , 180 4-persons .
5,931 married couples with children. single-parent households (833 men , 2,417 women ).
85.7% of residents of Olympia speak English at home. of residents speak Spanish at home (76% speak English very well , 20% speak English well , 4% speak English not well ).of residents speak other Indo-European language at home (91% speak English very well , 9% speak English well ).of residents speak Asian or Pacific Island language at home (55% speak English very well , 24% speak English well , 18% speak English not well , 2% don't speak English at all ).of residents speak other language at home (18% speak English very well , 66% speak English well , 11% speak English not well , 5% don't speak English at all ).
Foreign born population: 5,025 (9.0%)of them are naturalized citizens )
Median number of rooms in houses and condos:
Median number of rooms in apartments
Owner-occupied Renter-occupied
Rooms in owner-occupied houses in Olympia, Washington
23 1 room 40 2 rooms 462 3 rooms 958 4 rooms 2,001 5 rooms 2,778 6 rooms 2,409 7 rooms 1,477 8 rooms 2,005 9+ rooms
Rooms in renter-occupied apartments in Olympia, Washington
754 1 room 1,648 2 rooms 2,070 3 rooms 3,429 4 rooms 2,605 5 rooms 1,306 6 rooms 636 7 rooms 450 8 rooms 126 9+ rooms
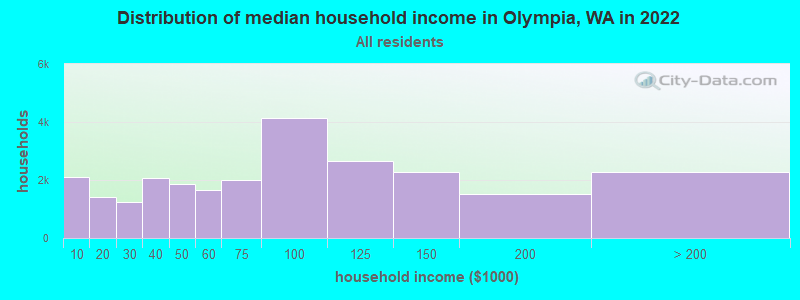
Olympia, WA household income distribution 2,102 Less than $10,0001,431 $10,000 to $19,9991,239 $20,000 to $29,9992,067 $30,000 to $39,9991,877 $40,000 to $49,9991,662 $50,000 to $59,9991,988 $60,000 to $74,9994,148 $75,000 to $99,9992,646 $100,000 to $124,9992,285 $125,000 to $149,9991,506 $150,000 to $199,9992,282 $200,000 or more
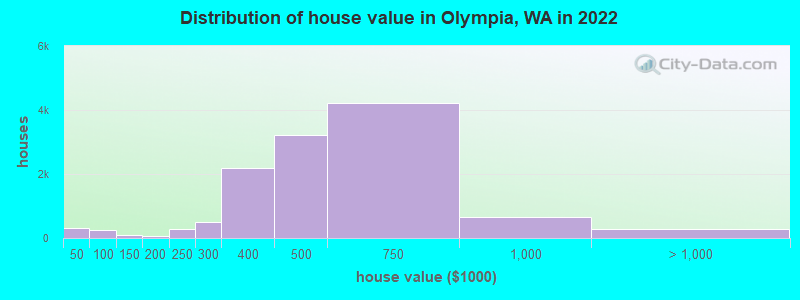
Home value of owner - occupied houses in 2022 in Olympia, WA 65 Less than $10,00020 $10,000 to $14,99939 $15,000 to $19,99912 $20,000 to $24,9997 $25,000 to $29,99937 $30,000 to $34,99916 $35,000 to $39,999104 $40,000 to $49,99937 $50,000 to $59,99955 $60,000 to $69,99921 $80,000 to $89,99923 $90,000 to $99,99934 $100,000 to $124,99952 $125,000 to $149,99915 $150,000 to $174,99955 $175,000 to $199,999295 $200,000 to $249,999487 $250,000 to $299,9992,179 $300,000 to $399,9993,230 $400,000 to $499,9994,228 $500,000 to $749,999670 $750,000 to $999,999198 $1,000,000 to $1,499,99939 $1,500,000 to $1,999,99953 $2,000,000 or moreRent paid by renters in 2022 in Olympia, WA 60 Less than $10018 $100 to $14981 $150 to $199170 $200 to $24968 $250 to $299291 $300 to $349175 $350 to $399262 $450 to $499139 $500 to $54998 $550 to $59971 $600 to $649173 $650 to $699163 $700 to $74968 $750 to $799547 $800 to $899508 $900 to $9992,521 $1,000 to $1,2492,578 $1,250 to $1,4993,424 $1,500 to $1,999997 $2,000 to $2,499249 $2,500 to $2,99929 $3,000 to $3,49977 $3,500 or more302 No cash rent
Percentage of workers working in this county: 87.3%Number of people working at home: 6,800 (25.0% of all workers )
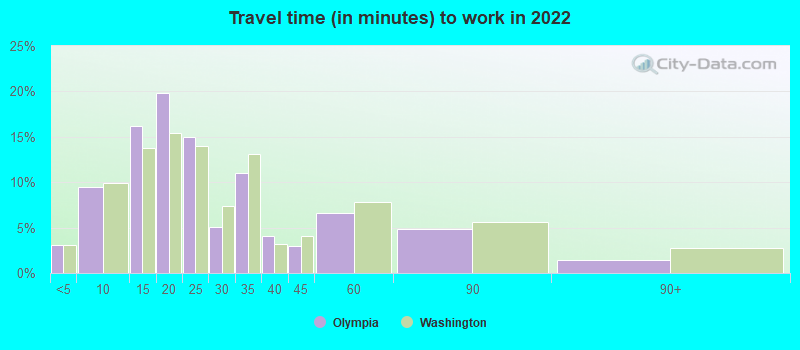
Travel time to work (commute)
Less than 5 minutes: 1,1435 to 9 minutes: 3,44610 to 14 minutes: 4,26615 to 19 minutes: 4,64720 to 24 minutes: 2,28625 to 29 minutes: 72130 to 34 minutes: 1,43835 to 39 minutes: 55340 to 44 minutes: 69345 to 59 minutes: 89260 to 89 minutes: 45890 or more minutes: 306
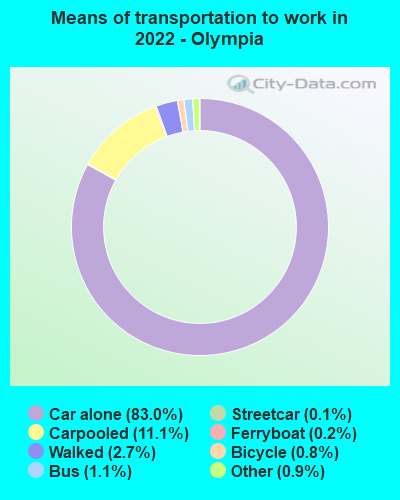
Means of transportation to work:
Drove a car alone: 33,879 (68.5%)Carpooled: 4,318 (8.7%)Bus : 410 (0.8%)Subway or elevated rail : 63 (0.1%)Long-distance train or commuter rail : 16 (0.0%)Light rail, streetcar or trolley : 11 (0.0%)Ferryboat: 75 (0.2%)Taxi: 328 (0.7%)Bicycle: 314 (0.6%)Walked: 2,028 (4.1%)Worked at home: 6,800 (13.7%)
Unemployment by race in 2022
Unemployment rate for White non-Hispanic residents 4.3% Males4.2% FemalesUnemployment rate for Black residents 0.5% Males2.1% FemalesUnemployment rate for American Indian and Alaska Native residents 12.6% FemalesUnemployment rate for Asian residents 2.9% Males7.0% FemalesUnemployment rate for other race residents 2.6% MalesUnemployment rate for two or more race residents 3.9% Males5.0% FemalesUnemployment rate for Hispanic or Latino residents 5.4% Males8.1% Females
Year of entry for the foreign-born population in Olympia, Washington
1,386 2010 or later 1,344 2000 to 2009 899 1990 to 1999 608 1980 to 1989 499 1970 to 1979 660 Before 1970
First ancestries reported:
English: 2,351 (10.0%)
German: 2,106 (8.9%)
European: 1,612 (6.8%)
Irish: 1,588 (6.7%)
American: 974 (4.1%)
Norwegian: 792 (3.4%)
Italian: 449 (1.9%)
Swedish: 427 (1.8%)
Polish: 425 (1.8%)
Scottish: 422 (1.8%)
Scandinavian: 406 (1.7%)
Dutch: 253 (1.1%)
British: 252 (1.1%)
Finnish: 191 (0.8%)
Scotch-Irish: 168 (0.7%)
French: 164 (0.7%)
Northern European: 147 (0.6%)
African: 142 (0.6%)
Danish: 132 (0.6%)
Romanian: 121 (0.5%)
Nigerian: 120 (0.5%)
Eastern European: 111 (0.5%)
Haitian: 109 (0.5%)
Welsh: 100 (0.4%)
British West Indian: 64 (0.3%)
Ukrainian: 53 (0.2%)
Serbian: 48 (0.2%)
Celtic: 44 (0.2%)
Slovak: 39 (0.2%)
Russian: 38 (0.2%)
Turkish: 38 (0.2%)
Lebanese: 36 (0.2%)
Greek: 34 (0.1%)
Canadian: 34 (0.1%)
Czech: 31 (0.1%)
French Canadian: 30 (0.1%)
Cajun: 29 (0.1%)
Slovene: 29 (0.1%)
Swiss: 28 (0.1%)
Czechoslovakian: 28 (0.1%)
Kenyan: 26 (0.1%)
Austrian: 23 (0.10%)
Ethiopian: 17 (0.07%)
Belgian: 14 (0.06%)
Lithuanian: 13 (0.06%)
Albanian: 13 (0.06%)
Croatian: 13 (0.06%)
West Indian: 8 (0.03%)
Hungarian: 6 (0.03%)
Afghan: 6 (0.03%)
Slavic: 3 (0.01%)
Most common places of birth for foreign-born residents (%): Vietnam Olympia:
19.1% (982)Washington:
5.4% (62,003)
Korea Olympia:
9.9% (507)Washington:
4.3% (48,886)
Mexico Olympia:
8.0% (414)Washington:
21.1% (241,655)
India Olympia:
7.2% (369)Washington:
8.9% (101,353)
Philippines Olympia:
6.2% (320)Washington:
6.3% (71,661)
Germany Olympia:
5.8% (296)Washington:
1.6% (17,761)
Honduras Olympia:
4.6% (239)Washington:
0.6% (6,500)
Panama Olympia:
4.2% (217)Washington:
0.1% (1,444)
China, excluding Hong Kong and Taiwan Olympia:
4.2% (216)Washington:
7.4% (84,470)
Peru Olympia:
3.6% (184)Washington:
0.4% (4,914)
Haiti Olympia:
3.1% (157)Washington:
0.2% (2,421)
Canada Olympia:
2.5% (130)Washington:
4.1% (47,238)
England Olympia:
1.7% (90)Washington:
0.8% (9,457)
Place of birth for U.S.-born residents:
This state: 25,339Other state: 23,828Northeast: 3,273Midwest: 4,872South: 4,702West: 10,966 78.7% of Olympia residents lived in the same house 1 years ago.
Out of people who lived in different houses, 32.3% lived in this county.
Out of people who lived in different counties, 46.6% lived in Washington.
Olympia:
78.7%State average:
85.2%
Education attainment for males 25 years and older:
No schooling: 57Nursery to 4th grade: 815th and 6th grade: 07th and 8th grade: 409th grade: 2610th grade: 28411th grade: 21112th grade, no diploma: 145High school graduate (or equivalency): 3,185Less than 1 year of college: 880Some college more than 1 year, no degree: 3,179Associate degree: 2,085Bachelor's degree: 4,965Master's degree: 2,793Professional school degree: 1,055Doctorate degree: 272
Education attainment for females 25 years and older:
No schooling: 112Nursery to 4th grade: 105th and 6th grade: 1127th and 8th grade: 529th grade: 3110th grade: 4811th grade: 18212th grade, no diploma: 251High school graduate (or equivalency): 3,366Less than 1 year of college: 1,911Some college more than 1 year, no degree: 2,745Associate degree: 2,340Bachelor's degree: 6,621Master's degree: 3,427Professional school degree: 323Doctorate degree: 406
Housing units in structures:
One, detached: 13,879One, attached: 1,327Two: 1,1043 or 4: 1,1825 to 9: 1,72210 to 19: 2,07120 to 49: 1,69750 or more: 2,892Mobile homes: 674Boats, RVs, vans, etc.: 55Median worth of mobile homes: $78,550
Housing units lacking complete plumbing facilities in 2022: 0.9%Housing units lacking complete kitchen facilities in 2022: 2.5%House/condo owner moved in on average 12 years ago
Renter moved in on average 3 years ago
Private vs. public school enrollment:
Students in private schools in grades 1 to 8 (elementary and middle school): 209 Here:
4.5%Washington:
12.4%
Students in private schools in grades 9 to 12 (high school): 53 Students in private undergraduate colleges: 181 Here:
7.6%Washington:
16.5%