Olathe, KS (Kansas) Houses and Residents
| Olathe: | $347,100 |
| Kansas: | $206,600 |
Mean price in 2022:
Detached houses: $360,501
Here: $360,501 State: $264,181 Townhouses or other attached units: $269,820
Here: $269,820 State: $219,178 In 2-unit structures: $184,195
Here: $184,195 State: $190,919 In 3-to-4-unit structures: $293,330
Here: $293,330 State: $161,859 In 5-or-more-unit structures: $415,907
Here: $415,907 State: $267,030 Mobile homes: $31,562
Here: $31,562 State: $74,712
Total population: 133,062 (Urban population: 90,479, Rural population: 2,534 (all nonfarm))
Houses: 52,937 (51,804 occupied: 39,464 owner occupied, 12,340 renter occupied)
| % of renters here: | 24% |
| State: | 32% |
Housing density: 977 houses/condos per square mile
Median price asked for vacant for-sale houses and condos in 2022: $282,990.
Median contract rent in 2022: $1,093 (lower quartile is $793, upper quartile is $1,521)
Median rent asked for vacant for-rent units in 2022: $1,097
Median gross rent in Olathe, KS in 2022: $1,314
Housing units in Olathe with a mortgage: 28,919 (2,358 second mortgage, 0 home equity loan, 2,060 both second mortgage and home equity loan)
Houses without a mortgage: 406
Median household income for houses/condos with a mortgage: $124,509
Median household income for apartments without a mortgage: $102,485
Median monthly housing costs: $1,561
Compare current foreclosures in Olathe, KS:
| Photo | Address | Area | Beds / Baths | Price | Details |
|---|---|---|---|---|---|

|
#1
W Prairie Ct
Olathe, KS 66061
|
1,949 sq. feet
|
2 baths 4 beds |
show details | |

|
#2
S Blackfoot Dr
Olathe, KS 66062
|
1,506 sq. feet
|
2 baths 3 beds |
show details | |

|
#3
W 149th
Olathe, KS 66062
|
1,445 sq. feet
|
2 baths 3 beds |
show details | |

|
#4
S Murray Ln
Olathe, KS 66062
|
1,768 sq. feet
|
2 baths 3 beds |
show details | |

|
#5
E Prairie St
Olathe, KS 66061
|
988 sq. feet
|
1 baths 3 beds |
show details | |

|
#6
S Summertree Ln
Olathe, KS 66062
|
1,556 sq. feet
|
2 baths 3 beds |
show details | |

|
#7
S Scarborough St
Olathe, KS 66062
|
1,680 sq. feet
|
3 baths 4 beds |
show details | |

|
#8
E Sheridan Bridge Ln
Olathe, KS 66062
|
1,790 sq. feet
|
2 baths 4 beds |
show details | |

|
#9
N Chestnut St
Olathe, KS 66061
|
739 sq. feet
|
1 baths 2 beds |
show details | |

|
#10
S Winterbrooke Dr
Olathe, KS 66062
|
1,997 sq. feet
|
3 baths 4 beds |
show details |
| Photo | Address | Area | Beds / Baths | Price | Details |
|---|---|---|---|---|---|

|
#11
S Constance St
Olathe, KS 66062
|
3,537 sq. feet
|
4 baths 4 beds |
show details | |

|
#12
N Anne Shirley Dr
Olathe, KS 66061
|
1,734 sq. feet
|
3 baths 3 beds |
show details | |

|
#13
S Locust St
Olathe, KS 66062
|
2,147 sq. feet
|
2 baths 4 beds |
show details | |

|
#14
S Sheridan Cir
Olathe, KS 66061
|
912 sq. feet
|
1 baths 3 beds |
show details | |

|
#15
N Indian Wells Dr
Olathe, KS 66061
|
2,708 sq. feet
|
2 baths 4 beds |
show details | |

|
#16
S Chester Ter
Olathe, KS 66061
|
888 sq. feet
|
1 baths 3 beds |
show details | |

|
#17
S Lindenwood Dr
Olathe, KS 66062
|
1,777 sq. feet
|
2 baths 3 beds |
show details | |

|
#18
W Trail Dr
Olathe, KS 66061
|
2,008 sq. feet
|
2 baths 3 beds |
show details | |

|
#19
N Overlook St
Olathe, KS 66061
|
2,855 sq. feet
|
3 baths 4 beds |
show details | |

|
#20
E Sheridan Bridge Ln
Olathe, KS 66062
|
2,268 sq. feet
|
3 baths 4 beds |
show details |
| Photo | Address | Area | Beds / Baths | Price | Details |
|---|---|---|---|---|---|

|
#21
S Wyandotte Dr
Olathe, KS 66062
|
1,004 sq. feet
|
1 baths 3 beds |
show details | |

|
#22
N Anne Shirley Dr
Olathe, KS 66061
|
1,840 sq. feet
|
3 baths 3 beds |
show details | |

|
#23
E 120th St
Olathe, KS 66061
|
1,268 sq. feet
|
2 baths 3 beds |
show details | |

|
#24
S Brougham Dr
Olathe, KS 66062
|
1,647 sq. feet
|
2 baths 3 beds |
show details | |

|
#25
S Cardiff St
Olathe, KS 66062
|
1,326 sq. feet
|
2 baths 3 beds |
show details | |

|
#26
W 147th Ter
Olathe, KS 66062
|
2,826 sq. feet
|
2 baths 4 beds |
show details | |

|
#27
W 122nd St
Olathe, KS 66062
|
2,519 sq. feet
|
3 baths 4 beds |
show details | |

|
#28
S Ferrel Dr
Olathe, KS 66061
|
1,182 sq. feet
|
2 baths 3 beds |
show details | |

|
#29
W Elizabeth St
Olathe, KS 66061
|
1,535 sq. feet
|
2 baths 3 beds |
show details | |

|
#30
E Penrose Ln
Olathe, KS 66062
|
984 sq. feet
|
1 baths 2 beds |
show details |
| Photo | Address | Area | Beds / Baths | Price | Details |
|---|---|---|---|---|---|

|
#31
S Hallet Ct
Olathe, KS 66062
|
2,763 sq. feet
|
3 baths 5 beds |
show details | |

|
#32
E Northview St
Olathe, KS 66061
|
1,456 sq. feet
|
2 baths 3 beds |
show details | |

|
#33
W 121st Pl
Olathe, KS 66061
|
2,395 sq. feet
|
3 baths 4 beds |
show details | |

|
#34
W 147th Dr
Olathe, KS 66062
|
1,750 sq. feet
|
2 baths 4 beds |
show details | |

|
#35
W 125th St
Olathe, KS 66061
|
2,014 sq. feet
|
2 baths 4 beds |
show details | |

|
#36
E Sheridan St
Olathe, KS 66062
|
1,205 sq. feet
|
1 baths 3 beds |
show details | |

|
#37
E Cothrell St
Olathe, KS 66061
|
1,377 sq. feet
|
2 baths 3 beds |
show details | |

|
#38
W Cedar St
Olathe, KS 66061
|
999 sq. feet
|
1 baths 2 beds |
show details | |

|
#39
S Curtis
Olathe, KS 66062
|
1,836 sq. feet
|
2 baths 3 beds |
show details | |

|
#40
E Cedar St
Olathe, KS 66061
|
816 sq. feet
|
1 baths 2 beds |
show details |
| Photo | Address | Area | Beds / Baths | Price | Details |
|---|---|---|---|---|---|

|
#41
W 160th Ter
Olathe, KS 66062
|
1,493 sq. feet
|
2 baths 3 beds |
show details | |

|
#42
E Bristol Ln
Olathe, KS 66061
|
1,440 sq. feet
|
1 baths 3 beds |
show details | |

|
#43
S Rene Ct
Olathe, KS 66062
|
3,512 sq. feet
|
4 baths 4 beds |
show details | |

|
#44
E Oakview St
Olathe, KS 66061
|
1,510 sq. feet
|
2 baths 3 beds |
show details | |

|
#45
W 143rd Ter
Olathe, KS 66061
|
2,915 sq. feet
|
3 baths 4 beds |
show details | |

|
#46
S Pine St
Olathe, KS 66061
|
1,618 sq. feet
|
1 baths 3 beds |
show details | |

|
#47
N Walnut St
Olathe, KS 66061
|
1,260 sq. feet
|
1 baths 3 beds |
show details | |

|
#48
S Tomahawk Ln
Olathe, KS 66062
|
1,472 sq. feet
|
2 baths 3 beds |
show details | |

|
#49
W Wabash St
Olathe, KS 66061
|
1,651 sq. feet
|
2 baths 3 beds |
show details | |

|
Check over 1 million property listings on Foreclosure.com!
|
browse all offers | |||

Latest news about housing in Olathe, KS collected exclusively by city-data.com from local newspapers, TV, and radio stations

 | Kansas Heat (20 replies) |
| Wardcraft Homes (20 replies) |
| Kansas Job Losses (390 replies) |
| Living here sucks...here's why (120 replies) |
| Think about moving to Wichita from Denver Colorado (40 replies) |
| News: "Brownback signs Kansas budget and orders $97 million in allotment cuts, slashing KU funding" (111 replies) |

Median year apartment built: 1990
Household type by relationship:
Households: 145,597- Male householders: 25,340 (4,831 living alone), Female householders: 26,464 (6,062 living alone)
30,407 spouses (30,105 opposite-sex spouses), 2,398 unmarried partners, (2,398 opposite-sex unmarried partners), 47,385 children (42,835 natural, 1,337 adopted, 3,213 stepchildren), 1,509 grandchildren, 1,293 brothers or sisters, 1,572 parents, 257 foster children, 1,900 other relatives, 5,317 non-relatives
- In group quarters: 1,755
Size of family households: 16,938 2-persons, 7,035 3-persons, 9,530 4-persons, 2,873 5-persons, 1,456 6-persons, 865 7-or-more-persons.
Size of nonfamily households: 10,893 1-person, 1,965 2-persons, 145 4-persons, 55 5-persons, 49 7-or-more-persons.
29,583 married couples with children.
6,175 single-parent households (1,687 men, 4,488 women).
85.8% of residents of Olathe speak English at home.
7.4% of residents speak Spanish at home (64% speak English very well, 19% speak English well, 11% speak English not well, 6% don't speak English at all).
2.1% of residents speak other Indo-European language at home (67% speak English very well, 20% speak English well, 12% speak English not well, 1% don't speak English at all).
2.6% of residents speak Asian or Pacific Island language at home (54% speak English very well, 21% speak English well, 16% speak English not well, 9% don't speak English at all).
1.7% of residents speak other language at home (71% speak English very well, 27% speak English well, 2% speak English not well).
Foreign born population: 13,825 (9.5%)
(53.9% of them are naturalized citizens)
| Here: | 7.4 |
| State: | 6.9 |
| Here: | 4.4 |
| State: | 4.4 |

- Bedrooms in owner-occupied houses and condos in Olathe, Kansas
- 46no bedroom
- 5481 bedroom
- 1,8772 bedrooms
- 13,7073 bedrooms
- 18,2824 bedrooms
- 5,0045+ bedrooms

- Bedrooms in renter-occupied apartments in Olathe, Kansas
- 371no bedroom
- 3,2231 bedroom
- 5,0492 bedrooms
- 2,8673 bedrooms
- 6024 bedrooms
- 2285+ bedrooms

- Cars and other vehicles available in Olathe in owner-occupied houses/condos
- 577no vehicle
- 7,1211 vehicle
- 21,6382 vehicles
- 7,8883 vehicles
- 1,6894 vehicles
- 5515+ vehicles

- Cars and other vehicles available in Olathe in renter-occupied apartments
- 1,582no vehicle
- 6,0801 vehicle
- 2,8622 vehicles
- 1,3773 vehicles
- 3774 vehicles
- 625+ vehicles

- Rooms in owner-occupied houses in Olathe, Kansas
- 461 room
- 2072 rooms
- 843 rooms
- 1,1044 rooms
- 3,5905 rooms
- 7,6736 rooms
- 7,4397 rooms
- 7,0098 rooms
- 12,3129+ rooms

- Rooms in renter-occupied apartments in Olathe, Kansas
- 3241 room
- 1,2182 rooms
- 1,6533 rooms
- 3,3074 rooms
- 2,7215 rooms
- 1,6926 rooms
- 5317 rooms
- 768 rooms
- 8189+ rooms


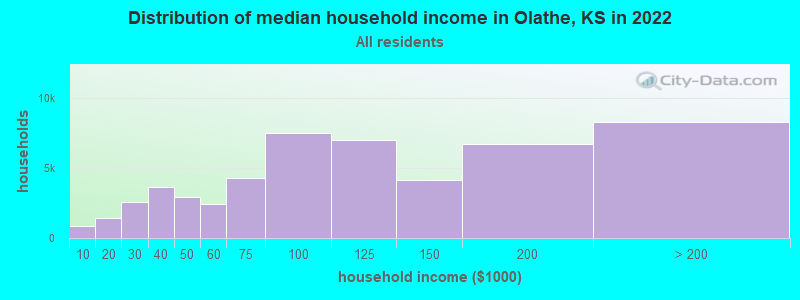
Olathe, KS household income distribution

- 859Less than $10,000
- 1,435$10,000 to $19,999
- 2,566$20,000 to $29,999
- 3,618$30,000 to $39,999
- 2,906$40,000 to $49,999
- 2,419$50,000 to $59,999
- 4,313$60,000 to $74,999
- 7,492$75,000 to $99,999
- 7,033$100,000 to $124,999
- 4,117$125,000 to $149,999
- 6,741$150,000 to $199,999
- 8,305$200,000 or more
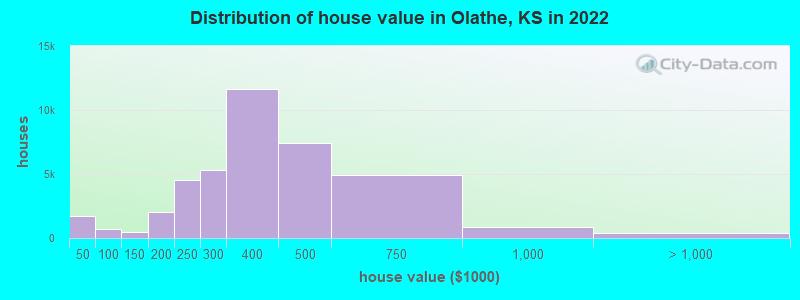
Home value of owner - occupied houses in 2022 in Olathe, KS
-
- 256Less than $10,000
- 192$20,000 to $24,999
- 305$25,000 to $29,999
- 472$30,000 to $34,999
- 44$35,000 to $39,999
- 412$40,000 to $49,999
- 212$50,000 to $59,999
- 79$90,000 to $99,999
- 297$100,000 to $124,999
- 134$125,000 to $149,999
- 854$150,000 to $174,999
- 1,177$175,000 to $199,999
- 4,493$200,000 to $249,999
- 5,314$250,000 to $299,999
- 11,647$300,000 to $399,999
- 7,423$400,000 to $499,999
- 4,892$500,000 to $749,999
- 855$750,000 to $999,999
- 318$1,000,000 to $1,499,999
- 46$1,500,000 to $1,999,999
- 42$2,000,000 or more
Rent paid by renters in 2022 in Olathe, KS
-
- 70Less than $100
- 49$300 to $349
- 167$350 to $399
- 90$400 to $449
- 265$450 to $499
- 316$500 to $549
- 299$550 to $599
- 511$600 to $649
- 586$650 to $699
- 176$700 to $749
- 627$750 to $799
- 899$800 to $899
- 1,074$900 to $999
- 2,729$1,000 to $1,249
- 1,270$1,250 to $1,499
- 2,199$1,500 to $1,999
- 444$2,000 to $2,499
- 54$2,500 to $2,999
- 467$3,500 or more
- 48No cash rent


Percentage of workers working in this county: 85.0%
Number of people working at home: 16,891 (21.8% of all workers)
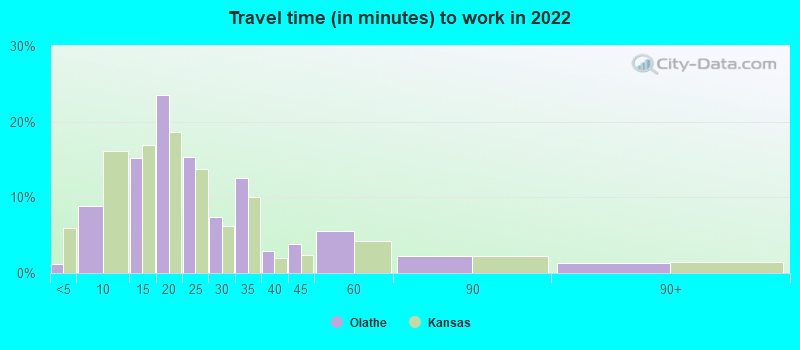
Travel time to work (commute)
- Less than 5 minutes: 683
- 5 to 9 minutes: 5,737
- 10 to 14 minutes: 9,305
- 15 to 19 minutes: 13,453
- 20 to 24 minutes: 12,114
- 25 to 29 minutes: 5,273
- 30 to 34 minutes: 4,807
- 35 to 39 minutes: 1,748
- 40 to 44 minutes: 1,280
- 45 to 59 minutes: 2,029
- 60 to 89 minutes: 765
- 90 or more minutes: 296
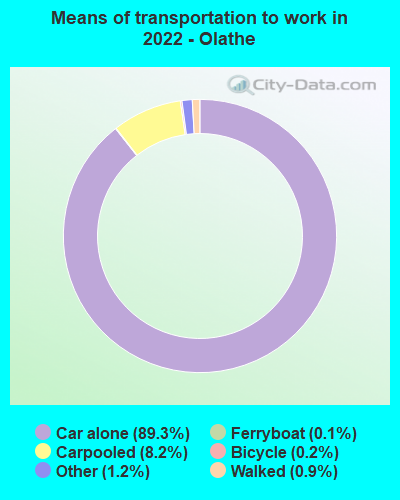
Means of transportation to work:
- Drove a car alone: 49,247 (68.5%)
- Carpooled: 4,246 (5.9%)
- Bus: 56 (0.1%)
- Ferryboat: 193 (0.3%)
- Taxi: 1,071 (1.5%)
- Bicycle: 105 (0.1%)
- Walked: 530 (0.7%)
- Worked at home: 16,891 (23.5%)

- Unemployment by race in 2022
- Unemployment rate for White non-Hispanic residents
- 1.4%Males
- 1.5%Females
- Unemployment rate for Black residents
- 12.3%Males
- 6.8%Females
- Unemployment rate for American Indian and Alaska Native residents
- 9.2%Males
- Unemployment rate for Asian residents
- 3.8%Males
- 6.0%Females
- Unemployment rate for other race residents
- 1.9%Males
- 6.8%Females
- Unemployment rate for two or more race residents
- 9.3%Males
- 7.7%Females
- Unemployment rate for Hispanic or Latino residents
- 4.3%Males
- 8.5%Females

- Year of entry for the foreign-born population in Olathe, Kansas
- 5,4872010 or later
- 4,9842000 to 2009
- 2,8681990 to 1999
- 1,1861980 to 1989
- 6481970 to 1979
- 414Before 1970
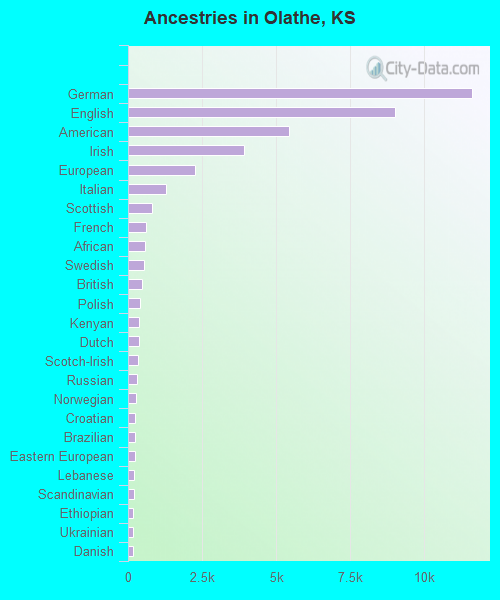
First ancestries reported:
- German: 11,599 (18.2%)
- English: 9,013 (14.1%)
- American: 5,442 (8.5%)
- Irish: 3,923 (6.2%)
- European: 2,266 (3.6%)
- Italian: 1,287 (2.0%)
- Scottish: 804 (1.3%)
- French: 597 (0.9%)
- African: 563 (0.9%)
- Swedish: 546 (0.9%)
- British: 469 (0.7%)
- Polish: 421 (0.7%)
- Kenyan: 369 (0.6%)
- Dutch: 364 (0.6%)
- Scotch-Irish: 344 (0.5%)
- Russian: 294 (0.5%)
- Norwegian: 274 (0.4%)
- Croatian: 244 (0.4%)
- Brazilian: 231 (0.4%)
- Eastern European: 228 (0.4%)
- Lebanese: 193 (0.3%)
- Scandinavian: 192 (0.3%)
- Ethiopian: 173 (0.3%)
- Ukrainian: 171 (0.3%)
- Danish: 168 (0.3%)
- Nigerian: 145 (0.2%)
- Canadian: 141 (0.2%)
- Austrian: 140 (0.2%)
- Iranian: 123 (0.2%)
- French Canadian: 95 (0.1%)
- Armenian: 91 (0.1%)
- Czech: 90 (0.1%)
- Welsh: 89 (0.1%)
- Palestinian: 88 (0.1%)
- Hungarian: 81 (0.1%)
- Swiss: 78 (0.1%)
- Haitian: 78 (0.1%)
- Slovak: 74 (0.1%)
- Arab: 69 (0.1%)
- Northern European: 53 (0.08%)
- Belgian: 49 (0.08%)
- Greek: 42 (0.07%)
- Jordanian: 41 (0.06%)
- German Russian: 35 (0.05%)
- Basque: 28 (0.04%)
- Pennsylvania German: 27 (0.04%)
- Finnish: 25 (0.04%)
- Czechoslovakian: 24 (0.04%)
- Celtic: 24 (0.04%)
- Bulgarian: 24 (0.04%)
- Syrian: 18 (0.03%)
- Cajun: 17 (0.03%)
- Slavic: 11 (0.02%)
- Liberian: 10 (0.02%)
- Jamaican: 10 (0.02%)
- Albanian: 9 (0.01%)
- Lithuanian: 8 (0.01%)
- Turkish: 6 (0.01%)
- Yugoslavian: 4 (0.01%)
Most common places of birth for foreign-born residents (%):
| Olathe: | 27.6% (4,227) |
| Kansas: | 39.2% (81,282) |
| Olathe: | 7.5% (1,153) |
| Kansas: | 6.5% (13,547) |
| Olathe: | 6.8% (1,045) |
| Kansas: | 1.6% (3,322) |
| Olathe: | 5.3% (805) |
| Kansas: | 5.5% (11,323) |
| Olathe: | 4.5% (693) |
| Kansas: | 0.9% (1,901) |
| Olathe: | 3.6% (548) |
| Kansas: | 3.5% (7,355) |
| Olathe: | 3.4% (528) |
| Kansas: | 0.9% (1,963) |
| Olathe: | 2.9% (442) |
| Kansas: | 3.9% (8,053) |
| Olathe: | 2.6% (399) |
| Kansas: | 0.7% (1,401) |
| Olathe: | 2.2% (340) |
| Kansas: | 1.2% (2,585) |
| Olathe: | 2.0% (303) |
| Kansas: | 0.2% (518) |
| Olathe: | 1.7% (262) |
| Kansas: | 0.3% (722) |
| Olathe: | 1.6% (240) |
| Kansas: | 0.5% (950) |
Place of birth for U.S.-born residents:
- This state: 65,069
- Other state: 65,379
- Northeast: 4,465
- Midwest: 36,980
- South: 13,826
- West: 10,108
90.4% of Olathe residents lived in the same house 1 years ago.
Out of people who lived in different houses, 43.2% lived in this county.
Out of people who lived in different counties, 42.3% lived in Kansas.
| Olathe: | 90.4% |
| State average: | 85.3% |
Education attainment for males 25 years and older:
- No schooling: 453
- Nursery to 4th grade: 129
- 5th and 6th grade: 178
- 7th and 8th grade: 296
- 9th grade: 388
- 10th grade: 200
- 11th grade: 91
- 12th grade, no diploma: 801
- High school graduate (or equivalency): 7,008
- Less than 1 year of college: 2,498
- Some college more than 1 year, no degree: 5,838
- Associate degree: 3,118
- Bachelor's degree: 14,392
- Master's degree: 7,436
- Professional school degree: 1,153
- Doctorate degree: 620

Education attainment for females 25 years and older:
- No schooling: 490
- Nursery to 4th grade: 108
- 5th and 6th grade: 312
- 7th and 8th grade: 520
- 9th grade: 107
- 10th grade: 496
- 11th grade: 184
- 12th grade, no diploma: 375
- High school graduate (or equivalency): 8,052
- Less than 1 year of college: 3,820
- Some college more than 1 year, no degree: 6,558
- Associate degree: 4,855
- Bachelor's degree: 14,853
- Master's degree: 7,334
- Professional school degree: 931
- Doctorate degree: 839


Housing units in structures:
- One, detached: 38,151
- One, attached: 4,903
- Two: 519
- 3 or 4: 1,754
- 5 to 9: 2,014
- 10 to 19: 1,854
- 20 to 49: 1,257
- 50 or more: 1,719
- Mobile homes: 766
Median worth of mobile homes: $40,100
Housing units lacking complete kitchen facilities in 2022: 1.1%
House/condo owner moved in on average 9 years ago
Renter moved in on average 3 years ago

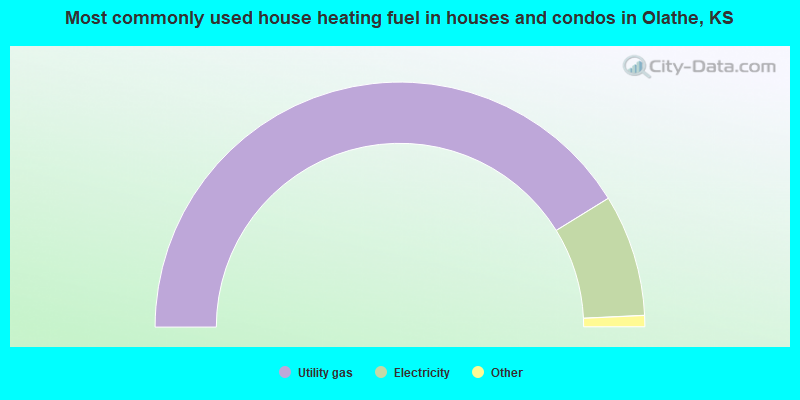
- 82.4%Utility gas
- 16.1%Electricity
- 1.0%Bottled, tank, or LP gas
- 0.3%Other fuel
- 0.2%Fuel oil, kerosene, etc.
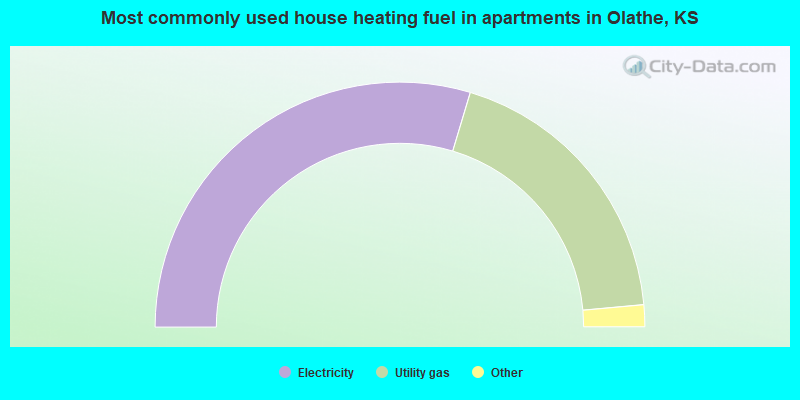
- 59.3%Electricity
- 37.8%Utility gas
- 1.4%No fuel used
- 1.3%Bottled, tank, or LP gas
- 0.1%Fuel oil, kerosene, etc.
Private vs. public school enrollment:
| Here: | 15.0% |
| Kansas: | 14.1% |
| Here: | 13.0% |
| Kansas: | 10.8% |
| Here: | 17.4% |
| Kansas: | 15.4% |


