Oakland, NJ (New Jersey) Houses and Residents
Estimated median house or condo value in 2022: $552,220 (it was $245,400 in 2000 )
Oakland:
$552,220New Jersey:
$428,900
Lower value quartile - upper value quartile: $437,801 - $667,255Total population: 13,046 (Urban population: 11,456, Rural population: 1,010 (all nonfarm) )
Houses: 4,734 (4,408 occupied: 4,035 owner occupied, 396 renter occupied )
% of renters here:
9%State:
35%
Housing density: 550 houses/condos per square mile
Median price asked for vacant for-sale houses and condos in 2022: $628,271.
Median contract rent in 2022: $1,300 (lower quartile is $1,077, upper quartile is over $2,000)
Median rent asked for vacant for-rent units in 2022: $1,420
Median gross rent in Oakland, NJ in 2022: $1,495
Housing units in Oakland with a mortgage: 2,855 (472 second mortgage, 31 home equity loan, 436 both second mortgage and home equity loan )Houses without a mortgage: 148
Median household income for houses/condos with a mortgage: $187,632
Median household income for apartments without a mortgage: $106,693
Median monthly housing costs: $2,680
Data:
Median house or condo value ($)
Median house or condo value ($ change since 2000)
Median house or condo value ($) - White
Median house or condo value ($) - Black or African American
Median house or condo value ($) - Asian
Median house or condo value ($) - Hispanic or Latino
Median house or condo value ($) - American Indian and Alaska Native
Median house or condo value ($) - Multirace
Median house or condo value ($) - Other Race
Median price asked for mobile homes ($)
Household density (households per square mile)
Mean house or condo value by units in structure - 1, detached ($)
Mean house or condo value by units in structure - 1, attached ($)
Mean house or condo value by units in structure - 2 ($)
Mean house or condo value by units in structure by units in structure - 3 or 4 ($)
Mean house or condo value by units in structure - 5 or more ($)
Mean house or condo value by units in structure - Boat, RV, van, etc. ($)
Mean house or condo value by units in structure - Mobile home ($)
Median contract rent ($)
Median contract rent - Lower quartile ($)
Median contract rent - Upper quartile ($)
Median gross rent ($)
Urban houses (%)
Rural houses (%)
Houses occupied (%)
Houses occupied (% change since 2000)
Houses owner occupied (%)
Houses owner occupied (% change since 2000)
Houses renter occupied (%)
Houses renter occupied (% change since 2000)
Vacant housing units - For rent (%)
Vacant housing units - For rent (% change since 2000)
Vacant housing units - For sale only (%)
Vacant housing units - For sale only (% change since 2000)
Vacant housing units - Rented or sold, not occupied (%)
Vacant housing units - Rented or sold, not occupied (% change since 2000)
Vacant housing units - For seasonal, recreational, or occasional use (%)
Vacant housing units - For seasonal, recreational, or occasional use (% change since 2000)
Vacant housing units - For migrant workers (%)
Vacant housing units - For migrant workers (% change since 2000)
Vacant housing units - Other vacant (%)
Vacant housing units - Other vacant (% change since 2000)
Median monthly housing costs ($)
Median household income for houses/condos with a mortgage ($)
Median household income for houses/condos without a mortgage ($)
Median household income ($)
Median household income ($) - White
Median household income ($) - Black or African American
Median household income ($) - Asian
Median household income ($) - Hispanic or Latino
Median household income ($) - American Indian and Alaska Native
Median household income ($) - Multirace
Median household income ($) - Other Race
Mortgage status - with mortgage (%)
Mortgage status - with second mortgage (%)
Mortgage status - with home equity loan (%)
Mortgage status - with both second mortgage and home equity loan (%)
Mortgage status - without a mortgage (%)
Median year house/condo built
Median year apartment built
Household type by relationship - Male householder living alone (%)
Household type by relationship - Male householder not living alone (%)
Household type by relationship - Female householder living alone (%)
Household type by relationship - Female householder not living alone (%)
Household type by relationship - Opposite-Sex spouse (%)
Household type by relationship - Same-Sex spouse (%)
Household type by relationship - Opposite-Sex unmarried partner (%)
Household type by relationship - Same-Sex unmarried partner (%)
Household type by relationship - In group quarters (%)
Size of family households - 2-person household (%)
Size of family households - 3-person household (%)
Size of family households - 4-person household (%)
Size of family households - 5-person household (%)
Size of family households - 6-person household (%)
Size of family households - 7-or-more-person household (%)
Size of nonfamily households - 1-person household (%)
Size of nonfamily households - 2-person household (%)
Size of nonfamily households - 3-person household (%)
Size of nonfamily households - 4-person household (%)
Size of nonfamily households - 5-person household (%)
Size of nonfamily households - 6-person household (%)
Size of nonfamily households - 7-or-moreperson household (%)
Year house built - Built 2010 or later (%)
Year house built - Built 2000 to 2009 (%)
Year house built - Built 1990 to 1999 (%)
Year house built - Built 1980 to 1989 (%)
Year house built - Built 1970 to 1979 (%)
Year house built - Built 1960 to 1969 (%)
Year house built - Built 1950 to 1959 (%)
Year house built - Built 1940 to 1949 (%)
Year house built - Built 1939 or earlier (%)
Median number of rooms in houses and condos
Median number of rooms in apartments
Median number of bedrooms in owner occupied houses
Mean number of bedrooms in owner occupied houses
Median number of bedrooms in renter occupied houses
Mean number of bedrooms in renter occupied houses
Median number of vehichles in owner occupied houses
Mean number of vehichles in owner occupied houses
Median number of vehichles in renter occupied houses
Mean number of vehichles in renter occupied houses
Rooms in owner-occupied houses - 1 room (%)
Rooms in owner-occupied houses - 2 rooms (%)
Rooms in owner-occupied houses - 3 rooms (%)
Rooms in owner-occupied houses - 4 rooms (%)
Rooms in owner-occupied houses - 5 rooms (%)
Rooms in owner-occupied houses - 6 rooms (%)
Rooms in owner-occupied houses - 7 rooms (%)
Rooms in owner-occupied houses - 8 rooms (%)
Rooms in owner-occupied houses - 9+ rooms (%)
Rooms in renter-occupied houses - 1 room (%)
Rooms in renter-occupied houses - 2 rooms (%)
Rooms in renter-occupied houses - 3 rooms (%)
Rooms in renter-occupied houses - 4 rooms (%)
Rooms in renter-occupied houses - 5 rooms (%)
Rooms in renter-occupied houses - 6 rooms (%)
Rooms in renter-occupied houses - 7 rooms (%)
Rooms in renter-occupied houses - 8 rooms (%)
Rooms in renter-occupied houses - 9+ rooms (%)
Bedrooms in owner-occupied houses - no bedrooms (%)
Bedrooms in owner-occupied houses - 1 bedroom (%)
Bedrooms in owner-occupied houses - 2 bedrooms (%)
Bedrooms in owner-occupied houses - 3 bedrooms (%)
Bedrooms in owner-occupied houses - 4 bedrooms (%)
Bedrooms in owner-occupied houses - 5+ bedrooms (%)
Bedrooms in renter-occupied houses - no bedrooms (%)
Bedrooms in renter-occupied houses - 1 bedroom (%)
Bedrooms in renter-occupied houses - 2 bedrooms (%)
Bedrooms in renter-occupied houses - 3 bedrooms (%)
Bedrooms in renter-occupied houses - 4 bedrooms (%)
Bedrooms in renter-occupied houses - 5+ bedrooms (%)
Vehicles available in owner-occupied houses - no vehicle available (%)
Vehicles available in owner-occupied houses - 1 vehicle available(%)
Vehicles available in owner-occupied houses - 2 Vehicles available (%)
Vehicles available in owner-occupied houses - 3 Vehicles available (%)
Vehicles available in owner-occupied houses - 4 Vehicles available (%)
Vehicles available in owner-occupied houses - 5+ Vehicles available (%)
Vehicles available in renter-occupied houses - no vehicle available (%)
Vehicles available in renter-occupied houses - 1 vehicle available (%)
Vehicles available in renter-occupied houses - 2 Vehicles available (%)
Vehicles available in renter-occupied houses - 3 Vehicles available (%)
Vehicles available in renter-occupied houses - 4 Vehicles available (%)
Vehicles available in renter-occupied houses - 5+ Vehicles available (%)
Housing units in structures - 1, detached (%)
Housing units in structures - 1, attached (%)
Housing units in structures - 2 (%)
Housing units in structures - 3 or 4 (%)
Housing units in structures - 5 to 9 (%)
Housing units in structures - 10 to 19 (%)
Housing units in structures - 20 to 49 (%)
Housing units in structures - 50 or more (%)
Housing units in structures - Mobile home (%)
Housing units in structures - Boat, RV, van, etc. (%)
Housing units in structures - Owners - 1, detached (%)
Housing units in structures - Owners - 1, attached (%)
Housing units in structures - Owners - 2 (%)
Housing units in structures - Owners - 3 or 4 (%)
Housing units in structures - Owners - 5 to 9 (%)
Housing units in structures - Owners - 10 to 19 (%)
Housing units in structures - Owners - 20 to 49 (%)
Housing units in structures - Owners - 50 or more (%)
Housing units in structures - Owners - Mobile home (%)
Housing units in structures - Owners - Boat, RV, van, etc. (%)
Housing units in structures - Renters - 1, detached (%)
Housing units in structures - Renters - 1, attached (%)
Housing units in structures - Renters - 2 (%)
Housing units in structures - Renters - 3 or 4 (%)
Housing units in structures - Renters - 5 to 9 (%)
Housing units in structures - Renters - 10 to 19 (%)
Housing units in structures - Renters - 20 to 49 (%)
Housing units in structures - Renters - 50 or more (%)
Housing units in structures - Renters - Mobile home (%)
Housing units in structures - Renters - Boat, RV, van, etc. (%)
House/condo owner moved in on average (years ago)
Renter moved in on average (years ago)
Year householder moved into unit - Moved in 1999 to March 2000 (%)
Year householder moved into unit - Moved in 1999 to March 2000 (%) - White
Year householder moved into unit - Moved in 1999 to March 2000 (%) - Black or African American
Year householder moved into unit - Moved in 1999 to March 2000 (%) - Asian
Year householder moved into unit - Moved in 1999 to March 2000 (%) - Hispanic or Latino
Year householder moved into unit - Moved in 1999 to March 2000 (%) - American Indian and Alaska Native
Year householder moved into unit - Moved in 1999 to March 2000 (%) - Multirace
Year householder moved into unit - Moved in 1999 to March 2000 (%) - Other Race
Year householder moved into unit - Moved in 1995 to 1998 (%)
Year householder moved into unit - Moved in 1995 to 1998 (%) - White
Year householder moved into unit - Moved in 1995 to 1998 (%) - Black or African American
Year householder moved into unit - Moved in 1995 to 1998 (%) - Asian
Year householder moved into unit - Moved in 1995 to 1998 (%) - Hispanic or Latino
Year householder moved into unit - Moved in 1995 to 1998 (%) - American Indian and Alaska Native
Year householder moved into unit - Moved in 1995 to 1998 (%) - Multirace
Year householder moved into unit - Moved in 1995 to 1998 (%) - Other Race
Year householder moved into unit - Moved in 1990 to 1994 (%)
Year householder moved into unit - Moved in 1990 to 1994 (%) - White
Year householder moved into unit - Moved in 1990 to 1994 (%) - Black or African American
Year householder moved into unit - Moved in 1990 to 1994 (%) - Asian
Year householder moved into unit - Moved in 1990 to 1994 (%) - Hispanic or Latino
Year householder moved into unit - Moved in 1990 to 1994 (%) - American Indian and Alaska Native
Year householder moved into unit - Moved in 1990 to 1994 (%) - Multirace
Year householder moved into unit - Moved in 1990 to 1994 (%) - Other Race
Year householder moved into unit - Moved in 1980 to 1989 (%)
Year householder moved into unit - Moved in 1980 to 1989 (%) - White
Year householder moved into unit - Moved in 1980 to 1989 (%) - Black or African American
Year householder moved into unit - Moved in 1980 to 1989 (%) - Asian
Year householder moved into unit - Moved in 1980 to 1989 (%) - Hispanic or Latino
Year householder moved into unit - Moved in 1980 to 1989 (%) - American Indian and Alaska Native
Year householder moved into unit - Moved in 1980 to 1989 (%) - Multirace
Year householder moved into unit - Moved in 1980 to 1989 (%) - Other Race
Year householder moved into unit - Moved in 1970 to 1979 (%)
Year householder moved into unit - Moved in 1970 to 1979 (%) - White
Year householder moved into unit - Moved in 1970 to 1979 (%) - Black or African American
Year householder moved into unit - Moved in 1970 to 1979 (%) - Asian
Year householder moved into unit - Moved in 1970 to 1979 (%) - Hispanic or Latino
Year householder moved into unit - Moved in 1970 to 1979 (%) - American Indian and Alaska Native
Year householder moved into unit - Moved in 1970 to 1979 (%) - Multirace
Year householder moved into unit - Moved in 1970 to 1979 (%) - Other Race
Year householder moved into unit - Moved in 1969 or earlier (%)
Year householder moved into unit - Moved in 1969 or earlier (%) - White
Year householder moved into unit - Moved in 1969 or earlier (%) - Black or African American
Year householder moved into unit - Moved in 1969 or earlier (%) - Asian
Year householder moved into unit - Moved in 1969 or earlier (%) - Hispanic or Latino
Year householder moved into unit - Moved in 1969 or earlier (%) - American Indian and Alaska Native
Year householder moved into unit - Moved in 1969 or earlier (%) - Multirace
Year householder moved into unit - Moved in 1969 or earlier (%) - Other Race
Housing units lacking complete plumbing facilities (%)
Housing units lacking complete kitchen facilities (%)
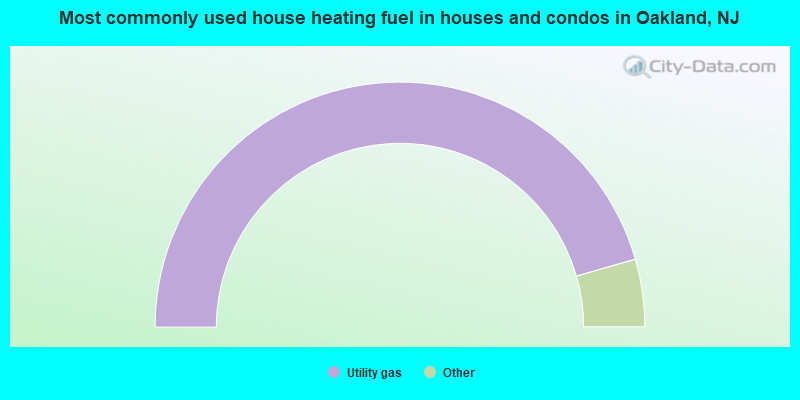
House heating fuel used in houses and condos - Utility gas (%)
House heating fuel used in houses and condos - Bottled, tank, or LP gas (%)
House heating fuel used in houses and condos - Electricity (%)
House heating fuel used in houses and condos - Fuel oil, kerosene, etc. (%)
House heating fuel used in houses and condos - Coal or coke (%)
House heating fuel used in houses and condos - Wood (%)
House heating fuel used in houses and condos - Solar energy (%)
House heating fuel used in houses and condos - Other fuel (%)
House heating fuel used in houses and condos - No fuel used (%)
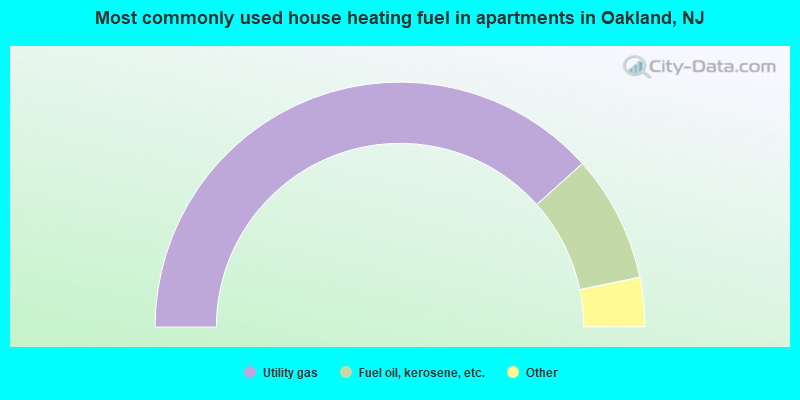
House heating fuel used in apartments - Utility gas (%)
House heating fuel used in apartments - Bottled, tank, or LP gas (%)
House heating fuel used in apartments - Electricity (%)
House heating fuel used in apartments - Fuel oil, kerosene, etc. (%)
House heating fuel used in apartments - Coal or coke (%)
House heating fuel used in apartments - Wood (%)
House heating fuel used in apartments - Solar energy (%)
House heating fuel used in apartments - Other fuel (%)
House heating fuel used in apartments - No fuel used (%)
Latest news about housing in Oakland, NJ collected exclusively by city-data.com from local newspapers, TV, and radio stations
Median year house/condo built: 1961Median year apartment built: 1962Household type by relationship:
Households: 12,730
Male householders: 2,249 (324 living alone ), Female householders: 2,130 (363 living alone )3,021 spouses (3,021 opposite-sex spouses ), 109 unmarried partners , (97 opposite-sex unmarried partners ), 4,185 children (4,012 natural , 48 adopted , 123 stepchildren ), 98 grandchildren , 44 brothers or sisters , 262 parents , 0 foster children , 224 other relatives , 199 non-relatives In group quarters: 201
Size of family households: 1,132 2-persons , 1,202 3-persons , 844 4-persons , 281 5-persons , 76 6-persons , 26 7-or-more-persons .
Size of nonfamily households: 711 1-person , 71 2-persons , 63 3-persons .
2,287 married couples with children. single-parent households (139 men , 207 women ).
76.2% of residents of Oakland speak English at home. of residents speak Spanish at home (74% speak English very well , 23% speak English well , 3% speak English not well ).of residents speak other Indo-European language at home (67% speak English very well , 21% speak English well , 12% speak English not well ).of residents speak Asian or Pacific Island language at home (75% speak English very well , 5% speak English well , 17% speak English not well , 3% don't speak English at all ).of residents speak other language at home (100% speak English very well ).
Foreign born population: 1,973 (15.5%)of them are naturalized citizens )
Median number of rooms in houses and condos:
Median number of rooms in apartments
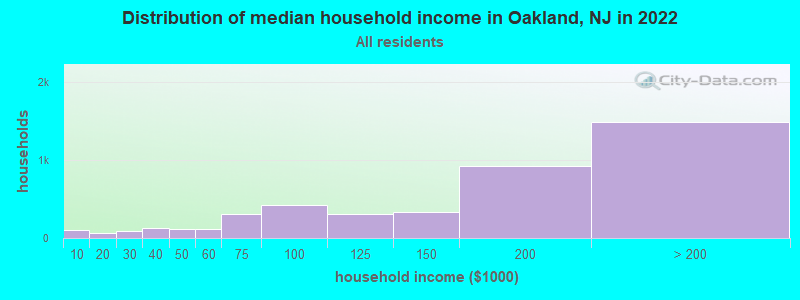
Oakland, NJ household income distribution 104 Less than $10,00063 $10,000 to $19,99988 $20,000 to $29,999129 $30,000 to $39,999110 $40,000 to $49,999113 $50,000 to $59,999312 $60,000 to $74,999426 $75,000 to $99,999304 $100,000 to $124,999328 $125,000 to $149,999923 $150,000 to $199,9991,488 $200,000 or more
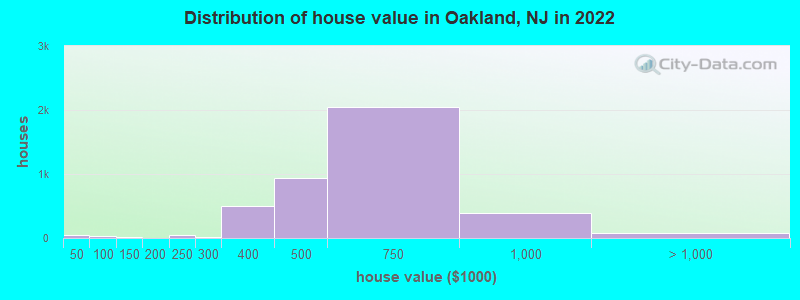
Home value of owner - occupied houses in 2022 in Oakland, NJ 18 Less than $10,00011 $35,000 to $39,99919 $40,000 to $49,99914 $80,000 to $89,9994 $90,000 to $99,9999 $125,000 to $149,99952 $200,000 to $249,99922 $250,000 to $299,999506 $300,000 to $399,999944 $400,000 to $499,9992,047 $500,000 to $749,999392 $750,000 to $999,99969 $1,000,000 to $1,499,9998 $2,000,000 or moreRent paid by renters in 2022 in Oakland, NJ 9 Less than $1003 $100 to $14919 $300 to $3496 $750 to $79978 $1,000 to $1,24961 $1,250 to $1,49919 $1,500 to $1,99970 $2,500 to $2,99984 No cash rent
Percentage of workers working in this county: 72.4%Number of people working at home: 1,483 (21.5% of all workers )
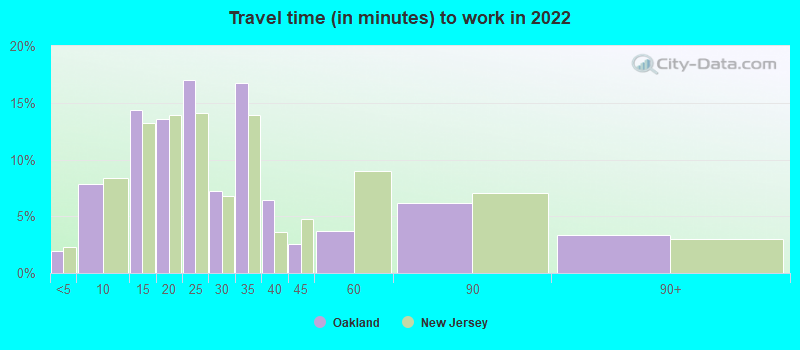
Travel time to work (commute)
Less than 5 minutes: 755 to 9 minutes: 37910 to 14 minutes: 60915 to 19 minutes: 94220 to 24 minutes: 52825 to 29 minutes: 61630 to 34 minutes: 69335 to 39 minutes: 23940 to 44 minutes: 18845 to 59 minutes: 51060 to 89 minutes: 41790 or more minutes: 279
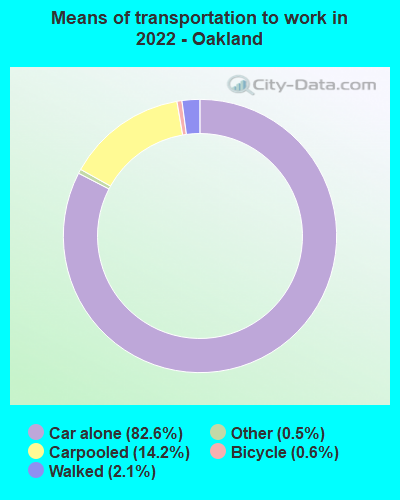
Means of transportation to work:
Drove a car alone: 3,931 (62.7%)Carpooled: 814 (13.0%)Taxi: 28 (0.4%)Bicycle: 19 (0.3%)Walked: 106 (1.7%)Worked at home: 1,483 (23.7%)
Unemployment by race in 2022
Unemployment rate for White non-Hispanic residents 5.0% Males3.6% FemalesUnemployment rate for other race residents 7.8% FemalesUnemployment rate for two or more race residents 1.9% MalesUnemployment rate for Hispanic or Latino residents 1.9% Females
Year of entry for the foreign-born population in Oakland, New Jersey
287 2010 or later 508 2000 to 2009 544 1990 to 1999 242 1980 to 1989 163 1970 to 1979 408 Before 1970
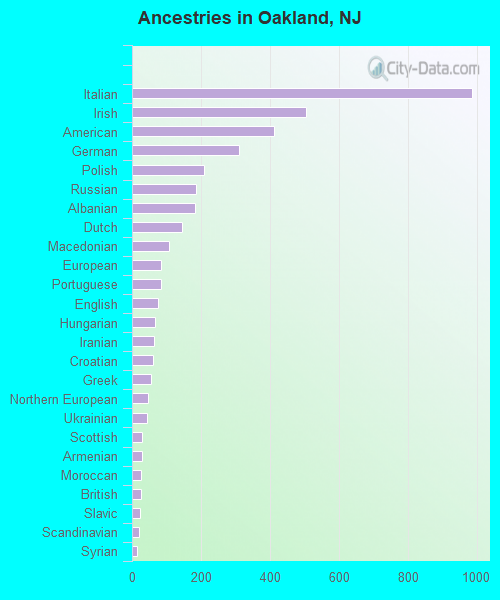
First ancestries reported:
Italian: 986 (17.9%)
Irish: 506 (9.2%)
American: 413 (7.5%)
German: 310 (5.6%)
Polish: 210 (3.8%)
Russian: 185 (3.4%)
Albanian: 183 (3.3%)
Dutch: 145 (2.6%)
Macedonian: 108 (2.0%)
European: 84 (1.5%)
Portuguese: 83 (1.5%)
English: 76 (1.4%)
Hungarian: 66 (1.2%)
Iranian: 64 (1.2%)
Croatian: 60 (1.1%)
Greek: 56 (1.0%)
Northern European: 46 (0.8%)
Ukrainian: 43 (0.8%)
Scottish: 30 (0.5%)
Armenian: 29 (0.5%)
Moroccan: 25 (0.5%)
British: 25 (0.5%)
Slavic: 22 (0.4%)
Scandinavian: 19 (0.3%)
Syrian: 15 (0.3%)
Eastern European: 14 (0.3%)
Serbian: 13 (0.2%)
Turkish: 12 (0.2%)
Canadian: 11 (0.2%)
French: 10 (0.2%)
Australian: 10 (0.2%)
Scotch-Irish: 10 (0.2%)
Slovak: 9 (0.2%)
Jamaican: 9 (0.2%)
Trinidadian and Tobagonian: 9 (0.2%)
Alsatian: 8 (0.1%)
Austrian: 7 (0.1%)
Lebanese: 6 (0.1%)
French Canadian: 2 (0.04%)
Danish: 2 (0.04%) Most common places of birth for foreign-born residents (%): Ecuador Oakland:
18.6% (366)New Jersey:
4.4% (95,275)
Poland Oakland:
7.3% (144)New Jersey:
2.3% (48,811)
North Macedonia (Macedonia) Oakland:
6.8% (135)New Jersey:
0.2% (5,094)
Russia Oakland:
6.6% (131)New Jersey:
0.9% (20,371)
Colombia Oakland:
6.1% (121)New Jersey:
4.2% (90,817)
India Oakland:
4.8% (95)New Jersey:
12.8% (274,609)
Cuba Oakland:
4.6% (91)New Jersey:
2.1% (45,435)
Canada Oakland:
4.4% (86)New Jersey:
0.9% (18,317)
Mexico Oakland:
4.1% (80)New Jersey:
4.8% (102,527)
Iran Oakland:
3.8% (74)New Jersey:
0.2% (4,947)
England Oakland:
3.8% (74)New Jersey:
0.5% (10,886)
Peru Oakland:
3.8% (74)New Jersey:
2.7% (58,563)
Albania Oakland:
3.3% (66)New Jersey:
0.3% (6,130)
China, excluding Hong Kong and Taiwan Oakland:
3.2% (63)New Jersey:
3.7% (78,969)
Czechoslovakia (includes Czech Republic and Slovakia) Oakland:
2.9% (57)New Jersey:
0.2% (3,968)
Korea Oakland:
2.2% (43)New Jersey:
3.3% (70,512)
Israel Oakland:
2.0% (40)New Jersey:
0.5% (10,975)
Place of birth for U.S.-born residents:
This state: 7,670Other state: 2,894Northeast: 2,476Midwest: 174South: 125West: 89 91.4% of Oakland residents lived in the same house 1 years ago.
Out of people who lived in different houses, 40.7% lived in this county.
Out of people who lived in different counties, 77.2% lived in New Jersey.
Oakland:
91.4%State average:
90.4%
Education attainment for males 25 years and older:
No schooling: 25Nursery to 4th grade: 415th and 6th grade: 107th and 8th grade: 09th grade: 010th grade: 811th grade: 2312th grade, no diploma: 42High school graduate (or equivalency): 869Less than 1 year of college: 428Some college more than 1 year, no degree: 310Associate degree: 257Bachelor's degree: 1,425Master's degree: 566Professional school degree: 258Doctorate degree: 162
Education attainment for females 25 years and older:
No schooling: 78Nursery to 4th grade: 05th and 6th grade: 07th and 8th grade: 209th grade: 610th grade: 011th grade: 1812th grade, no diploma: 20High school graduate (or equivalency): 901Less than 1 year of college: 320Some college more than 1 year, no degree: 401Associate degree: 320Bachelor's degree: 1,500Master's degree: 798Professional school degree: 103Doctorate degree: 44
Housing units in structures:
One, detached: 4,324One, attached: 213Two: 543 or 4: 605 to 9: 5010 to 19: 850 or more: 19Mobile homes: 5Housing units lacking complete plumbing facilities in 2022: 2.8%Housing units lacking complete kitchen facilities in 2022: 2.0%House/condo owner moved in on average 14 years ago
Renter moved in on average 3 years ago
Private vs. public school enrollment:
Students in private schools in grades 1 to 8 (elementary and middle school): 140 Here:
13.0%New Jersey:
12.3%
Students in private schools in grades 9 to 12 (high school): 129 Here:
12.5%New Jersey:
13.1%
Students in private undergraduate colleges: 96 Here:
18.1%New Jersey:
33.2%