Northlake, IL (Illinois) Houses and Residents
| Northlake: | $233,259 |
| Illinois: | $251,600 |
Total population: 12,372 (Urban population: 11,810, Rural population: 0)
Houses: 4,724 (4,558 occupied: 3,114 owner occupied, 1,521 renter occupied)
| % of renters here: | 33% |
| State: | 33% |
Housing density: 1,567 houses/condos per square mile
Median price asked for vacant for-sale houses and condos in 2022: $634,250.
Median contract rent in 2022: $965 (lower quartile is $802, upper quartile is $1,445)
Median rent asked for vacant for-rent units in 2022: $4,047
Median gross rent in Northlake, IL in 2022: $1,090
Housing units in Northlake with a mortgage: 1,767 (149 second mortgage, 5 home equity loan, 92 both second mortgage and home equity loan)
Houses without a mortgage: 23
Median household income for houses/condos with a mortgage: $85,901
Median household income for apartments without a mortgage: $89,339
Median monthly housing costs: $1,135
Compare current foreclosures near Northlake, IL:
| Photo | Address | Area | Beds / Baths | Price | Details |
|---|---|---|---|---|---|

|
#1
N Francisco Ave
Chicago, IL 60659
|
1,100 sq. feet
|
1 baths 2 beds |
$159,000
|
show details |

|
#2
W Garfield Blvd
Chicago, IL 60636
|
2,820 sq. feet
|
2 baths 5 beds |
$132,500
|
show details |

|
#3
S 87th Ave
Justice, IL 60458
|
2,725 sq. feet
|
3 baths 4 beds |
$585,000
|
show details |

|
#4
Briar Hill Dr
Schaumburg, IL 60194
|
1,600 sq. feet
|
2 baths 4 beds |
$410,400
|
show details |

|
#5
N Austin Ave
Chicago, IL 60634
|
2,500 sq. feet
|
3 baths 4 beds |
$365,000
|
show details |

|
#6
S Lyman Ave
Des Plaines, IL 60016
|
2,233 sq. feet
|
2 baths 4 beds |
$330,000
|
show details |

|
#7
N Sheridan Rd Apt 6e
Chicago, IL 60660
|
1,200 sq. feet
|
2 baths 2 beds |
$255,000
|
show details |

|
#8
S Ada St
Chicago, IL 60636
|
2,619 sq. feet
|
2 baths 6 beds |
$244,400
|
show details |

|
#9
W 63rd St
Chicago, IL 60638
|
1,250 sq. feet
|
2 baths 4 beds |
$385,000
|
show details |

|
#10
W Van Buren St
Chicago, IL 60644
|
2,839 sq. feet
|
3 baths 8 beds |
$87,500
|
show details |
| Photo | Address | Area | Beds / Baths | Price | Details |
|---|---|---|---|---|---|

|
#11
S 13th Ave
Maywood, IL 60153
|
1,176 sq. feet
|
1 baths 3 beds |
$279,900
|
show details |

|
#12
N Olcott Ave
Chicago, IL 60634
|
2,161 sq. feet
|
2 baths 4 beds |
$559,000
|
show details |

|
#13
E Crest Ave
Addison, IL 60101
|
2,023 sq. feet
|
1 baths 5 beds |
$329,000
|
show details |

|
#14
Carriage Way Dr
Arlington Heights, IL 60004
|
- sq. feet
|
2 baths 2 beds |
$179,900
|
show details |

|
#15
W 50th St
Chicago, IL 60609
|
- sq. feet
|
2 baths 6 beds |
$109,200
|
show details |

|
#16
Raymond Ave
Brookfield, IL 60513
|
1,020 sq. feet
|
1 baths 2 beds |
$219,900
|
show details |

|
#17
S Main St
Hometown, IL 60456
|
744 sq. feet
|
1 baths 2 beds |
$175,000
|
show details |

|
#18
W 21st St # 1
Chicago, IL 60608
|
1,250 sq. feet
|
1 baths 3 beds |
$219,900
|
show details |

|
#19
N 4th Ave
Des Plaines, IL 60016
|
1,381 sq. feet
|
1 baths 3 beds |
$335,000
|
show details |

|
#20
Main St
Skokie, IL 60076
|
1,428 sq. feet
|
1 baths 3 beds |
$455,000
|
show details |
| Photo | Address | Area | Beds / Baths | Price | Details |
|---|---|---|---|---|---|

|
#21
Webster Ln
Des Plaines, IL 60018
|
1,608 sq. feet
|
3 baths 3 beds |
$515,000
|
show details |

|
#22
N 74th Ave
Elmwood Park, IL 60707
|
1,300 sq. feet
|
1 baths 3 beds |
$235,000
|
show details |

|
#23
Newcastle Ave
Westchester, IL 60154
|
1,640 sq. feet
|
1 baths 2 beds |
$239,200
|
show details |

|
#24
Christiana Ave # 1
Skokie, IL 60076
|
1,400 sq. feet
|
1 baths 3 beds |
$319,000
|
show details |

|
#25
S Ridgeland Ave
Oak Park, IL 60302
|
2,400 sq. feet
|
3 baths 4 beds |
$625,000
|
show details |

|
#26
S Tripp Ave
Oak Lawn, IL 60453
|
1,591 sq. feet
|
1 baths 3 beds |
$212,000
|
show details |

|
#27
W Barry Ave Apt 3bc
Chicago, IL 60657
|
2,500 sq. feet
|
3 baths 4 beds |
$699,000
|
show details |

|
#28
W Quincy St
Chicago, IL 60644
|
960 sq. feet
|
1 baths - beds |
$19,000
|
show details |

|
#29
Avenida Serra Test
Des Plaines, IL 60018
|
- sq. feet
|
2 baths 3 beds |
$100,000
|
show details |

|
#30
Washington Blvd Apt 1
Oak Park, IL 60302
|
- sq. feet
|
1 baths 2 beds |
$149,900
|
show details |
| Photo | Address | Area | Beds / Baths | Price | Details |
|---|---|---|---|---|---|

|
#31
W Arthington St
Chicago, IL 60612
|
969 sq. feet
|
1 baths - beds |
$20,000
|
show details |

|
#32
Woods Dr Unit Unit 2004
Skokie, IL 60077
|
- sq. feet
|
2 baths 3 beds |
$572,000
|
show details |

|
#33
S Morgan St
Chicago, IL 60620
|
2,700 sq. feet
|
2 baths 6 beds |
show details | |

|
#34
Kirkland Lane
Villa Park, IL 60181
|
1,100 sq. feet
|
2 baths 3 beds |
show details | |

|
#35
S Rockwell St
Chicago, IL 60632
|
3,554 sq. feet
|
3 baths 6 beds |
show details | |

|
#36
N Lake Shore Dr Apt 21f
Chicago, IL 60657
|
2,200 sq. feet
|
3 baths 3 beds |
show details | |

|
#37
W Flournoy St
Chicago, IL 60624
|
1,288 sq. feet
|
2 baths - beds |
$17,000
|
show details |

|
#38
Hesterman Dr
Glendale Heights, IL 60139
|
1,263 sq. feet
|
2 baths 2 beds |
show details | |

|
#39
W Corcoran Pl Apt 1
Chicago, IL 60644
|
- sq. feet
|
2 baths 3 beds |
$199,900
|
show details |

|
#40
Lathrop Ave Apt 404
Forest Park, IL 60130
|
675 sq. feet
|
1 baths 1 beds |
show details |
| Photo | Address | Area | Beds / Baths | Price | Details |
|---|---|---|---|---|---|

|
#41
S Cicero Ave Apt 2c
Oak Lawn, IL 60453
|
1,200 sq. feet
|
1 baths 2 beds |
show details | |

|
#42
N Canal St Apt 719
Chicago, IL 60606
|
1,250 sq. feet
|
1 baths 1 beds |
show details | |

|
#43
W Cermak Rd
Chicago, IL 60623
|
2,971 sq. feet
|
3 baths 7 beds |
show details | |

|
#44
Scarsdale Ct Unit C2
Schaumburg, IL 60193
|
950 sq. feet
|
1 baths 2 beds |
show details | |

|
#45
W Grenshaw St
Chicago, IL 60624
|
2,148 sq. feet
|
2 baths 6 beds |
show details | |

|
#46
W Irving Park Rd Apt 4
Chicago, IL 60613
|
1,800 sq. feet
|
2 baths 3 beds |
show details | |

|
#47
W 18th St
Chicago, IL 60608
|
2,571 sq. feet
|
4 baths 6 beds |
show details | |

|
#48
N Campbell Ave
Chicago, IL 60659
|
1,476 sq. feet
|
1 baths 4 beds |
show details | |

|
#49
Manchester Ave
Westchester, IL 60154
|
2,044 sq. feet
|
2 baths 4 beds |
show details | |

|
Check over 1 million property listings on Foreclosure.com!
|
browse all offers | |||

Latest news about housing in Northlake, IL collected exclusively by city-data.com from local newspapers, TV, and radio stations

 | Adjacent suburbs that are vastly different from each other. (53 replies) |
| Suburbs of Suburbs (32 replies) |
| Addison a good town? (44 replies) |
| Why doesn't Chicago have any super-dense suburbs? (25 replies) |
| What would be transitional suburbs? (Inner ring, Outer ring) (14 replies) |
| Is Berwyn potentially the next Oak Park? (94 replies) |

Median year apartment built: 1969
Household type by relationship:
Households: 12,401- Male householders: 2,172 (436 living alone), Female householders: 2,265 (682 living alone)
1,748 spouses (1,688 opposite-sex spouses), 323 unmarried partners, (307 opposite-sex unmarried partners), 4,250 children (4,096 natural, 68 adopted, 85 stepchildren), 256 grandchildren, 232 brothers or sisters, 265 parents, 0 foster children, 291 other relatives, 206 non-relatives
- In group quarters: 388
Size of family households: 1,208 2-persons, 676 3-persons, 506 4-persons, 533 5-persons, 128 6-persons, 50 7-or-more-persons.
Size of nonfamily households: 1,201 1-person, 287 2-persons.
1,166 married couples with children.
1,249 single-parent households (544 men, 705 women).
42.3% of residents of Northlake speak English at home.
50.2% of residents speak Spanish at home (53% speak English very well, 22% speak English well, 14% speak English not well, 11% don't speak English at all).
5.4% of residents speak other Indo-European language at home (56% speak English very well, 15% speak English well, 29% speak English not well).
2.6% of residents speak Asian or Pacific Island language at home (53% speak English very well, 28% speak English well, 19% speak English not well).
0.1% of residents speak other language at home (100% speak English very well).
Foreign born population: 3,741 (30.2%)
(46.0% of them are naturalized citizens)
| Here: | 6.1 |
| State: | 6.4 |
| Here: | 3.7 |
| State: | 4.1 |

- Bedrooms in owner-occupied houses and condos in Northlake, Illinois
- 0no bedroom
- 2701 bedroom
- 3622 bedrooms
- 1,6603 bedrooms
- 6254 bedrooms
- 1985+ bedrooms

- Bedrooms in renter-occupied apartments in Northlake, Illinois
- 226no bedroom
- 5071 bedroom
- 4132 bedrooms
- 2543 bedrooms
- 1154 bedrooms
- 75+ bedrooms

- Cars and other vehicles available in Northlake in owner-occupied houses/condos
- 168no vehicle
- 7341 vehicle
- 1,1232 vehicles
- 7893 vehicles
- 1874 vehicles
- 1145+ vehicles

- Cars and other vehicles available in Northlake in renter-occupied apartments
- 433no vehicle
- 6971 vehicle
- 2892 vehicles
- 863 vehicles
- 174 vehicles
- 05+ vehicles

- Rooms in owner-occupied houses in Northlake, Illinois
- 01 room
- 82 rooms
- 1973 rooms
- 1764 rooms
- 6695 rooms
- 8576 rooms
- 6957 rooms
- 2268 rooms
- 2879+ rooms

- Rooms in renter-occupied apartments in Northlake, Illinois
- 2261 room
- 842 rooms
- 3573 rooms
- 2834 rooms
- 3195 rooms
- 966 rooms
- 1337 rooms
- 68 rooms
- 189+ rooms


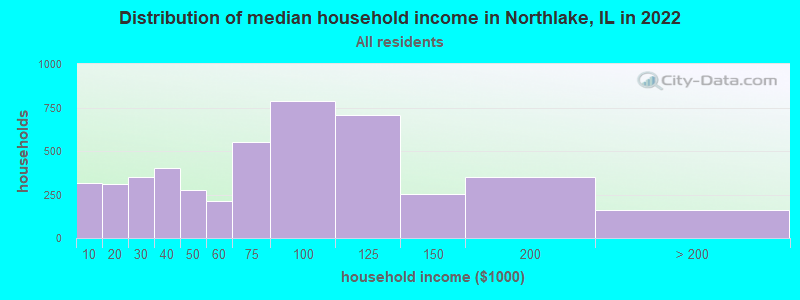
Northlake, IL household income distribution

- 318Less than $10,000
- 309$10,000 to $19,999
- 350$20,000 to $29,999
- 402$30,000 to $39,999
- 274$40,000 to $49,999
- 210$50,000 to $59,999
- 552$60,000 to $74,999
- 788$75,000 to $99,999
- 705$100,000 to $124,999
- 253$125,000 to $149,999
- 352$150,000 to $199,999
- 160$200,000 or more
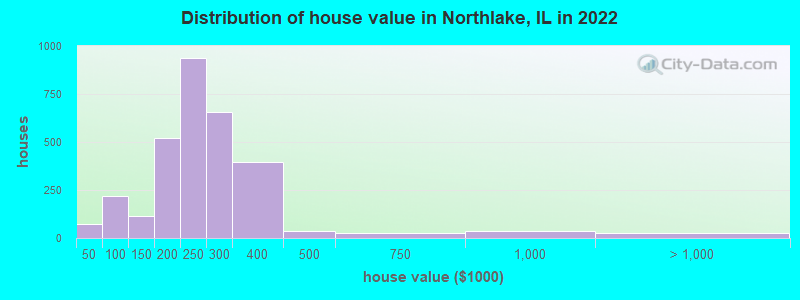
Home value of owner - occupied houses in 2022 in Northlake, IL
-
- 16Less than $10,000
- 13$10,000 to $14,999
- 19$15,000 to $19,999
- 5$20,000 to $24,999
- 11$35,000 to $39,999
- 7$40,000 to $49,999
- 80$70,000 to $79,999
- 74$80,000 to $89,999
- 56$90,000 to $99,999
- 32$100,000 to $124,999
- 81$125,000 to $149,999
- 296$150,000 to $174,999
- 222$175,000 to $199,999
- 938$200,000 to $249,999
- 656$250,000 to $299,999
- 396$300,000 to $399,999
- 38$400,000 to $499,999
- 27$500,000 to $749,999
- 33$750,000 to $999,999
- 27$2,000,000 or more
Rent paid by renters in 2022 in Northlake, IL
-
- 8$250 to $299
- 33$300 to $349
- 148$350 to $399
- 16$400 to $449
- 51$500 to $549
- 11$550 to $599
- 8$650 to $699
- 83$750 to $799
- 267$800 to $899
- 213$900 to $999
- 217$1,000 to $1,249
- 110$1,250 to $1,499
- 126$1,500 to $1,999
- 102$2,000 to $2,499
- 101$2,500 to $2,999
- 61No cash rent


Percentage of workers working in this county: 72.8%
Number of people working at home: 640 (10.8% of all workers)
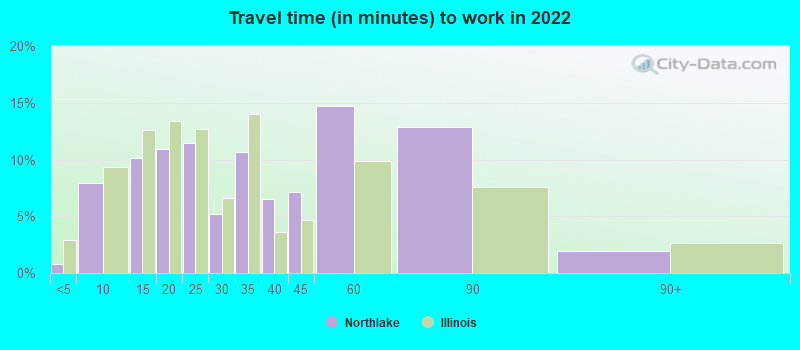
Travel time to work (commute)
- Less than 5 minutes: 19
- 5 to 9 minutes: 388
- 10 to 14 minutes: 547
- 15 to 19 minutes: 618
- 20 to 24 minutes: 899
- 25 to 29 minutes: 483
- 30 to 34 minutes: 1,032
- 35 to 39 minutes: 327
- 40 to 44 minutes: 161
- 45 to 59 minutes: 355
- 60 to 89 minutes: 273
- 90 or more minutes: 94

Means of transportation to work:
- Drove a car alone: 6,215 (77.5%)
- Carpooled: 697 (8.7%)
- Bus: 80 (1.0%)
- Subway or elevated rail: 48 (0.6%)
- Long-distance train or commuter rail: 12 (0.1%)
- Taxi: 217 (2.7%)
- Walked: 53 (0.7%)
- Worked at home: 640 (8.0%)

- Unemployment by race in 2022
- Unemployment rate for White non-Hispanic residents
- 6.1%Males
- 3.5%Females
- Unemployment rate for Black residents
- 18.3%Males
- 48.8%Females
- Unemployment rate for other race residents
- 1.3%Males
- 2.6%Females
- Unemployment rate for two or more race residents
- 6.5%Males
- 1.4%Females
- Unemployment rate for Hispanic or Latino residents
- 4.1%Males
- 1.4%Females

- Year of entry for the foreign-born population in Northlake, Illinois
- 2982010 or later
- 7272000 to 2009
- 1,1111990 to 1999
- 9111980 to 1989
- 5071970 to 1979
- 409Before 1970
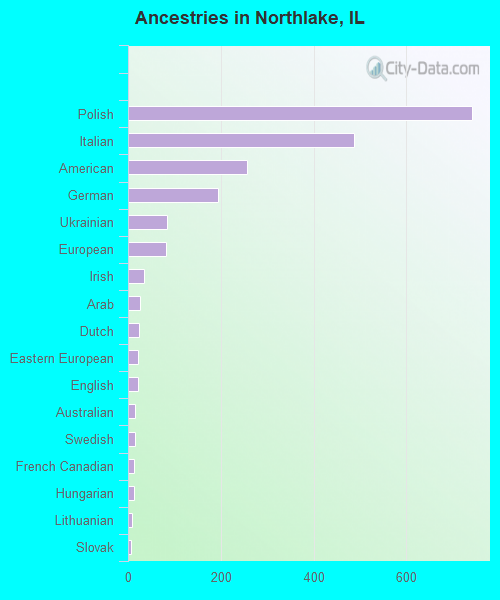
First ancestries reported:
- Polish: 741 (8.8%)
- Italian: 488 (5.8%)
- American: 256 (3.1%)
- German: 193 (2.3%)
- Ukrainian: 83 (1.0%)
- European: 81 (1.0%)
- Irish: 34 (0.4%)
- Arab: 26 (0.3%)
- Dutch: 24 (0.3%)
- Eastern European: 21 (0.3%)
- English: 21 (0.3%)
- Australian: 16 (0.2%)
- Swedish: 15 (0.2%)
- French Canadian: 13 (0.2%)
- Hungarian: 13 (0.2%)
- Lithuanian: 8 (0.10%)
- Slovak: 7 (0.08%)
- Canadian: 2 (0.02%)
- Greek: 2 (0.02%)
Most common places of birth for foreign-born residents (%):
| Northlake: | 75.4% (2,821) |
| Illinois: | 34.7% (626,958) |
| Northlake: | 8.0% (300) |
| Illinois: | 6.9% (124,474) |
| Northlake: | 3.7% (140) |
| Illinois: | 1.3% (22,793) |
| Northlake: | 2.2% (84) |
| Illinois: | 5.2% (93,003) |
| Northlake: | 2.1% (79) |
| Illinois: | 1.2% (22,269) |
| Northlake: | 1.9% (71) |
| Illinois: | 1.6% (29,316) |
Place of birth for U.S.-born residents:
- This state: 7,655
- Other state: 787
- Northeast: 297
- Midwest: 200
- South: 222
- West: 70
94.6% of Northlake residents lived in the same house 1 years ago.
Out of people who lived in different houses, 38.9% lived in this county.
Out of people who lived in different counties, 44.0% lived in Illinois.
| Northlake: | 94.6% |
| State average: | 88.3% |
Education attainment for males 25 years and older:
- No schooling: 463
- Nursery to 4th grade: 24
- 5th and 6th grade: 441
- 7th and 8th grade: 92
- 9th grade: 132
- 10th grade: 114
- 11th grade: 62
- 12th grade, no diploma: 190
- High school graduate (or equivalency): 1,331
- Less than 1 year of college: 265
- Some college more than 1 year, no degree: 271
- Associate degree: 328
- Bachelor's degree: 362
- Master's degree: 59
- Professional school degree: 43
- Doctorate degree: 0

Education attainment for females 25 years and older:
- No schooling: 235
- Nursery to 4th grade: 62
- 5th and 6th grade: 234
- 7th and 8th grade: 121
- 9th grade: 34
- 10th grade: 27
- 11th grade: 34
- 12th grade, no diploma: 163
- High school graduate (or equivalency): 1,371
- Less than 1 year of college: 229
- Some college more than 1 year, no degree: 634
- Associate degree: 405
- Bachelor's degree: 693
- Master's degree: 164
- Professional school degree: 52
- Doctorate degree: 0


Housing units in structures:
- One, detached: 2,992
- One, attached: 47
- Two: 14
- 3 or 4: 98
- 5 to 9: 177
- 10 to 19: 490
- 20 to 49: 332
- 50 or more: 559
- Mobile homes: 12
Housing units lacking complete kitchen facilities in 2022: 2.2%
House/condo owner moved in on average 16 years ago
Renter moved in on average 3 years ago

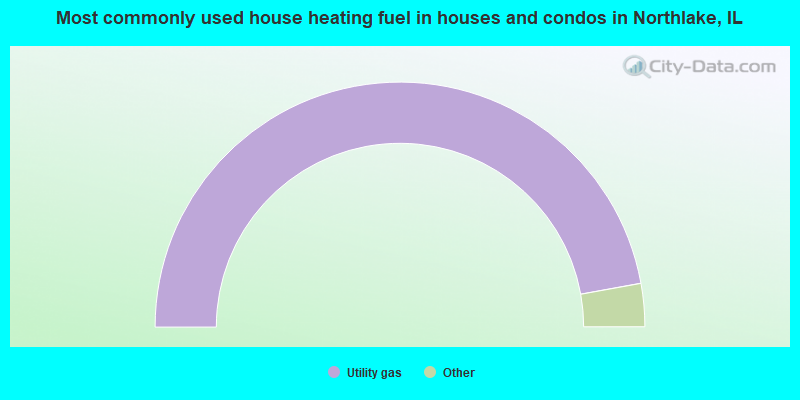
- 94.3%Utility gas
- 3.7%Electricity
- 1.8%Bottled, tank, or LP gas
- 0.2%No fuel used
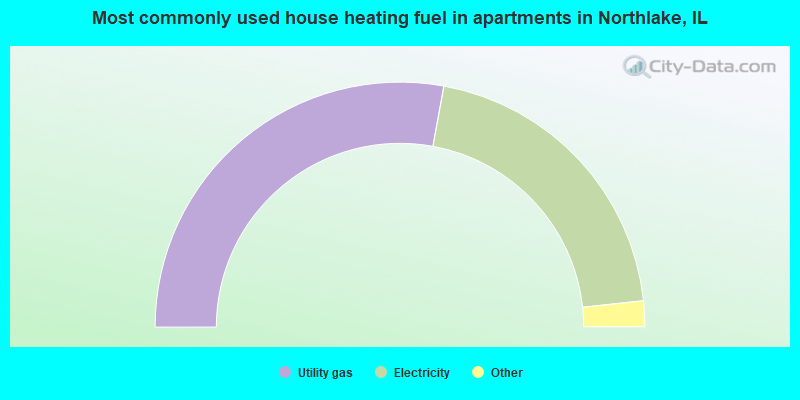
- 55.8%Utility gas
- 40.9%Electricity
- 1.9%Bottled, tank, or LP gas
- 1.3%No fuel used
Private vs. public school enrollment:
| Here: | 10.5% |
| Illinois: | 13.3% |
| Here: | 6.1% |
| Illinois: | 9.9% |
| Here: | 11.8% |
| Illinois: | 27.4% |


