North Riverside, IL (Illinois) Houses and Residents
| North Riverside: | $298,834 |
| Illinois: | $251,600 |
Total population: 6,698 (All urban)
Houses: 3,119 (2,950 occupied: 2,014 owner occupied, 986 renter occupied)
| % of renters here: | 33% |
| State: | 33% |
Housing density: 2,020 houses/condos per square mile
Median price asked for vacant for-sale houses and condos in 2022 in this county: $235,866.
Median contract rent in 2022: $1,075 (lower quartile is $920, upper quartile is $1,227)
Median rent asked for vacant for-rent units in 2022: $7,679
Median gross rent in North Riverside, IL in 2022: $1,100
Housing units in North Riverside with a mortgage: 1,133 (83 second mortgage, 44 home equity loan, 30 both second mortgage and home equity loan)
Houses without a mortgage: 69
Median household income for houses/condos with a mortgage: $132,192
Median household income for apartments without a mortgage: $62,382
Median monthly housing costs: $1,160
Compare current foreclosures near North Riverside, IL:
| Photo | Address | Area | Beds / Baths | Price | Details |
|---|---|---|---|---|---|

|
#1
N 4th Ave
Des Plaines, IL 60016
|
1,381 sq. feet
|
1 baths 3 beds |
$335,000
|
show details |

|
#2
S Crandon Ave # 319
Chicago, IL 60649
|
1,271 sq. feet
|
2 baths 2 beds |
$146,900
|
show details |

|
#3
W Barry Ave Apt 3bc
Chicago, IL 60657
|
2,500 sq. feet
|
3 baths 4 beds |
$699,000
|
show details |

|
#4
S Calumet Ave
Chicago, IL 60628
|
3,690 sq. feet
|
3 baths 6 beds |
$260,000
|
show details |

|
#5
Raymond Ave
Brookfield, IL 60513
|
1,020 sq. feet
|
1 baths 2 beds |
$219,900
|
show details |

|
#6
S Main St
Hometown, IL 60456
|
744 sq. feet
|
1 baths 2 beds |
$175,000
|
show details |

|
#7
W 21st St # 1
Chicago, IL 60608
|
1,250 sq. feet
|
1 baths 3 beds |
$219,900
|
show details |

|
#8
Newcastle Ave
Westchester, IL 60154
|
1,640 sq. feet
|
1 baths 2 beds |
$239,200
|
show details |

|
#9
S Vanderpoel Ave
Chicago, IL 60643
|
2,352 sq. feet
|
2 baths 7 beds |
$115,000
|
show details |

|
#10
E Crest Ave
Addison, IL 60101
|
2,023 sq. feet
|
1 baths 5 beds |
$329,000
|
show details |
| Photo | Address | Area | Beds / Baths | Price | Details |
|---|---|---|---|---|---|

|
#11
N 74th Ave
Elmwood Park, IL 60707
|
1,300 sq. feet
|
1 baths 3 beds |
$235,000
|
show details |

|
#12
145th St
Midlothian, IL 60445
|
2,000 sq. feet
|
1 baths 3 beds |
$179,900
|
show details |

|
#13
S Yale Ave
Chicago, IL 60628
|
1,608 sq. feet
|
2 baths 3 beds |
$270,000
|
show details |

|
#14
S Ada St
Chicago, IL 60636
|
2,619 sq. feet
|
2 baths 6 beds |
$244,400
|
show details |

|
#15
S Ridgeland Ave
Oak Park, IL 60302
|
2,400 sq. feet
|
3 baths 4 beds |
$625,000
|
show details |

|
#16
S East End Ave # 2
Chicago, IL 60649
|
1,200 sq. feet
|
2 baths 2 beds |
$137,000
|
show details |

|
#17
N Olcott Ave
Chicago, IL 60634
|
2,161 sq. feet
|
2 baths 4 beds |
$559,000
|
show details |

|
#18
Main St
Skokie, IL 60076
|
1,428 sq. feet
|
1 baths 3 beds |
$455,000
|
show details |

|
#19
N Austin Ave
Chicago, IL 60634
|
2,500 sq. feet
|
3 baths 4 beds |
$365,000
|
show details |

|
#20
S Tripp Ave
Oak Lawn, IL 60453
|
1,591 sq. feet
|
1 baths 3 beds |
$212,000
|
show details |
| Photo | Address | Area | Beds / Baths | Price | Details |
|---|---|---|---|---|---|

|
#21
S 87th Ave
Justice, IL 60458
|
2,725 sq. feet
|
3 baths 4 beds |
$585,000
|
show details |

|
#22
W 63rd St
Chicago, IL 60638
|
1,250 sq. feet
|
2 baths 4 beds |
$385,000
|
show details |

|
#23
N Sheridan Rd Apt 6e
Chicago, IL 60660
|
1,200 sq. feet
|
2 baths 2 beds |
$255,000
|
show details |

|
#24
S Union Ave
Chicago, IL 60620
|
1,920 sq. feet
|
2 baths 4 beds |
$75,000
|
show details |

|
#25
W 100th Pl
Chicago, IL 60628
|
971 sq. feet
|
1 baths 2 beds |
$233,000
|
show details |

|
#26
E 46th St
Chicago, IL 60653
|
2,126 sq. feet
|
2 baths 2 beds |
$289,000
|
show details |

|
#27
W 108th St Apt D
Chicago, IL 60643
|
1,300 sq. feet
|
2 baths 3 beds |
$144,900
|
show details |

|
#28
W Arquilla Dr
Palos Heights, IL 60463
|
1,780 sq. feet
|
2 baths 2 beds |
$299,900
|
show details |

|
#29
- 24 S Kimbark Unit 105
Chicago, IL 60637
|
600 sq. feet
|
1 baths 1 beds |
$137,000
|
show details |

|
#30
W Van Buren St
Chicago, IL 60644
|
2,839 sq. feet
|
3 baths 8 beds |
$87,500
|
show details |
| Photo | Address | Area | Beds / Baths | Price | Details |
|---|---|---|---|---|---|

|
#31
N Francisco Ave
Chicago, IL 60659
|
1,100 sq. feet
|
1 baths 2 beds |
$159,000
|
show details |

|
#32
Webster Ln
Des Plaines, IL 60018
|
1,608 sq. feet
|
3 baths 3 beds |
$515,000
|
show details |

|
#33
S Lyman Ave
Des Plaines, IL 60016
|
2,233 sq. feet
|
2 baths 4 beds |
$330,000
|
show details |

|
#34
S Normal Ave
Chicago, IL 60628
|
989 sq. feet
|
1 baths 3 beds |
$154,375
|
show details |

|
#35
S 13th Ave
Maywood, IL 60153
|
1,176 sq. feet
|
1 baths 3 beds |
$279,900
|
show details |

|
#36
S Bennett Ave
Chicago, IL 60617
|
1,052 sq. feet
|
1 baths 3 beds |
$265,000
|
show details |

|
#37
S Emerald Ave
Chicago, IL 60620
|
1,080 sq. feet
|
1 baths 2 beds |
$34,900
|
show details |

|
#38
W Garfield Blvd
Chicago, IL 60636
|
2,820 sq. feet
|
2 baths 5 beds |
$132,500
|
show details |

|
#39
Christiana Ave # 1
Skokie, IL 60076
|
1,400 sq. feet
|
1 baths 3 beds |
$319,000
|
show details |

|
#40
S South Shore Dr Apt 1201
Chicago, IL 60649
|
1,100 sq. feet
|
2 baths 2 beds |
$179,000
|
show details |
| Photo | Address | Area | Beds / Baths | Price | Details |
|---|---|---|---|---|---|

|
#41
W 50th St
Chicago, IL 60609
|
- sq. feet
|
2 baths 6 beds |
$109,200
|
show details |

|
#42
S King Dr
Chicago, IL 60619
|
880 sq. feet
|
1 baths 2 beds |
$79,400
|
show details |

|
#43
W 95th Pl
Chicago, IL 60628
|
- sq. feet
|
1 baths 3 beds |
$114,400
|
show details |

|
#44
Woods Dr Unit Unit 2004
Skokie, IL 60077
|
- sq. feet
|
2 baths 3 beds |
$572,000
|
show details |

|
#45
Avenida Serra Test
Des Plaines, IL 60018
|
- sq. feet
|
2 baths 3 beds |
$100,000
|
show details |

|
#46
S Charles St
Chicago, IL 60643
|
- sq. feet
|
4 baths 6 beds |
$349,900
|
show details |

|
#47
W Quincy St
Chicago, IL 60644
|
960 sq. feet
|
1 baths - beds |
$19,000
|
show details |

|
#48
Washington Blvd Apt 1
Oak Park, IL 60302
|
- sq. feet
|
1 baths 2 beds |
$149,900
|
show details |

|
#49
W Arthington St
Chicago, IL 60612
|
969 sq. feet
|
1 baths - beds |
$20,000
|
show details |

|
Check over 1 million property listings on Foreclosure.com!
|
browse all offers | |||


 | Which indoor mall is most likely to die (poll)? (31 replies) |
| Adjacent suburbs that are vastly different from each other. (53 replies) |
| Buying Multiplex for Investment using home equity loan (33 replies) |
| Suburbs that are obscure or little-known (240 replies) |
| Suburbs of Suburbs (32 replies) |
| Medical professional working at Loyola hosp. needs advice regarding loctation and purchase vs. renting (155 replies) |

Median year apartment built: 1962
Household type by relationship:
Households: 7,084- Male householders: 1,151 (321 living alone), Female householders: 1,720 (585 living alone)
1,208 spouses (1,144 opposite-sex spouses), 157 unmarried partners, (151 opposite-sex unmarried partners), 2,525 children (2,443 natural, 0 adopted, 82 stepchildren), 131 grandchildren, 33 brothers or sisters, 40 parents, 0 foster children, 0 other relatives, 60 non-relatives
- In group quarters: 54
Size of family households: 876 2-persons, 377 3-persons, 402 4-persons, 195 5-persons, 61 6-persons.
Size of nonfamily households: 974 1-person, 99 2-persons.
869 married couples with children.
533 single-parent households (33 men, 500 women).
74.1% of residents of North Riverside speak English at home.
19.6% of residents speak Spanish at home (82% speak English very well, 16% speak English well, 2% speak English not well).
3.9% of residents speak other Indo-European language at home (59% speak English very well, 8% speak English well, 33% speak English not well).
0.7% of residents speak Asian or Pacific Island language at home (100% speak English very well).
1.6% of residents speak other language at home (100% speak English very well).
Foreign born population: 830 (11.7%)
(82.8% of them are naturalized citizens)
| Here: | 5.7 |
| State: | 6.4 |
| Here: | 4.1 |
| State: | 4.1 |

- Bedrooms in owner-occupied houses and condos in North Riverside, Illinois
- 0no bedroom
- 41 bedroom
- 8662 bedrooms
- 9623 bedrooms
- 1484 bedrooms
- 345+ bedrooms

- Bedrooms in renter-occupied apartments in North Riverside, Illinois
- 0no bedroom
- 2021 bedroom
- 5722 bedrooms
- 673 bedrooms
- 1284 bedrooms
- 175+ bedrooms

- Cars and other vehicles available in North Riverside in owner-occupied houses/condos
- 127no vehicle
- 8201 vehicle
- 6462 vehicles
- 3653 vehicles
- 344 vehicles
- 235+ vehicles

- Cars and other vehicles available in North Riverside in renter-occupied apartments
- 84no vehicle
- 7701 vehicle
- 1332 vehicles
- 03 vehicles
- 04 vehicles
- 05+ vehicles

- Rooms in owner-occupied houses in North Riverside, Illinois
- 01 room
- 02 rooms
- 43 rooms
- 2354 rooms
- 6645 rooms
- 5106 rooms
- 3147 rooms
- 1308 rooms
- 1589+ rooms

- Rooms in renter-occupied apartments in North Riverside, Illinois
- 01 room
- 02 rooms
- 1593 rooms
- 4714 rooms
- 1625 rooms
- 496 rooms
- 07 rooms
- 08 rooms
- 1459+ rooms


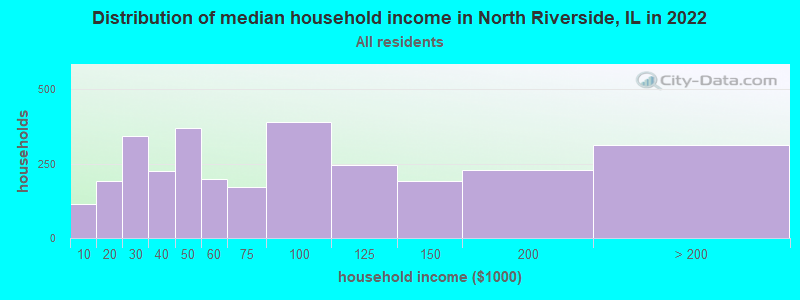
North Riverside, IL household income distribution

- 114Less than $10,000
- 191$10,000 to $19,999
- 343$20,000 to $29,999
- 224$30,000 to $39,999
- 370$40,000 to $49,999
- 199$50,000 to $59,999
- 172$60,000 to $74,999
- 390$75,000 to $99,999
- 245$100,000 to $124,999
- 193$125,000 to $149,999
- 230$150,000 to $199,999
- 314$200,000 or more
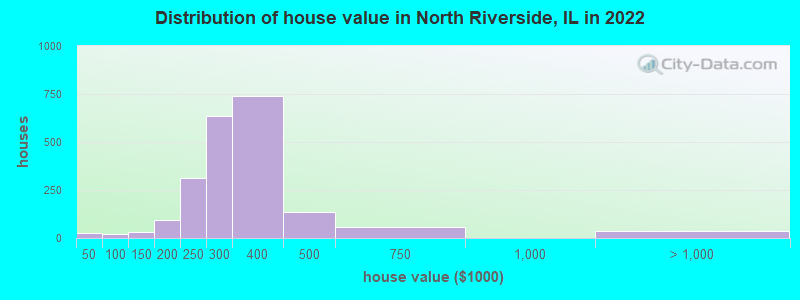
Home value of owner - occupied houses in 2022 in North Riverside, IL
-
- 9Less than $10,000
- 15$25,000 to $29,999
- 20$80,000 to $89,999
- 28$100,000 to $124,999
- 4$125,000 to $149,999
- 34$150,000 to $174,999
- 59$175,000 to $199,999
- 312$200,000 to $249,999
- 634$250,000 to $299,999
- 737$300,000 to $399,999
- 133$400,000 to $499,999
- 55$500,000 to $749,999
- 26$1,000,000 to $1,499,999
- 12$2,000,000 or more
Rent paid by renters in 2022 in North Riverside, IL
-
- 58$500 to $549
- 45$600 to $649
- 16$750 to $799
- 84$800 to $899
- 107$900 to $999
- 355$1,000 to $1,249
- 128$1,250 to $1,499
- 32$2,000 to $2,499
- 179No cash rent


Percentage of workers working in this county: 81.5%
Number of people working at home: 501 (16.4% of all workers)
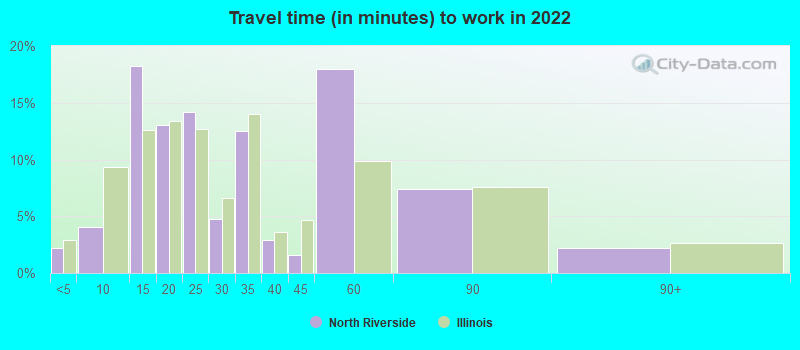
Travel time to work (commute)
- Less than 5 minutes: 139
- 5 to 9 minutes: 224
- 10 to 14 minutes: 476
- 15 to 19 minutes: 323
- 20 to 24 minutes: 101
- 25 to 29 minutes: 247
- 30 to 34 minutes: 270
- 35 to 39 minutes: 14
- 40 to 44 minutes: 174
- 45 to 59 minutes: 302
- 60 to 89 minutes: 159
- 90 or more minutes: 123
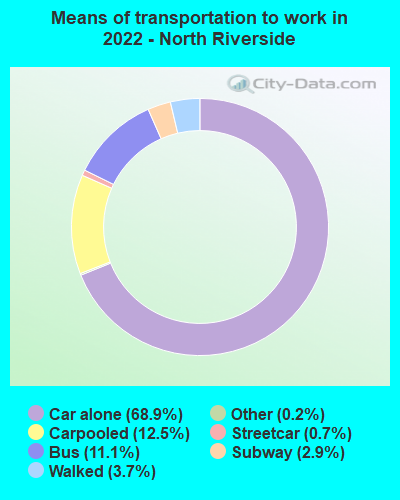
Means of transportation to work:
- Drove a car alone: 2,136 (59.8%)
- Carpooled: 416 (11.6%)
- Bus: 318 (8.9%)
- Subway or elevated rail: 16 (0.4%)
- Long-distance train or commuter rail: 62 (1.7%)
- Taxi: 7 (0.2%)
- Walked: 117 (3.3%)
- Worked at home: 501 (14.0%)

- Unemployment by race in 2022
- Unemployment rate for White non-Hispanic residents
- 1.2%Males
- 6.3%Females
- Unemployment rate for other race residents
- 8.3%Males
- 54.8%Females
- Unemployment rate for Hispanic or Latino residents
- 2.8%Males
- 18.5%Females

- Year of entry for the foreign-born population in North Riverside, Illinois
- 622010 or later
- 1552000 to 2009
- 1781990 to 1999
- 2031980 to 1989
- 1251970 to 1979
- 359Before 1970
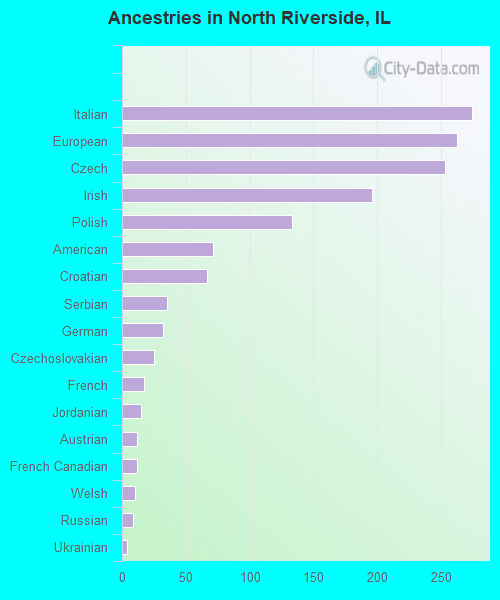
First ancestries reported:
- Italian: 274 (8.6%)
- European: 263 (8.3%)
- Czech: 253 (7.9%)
- Irish: 196 (6.2%)
- Polish: 133 (4.2%)
- American: 71 (2.2%)
- Croatian: 67 (2.1%)
- Serbian: 35 (1.1%)
- German: 32 (1.0%)
- Czechoslovakian: 25 (0.8%)
- French: 17 (0.5%)
- Jordanian: 15 (0.5%)
- Austrian: 12 (0.4%)
- French Canadian: 12 (0.4%)
- Welsh: 10 (0.3%)
- Russian: 9 (0.3%)
- Ukrainian: 4 (0.1%)
Most common places of birth for foreign-born residents (%):
| North Riverside: | 67.7% (562) |
| Illinois: | 34.7% (626,958) |
| North Riverside: | 9.9% (82) |
| Illinois: | 0.9% (15,679) |
| North Riverside: | 5.4% (45) |
| Illinois: | 2.2% (40,393) |
| North Riverside: | 3.5% (29) |
| Illinois: | 0.5% (9,834) |
| North Riverside: | 3.4% (28) |
| Illinois: | 1.0% (18,753) |
| North Riverside: | 3.0% (25) |
| Illinois: | 0.5% (8,827) |
| North Riverside: | 2.9% (24) |
| Illinois: | 5.2% (93,003) |
Place of birth for U.S.-born residents:
- This state: 5,399
- Other state: 808
- Northeast: 115
- Midwest: 321
- South: 256
- West: 112
94.8% of North Riverside residents lived in the same house 1 years ago.
Out of people who lived in different houses, 46.3% lived in this county.
Out of people who lived in different counties, 0.0% lived in Illinois.
| North Riverside: | 94.8% |
| State average: | 88.3% |
Education attainment for males 25 years and older:
- No schooling: 0
- Nursery to 4th grade: 0
- 5th and 6th grade: 12
- 7th and 8th grade: 32
- 9th grade: 8
- 10th grade: 0
- 11th grade: 41
- 12th grade, no diploma: 6
- High school graduate (or equivalency): 668
- Less than 1 year of college: 159
- Some college more than 1 year, no degree: 328
- Associate degree: 106
- Bachelor's degree: 568
- Master's degree: 254
- Professional school degree: 24
- Doctorate degree: 25

Education attainment for females 25 years and older:
- No schooling: 16
- Nursery to 4th grade: 0
- 5th and 6th grade: 21
- 7th and 8th grade: 56
- 9th grade: 13
- 10th grade: 0
- 11th grade: 39
- 12th grade, no diploma: 26
- High school graduate (or equivalency): 742
- Less than 1 year of college: 95
- Some college more than 1 year, no degree: 295
- Associate degree: 305
- Bachelor's degree: 552
- Master's degree: 420
- Professional school degree: 60
- Doctorate degree: 0


Housing units in structures:
- One, detached: 2,090
- One, attached: 56
- Two: 100
- 3 or 4: 79
- 5 to 9: 636
- 10 to 19: 29
- 20 to 49: 31
- 50 or more: 95
House/condo owner moved in on average 18 years ago
Renter moved in on average 2 years ago

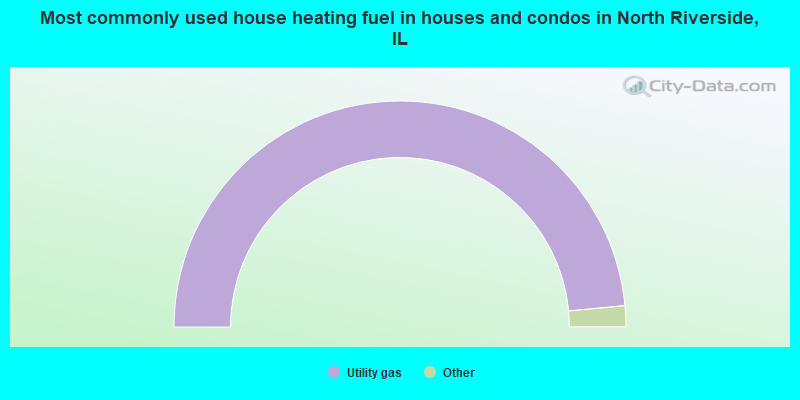
- 97.0%Utility gas
- 2.3%Electricity
- 0.7%Bottled, tank, or LP gas
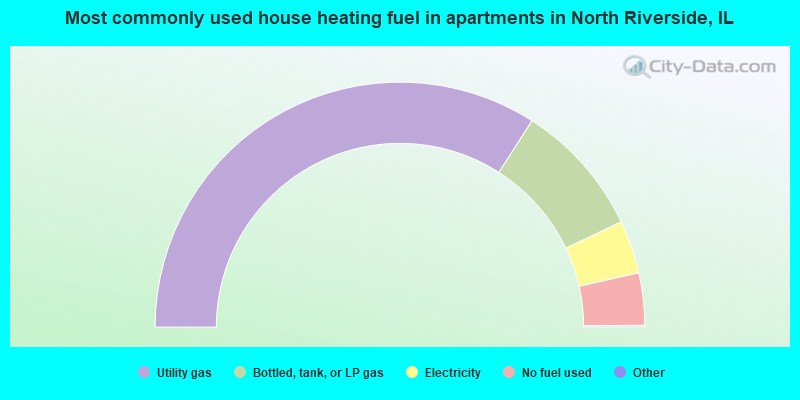
- 68.2%Utility gas
- 17.8%Bottled, tank, or LP gas
- 7.0%Electricity
- 6.9%No fuel used
Private vs. public school enrollment:
| Here: | 0.0% |
| Illinois: | 13.3% |
| Here: | 0.0% |
| Illinois: | 9.9% |
| Here: | 28.4% |
| Illinois: | 27.4% |


