North Augusta, SC (South Carolina) Houses and Residents
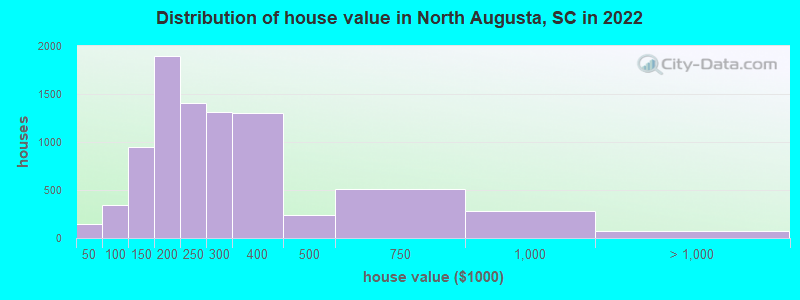
Estimated median house or condo value in 2022: $245,347 (it was $89,500 in 2000 )
North Augusta:
$245,347South Carolina:
$254,600
Lower value quartile - upper value quartile: $167,761 - $340,920Total population: 22,300 (Urban population: 17,014, Rural population: 162 (all nonfarm) )
Houses: 12,743 (11,207 occupied: 8,129 owner occupied, 3,304 renter occupied )
% of renters here:
29%State:
28%
Housing density: 741 houses/condos per square mile
Median price asked for vacant for-sale houses and condos in 2022: $382,026.
Median contract rent in 2022: $822 (lower quartile is $616, upper quartile is $1,008)
Median rent asked for vacant for-rent units in 2022: $2,316
Median gross rent in North Augusta, SC in 2022: $983
Housing units in North Augusta with a mortgage: 5,343 (384 second mortgage, 56 home equity loan, 251 both second mortgage and home equity loan )Houses without a mortgage: 123
Median household income for houses/condos with a mortgage: $101,127
Median household income for apartments without a mortgage: $77,720
Median monthly housing costs: $987
Data:
Median house or condo value ($)
Median house or condo value ($ change since 2000)
Median house or condo value ($) - White
Median house or condo value ($) - Black or African American
Median house or condo value ($) - Asian
Median house or condo value ($) - Hispanic or Latino
Median house or condo value ($) - American Indian and Alaska Native
Median house or condo value ($) - Multirace
Median house or condo value ($) - Other Race
Median price asked for mobile homes ($)
Household density (households per square mile)
Mean house or condo value by units in structure - 1, detached ($)
Mean house or condo value by units in structure - 1, attached ($)
Mean house or condo value by units in structure - 2 ($)
Mean house or condo value by units in structure by units in structure - 3 or 4 ($)
Mean house or condo value by units in structure - 5 or more ($)
Mean house or condo value by units in structure - Boat, RV, van, etc. ($)
Mean house or condo value by units in structure - Mobile home ($)
Median contract rent ($)
Median contract rent - Lower quartile ($)
Median contract rent - Upper quartile ($)
Median gross rent ($)
Urban houses (%)
Rural houses (%)
Houses occupied (%)
Houses occupied (% change since 2000)
Houses owner occupied (%)
Houses owner occupied (% change since 2000)
Houses renter occupied (%)
Houses renter occupied (% change since 2000)
Vacant housing units - For rent (%)
Vacant housing units - For rent (% change since 2000)
Vacant housing units - For sale only (%)
Vacant housing units - For sale only (% change since 2000)
Vacant housing units - Rented or sold, not occupied (%)
Vacant housing units - Rented or sold, not occupied (% change since 2000)
Vacant housing units - For seasonal, recreational, or occasional use (%)
Vacant housing units - For seasonal, recreational, or occasional use (% change since 2000)
Vacant housing units - For migrant workers (%)
Vacant housing units - For migrant workers (% change since 2000)
Vacant housing units - Other vacant (%)
Vacant housing units - Other vacant (% change since 2000)
Median monthly housing costs ($)
Median household income for houses/condos with a mortgage ($)
Median household income for houses/condos without a mortgage ($)
Median household income ($)
Median household income ($) - White
Median household income ($) - Black or African American
Median household income ($) - Asian
Median household income ($) - Hispanic or Latino
Median household income ($) - American Indian and Alaska Native
Median household income ($) - Multirace
Median household income ($) - Other Race
Mortgage status - with mortgage (%)
Mortgage status - with second mortgage (%)
Mortgage status - with home equity loan (%)
Mortgage status - with both second mortgage and home equity loan (%)
Mortgage status - without a mortgage (%)
Median year house/condo built
Median year apartment built
Household type by relationship - Male householder living alone (%)
Household type by relationship - Male householder not living alone (%)
Household type by relationship - Female householder living alone (%)
Household type by relationship - Female householder not living alone (%)
Household type by relationship - Opposite-Sex spouse (%)
Household type by relationship - Same-Sex spouse (%)
Household type by relationship - Opposite-Sex unmarried partner (%)
Household type by relationship - Same-Sex unmarried partner (%)
Household type by relationship - In group quarters (%)
Size of family households - 2-person household (%)
Size of family households - 3-person household (%)
Size of family households - 4-person household (%)
Size of family households - 5-person household (%)
Size of family households - 6-person household (%)
Size of family households - 7-or-more-person household (%)
Size of nonfamily households - 1-person household (%)
Size of nonfamily households - 2-person household (%)
Size of nonfamily households - 3-person household (%)
Size of nonfamily households - 4-person household (%)
Size of nonfamily households - 5-person household (%)
Size of nonfamily households - 6-person household (%)
Size of nonfamily households - 7-or-moreperson household (%)
Year house built - Built 2010 or later (%)
Year house built - Built 2000 to 2009 (%)
Year house built - Built 1990 to 1999 (%)
Year house built - Built 1980 to 1989 (%)
Year house built - Built 1970 to 1979 (%)
Year house built - Built 1960 to 1969 (%)
Year house built - Built 1950 to 1959 (%)
Year house built - Built 1940 to 1949 (%)
Year house built - Built 1939 or earlier (%)
Median number of rooms in houses and condos
Median number of rooms in apartments
Median number of bedrooms in owner occupied houses
Mean number of bedrooms in owner occupied houses
Median number of bedrooms in renter occupied houses
Mean number of bedrooms in renter occupied houses
Median number of vehichles in owner occupied houses
Mean number of vehichles in owner occupied houses
Median number of vehichles in renter occupied houses
Mean number of vehichles in renter occupied houses
Rooms in owner-occupied houses - 1 room (%)
Rooms in owner-occupied houses - 2 rooms (%)
Rooms in owner-occupied houses - 3 rooms (%)
Rooms in owner-occupied houses - 4 rooms (%)
Rooms in owner-occupied houses - 5 rooms (%)
Rooms in owner-occupied houses - 6 rooms (%)
Rooms in owner-occupied houses - 7 rooms (%)
Rooms in owner-occupied houses - 8 rooms (%)
Rooms in owner-occupied houses - 9+ rooms (%)
Rooms in renter-occupied houses - 1 room (%)
Rooms in renter-occupied houses - 2 rooms (%)
Rooms in renter-occupied houses - 3 rooms (%)
Rooms in renter-occupied houses - 4 rooms (%)
Rooms in renter-occupied houses - 5 rooms (%)
Rooms in renter-occupied houses - 6 rooms (%)
Rooms in renter-occupied houses - 7 rooms (%)
Rooms in renter-occupied houses - 8 rooms (%)
Rooms in renter-occupied houses - 9+ rooms (%)
Bedrooms in owner-occupied houses - no bedrooms (%)
Bedrooms in owner-occupied houses - 1 bedroom (%)
Bedrooms in owner-occupied houses - 2 bedrooms (%)
Bedrooms in owner-occupied houses - 3 bedrooms (%)
Bedrooms in owner-occupied houses - 4 bedrooms (%)
Bedrooms in owner-occupied houses - 5+ bedrooms (%)
Bedrooms in renter-occupied houses - no bedrooms (%)
Bedrooms in renter-occupied houses - 1 bedroom (%)
Bedrooms in renter-occupied houses - 2 bedrooms (%)
Bedrooms in renter-occupied houses - 3 bedrooms (%)
Bedrooms in renter-occupied houses - 4 bedrooms (%)
Bedrooms in renter-occupied houses - 5+ bedrooms (%)
Vehicles available in owner-occupied houses - no vehicle available (%)
Vehicles available in owner-occupied houses - 1 vehicle available(%)
Vehicles available in owner-occupied houses - 2 Vehicles available (%)
Vehicles available in owner-occupied houses - 3 Vehicles available (%)
Vehicles available in owner-occupied houses - 4 Vehicles available (%)
Vehicles available in owner-occupied houses - 5+ Vehicles available (%)
Vehicles available in renter-occupied houses - no vehicle available (%)
Vehicles available in renter-occupied houses - 1 vehicle available (%)
Vehicles available in renter-occupied houses - 2 Vehicles available (%)
Vehicles available in renter-occupied houses - 3 Vehicles available (%)
Vehicles available in renter-occupied houses - 4 Vehicles available (%)
Vehicles available in renter-occupied houses - 5+ Vehicles available (%)
Housing units in structures - 1, detached (%)
Housing units in structures - 1, attached (%)
Housing units in structures - 2 (%)
Housing units in structures - 3 or 4 (%)
Housing units in structures - 5 to 9 (%)
Housing units in structures - 10 to 19 (%)
Housing units in structures - 20 to 49 (%)
Housing units in structures - 50 or more (%)
Housing units in structures - Mobile home (%)
Housing units in structures - Boat, RV, van, etc. (%)
Housing units in structures - Owners - 1, detached (%)
Housing units in structures - Owners - 1, attached (%)
Housing units in structures - Owners - 2 (%)
Housing units in structures - Owners - 3 or 4 (%)
Housing units in structures - Owners - 5 to 9 (%)
Housing units in structures - Owners - 10 to 19 (%)
Housing units in structures - Owners - 20 to 49 (%)
Housing units in structures - Owners - 50 or more (%)
Housing units in structures - Owners - Mobile home (%)
Housing units in structures - Owners - Boat, RV, van, etc. (%)
Housing units in structures - Renters - 1, detached (%)
Housing units in structures - Renters - 1, attached (%)
Housing units in structures - Renters - 2 (%)
Housing units in structures - Renters - 3 or 4 (%)
Housing units in structures - Renters - 5 to 9 (%)
Housing units in structures - Renters - 10 to 19 (%)
Housing units in structures - Renters - 20 to 49 (%)
Housing units in structures - Renters - 50 or more (%)
Housing units in structures - Renters - Mobile home (%)
Housing units in structures - Renters - Boat, RV, van, etc. (%)
House/condo owner moved in on average (years ago)
Renter moved in on average (years ago)
Year householder moved into unit - Moved in 1999 to March 2000 (%)
Year householder moved into unit - Moved in 1999 to March 2000 (%) - White
Year householder moved into unit - Moved in 1999 to March 2000 (%) - Black or African American
Year householder moved into unit - Moved in 1999 to March 2000 (%) - Asian
Year householder moved into unit - Moved in 1999 to March 2000 (%) - Hispanic or Latino
Year householder moved into unit - Moved in 1999 to March 2000 (%) - American Indian and Alaska Native
Year householder moved into unit - Moved in 1999 to March 2000 (%) - Multirace
Year householder moved into unit - Moved in 1999 to March 2000 (%) - Other Race
Year householder moved into unit - Moved in 1995 to 1998 (%)
Year householder moved into unit - Moved in 1995 to 1998 (%) - White
Year householder moved into unit - Moved in 1995 to 1998 (%) - Black or African American
Year householder moved into unit - Moved in 1995 to 1998 (%) - Asian
Year householder moved into unit - Moved in 1995 to 1998 (%) - Hispanic or Latino
Year householder moved into unit - Moved in 1995 to 1998 (%) - American Indian and Alaska Native
Year householder moved into unit - Moved in 1995 to 1998 (%) - Multirace
Year householder moved into unit - Moved in 1995 to 1998 (%) - Other Race
Year householder moved into unit - Moved in 1990 to 1994 (%)
Year householder moved into unit - Moved in 1990 to 1994 (%) - White
Year householder moved into unit - Moved in 1990 to 1994 (%) - Black or African American
Year householder moved into unit - Moved in 1990 to 1994 (%) - Asian
Year householder moved into unit - Moved in 1990 to 1994 (%) - Hispanic or Latino
Year householder moved into unit - Moved in 1990 to 1994 (%) - American Indian and Alaska Native
Year householder moved into unit - Moved in 1990 to 1994 (%) - Multirace
Year householder moved into unit - Moved in 1990 to 1994 (%) - Other Race
Year householder moved into unit - Moved in 1980 to 1989 (%)
Year householder moved into unit - Moved in 1980 to 1989 (%) - White
Year householder moved into unit - Moved in 1980 to 1989 (%) - Black or African American
Year householder moved into unit - Moved in 1980 to 1989 (%) - Asian
Year householder moved into unit - Moved in 1980 to 1989 (%) - Hispanic or Latino
Year householder moved into unit - Moved in 1980 to 1989 (%) - American Indian and Alaska Native
Year householder moved into unit - Moved in 1980 to 1989 (%) - Multirace
Year householder moved into unit - Moved in 1980 to 1989 (%) - Other Race
Year householder moved into unit - Moved in 1970 to 1979 (%)
Year householder moved into unit - Moved in 1970 to 1979 (%) - White
Year householder moved into unit - Moved in 1970 to 1979 (%) - Black or African American
Year householder moved into unit - Moved in 1970 to 1979 (%) - Asian
Year householder moved into unit - Moved in 1970 to 1979 (%) - Hispanic or Latino
Year householder moved into unit - Moved in 1970 to 1979 (%) - American Indian and Alaska Native
Year householder moved into unit - Moved in 1970 to 1979 (%) - Multirace
Year householder moved into unit - Moved in 1970 to 1979 (%) - Other Race
Year householder moved into unit - Moved in 1969 or earlier (%)
Year householder moved into unit - Moved in 1969 or earlier (%) - White
Year householder moved into unit - Moved in 1969 or earlier (%) - Black or African American
Year householder moved into unit - Moved in 1969 or earlier (%) - Asian
Year householder moved into unit - Moved in 1969 or earlier (%) - Hispanic or Latino
Year householder moved into unit - Moved in 1969 or earlier (%) - American Indian and Alaska Native
Year householder moved into unit - Moved in 1969 or earlier (%) - Multirace
Year householder moved into unit - Moved in 1969 or earlier (%) - Other Race
Housing units lacking complete plumbing facilities (%)
Housing units lacking complete kitchen facilities (%)
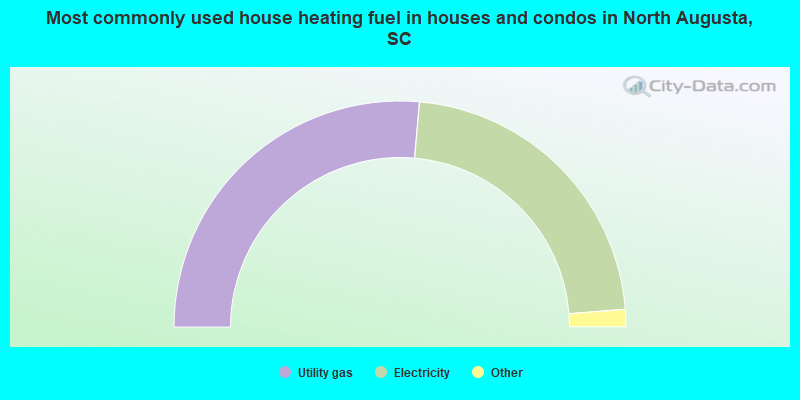
House heating fuel used in houses and condos - Utility gas (%)
House heating fuel used in houses and condos - Bottled, tank, or LP gas (%)
House heating fuel used in houses and condos - Electricity (%)
House heating fuel used in houses and condos - Fuel oil, kerosene, etc. (%)
House heating fuel used in houses and condos - Coal or coke (%)
House heating fuel used in houses and condos - Wood (%)
House heating fuel used in houses and condos - Solar energy (%)
House heating fuel used in houses and condos - Other fuel (%)
House heating fuel used in houses and condos - No fuel used (%)
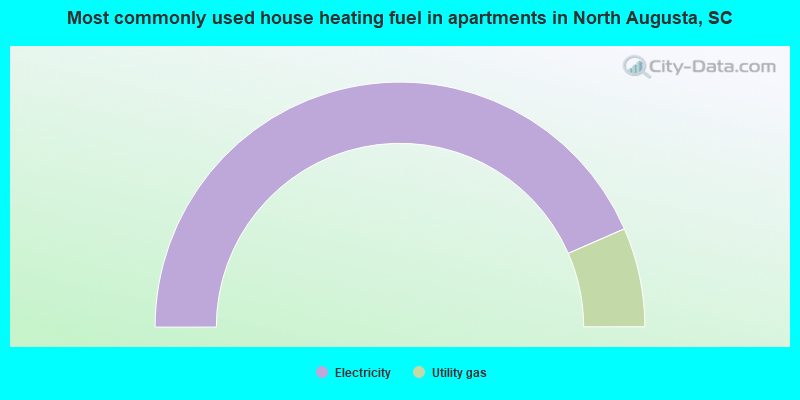
House heating fuel used in apartments - Utility gas (%)
House heating fuel used in apartments - Bottled, tank, or LP gas (%)
House heating fuel used in apartments - Electricity (%)
House heating fuel used in apartments - Fuel oil, kerosene, etc. (%)
House heating fuel used in apartments - Coal or coke (%)
House heating fuel used in apartments - Wood (%)
House heating fuel used in apartments - Solar energy (%)
House heating fuel used in apartments - Other fuel (%)
House heating fuel used in apartments - No fuel used (%)
Median year house/condo built: 1989Median year apartment built: 1986Household type by relationship:
Households: 25,041
Male householders: 5,856 (1,621 living alone ), Female householders: 5,293 (1,877 living alone )5,603 spouses (5,599 opposite-sex spouses ), 603 unmarried partners , (603 opposite-sex unmarried partners ), 6,158 children (5,582 natural , 114 adopted , 461 stepchildren ), 157 grandchildren , 71 brothers or sisters , 313 parents , 26 foster children , 219 other relatives , 307 non-relatives In group quarters: 428
Size of family households: 3,750 2-persons , 2,016 3-persons , 753 4-persons , 428 5-persons , 236 6-persons , 10 7-or-more-persons .
Size of nonfamily households: 3,424 1-person , 766 2-persons , 26 3-persons .
3,196 married couples with children. single-parent households (392 men , 714 women ).
94.3% of residents of North Augusta speak English at home. of residents speak Spanish at home (78% speak English very well , 17% speak English well , 6% speak English not well ).of residents speak other Indo-European language at home (47% speak English very well , 53% speak English well ).of residents speak Asian or Pacific Island language at home (100% speak English very well ).
Foreign born population: 613 (2.4%)of them are naturalized citizens )
Median number of rooms in houses and condos:
Median number of rooms in apartments
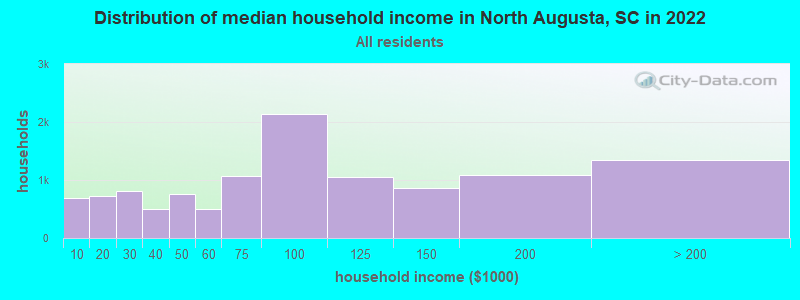
North Augusta, SC household income distribution 697 Less than $10,000717 $10,000 to $19,999813 $20,000 to $29,999504 $30,000 to $39,999754 $40,000 to $49,999492 $50,000 to $59,9991,065 $60,000 to $74,9992,144 $75,000 to $99,9991,056 $100,000 to $124,999866 $125,000 to $149,9991,079 $150,000 to $199,9991,351 $200,000 or more
Home value of owner - occupied houses in 2022 in North Augusta, SC 32 Less than $10,00073 $15,000 to $19,99921 $25,000 to $29,99914 $40,000 to $49,99938 $50,000 to $59,99975 $60,000 to $69,99915 $70,000 to $79,99928 $80,000 to $89,999172 $90,000 to $99,999501 $100,000 to $124,999444 $125,000 to $149,999993 $150,000 to $174,999900 $175,000 to $199,9991,404 $200,000 to $249,9991,313 $250,000 to $299,9991,305 $300,000 to $399,999244 $400,000 to $499,999507 $500,000 to $749,999281 $750,000 to $999,99977 $1,000,000 to $1,499,999Rent paid by renters in 2022 in North Augusta, SC 91 $200 to $24948 $300 to $34975 $450 to $499114 $500 to $54991 $550 to $599356 $600 to $649158 $650 to $69943 $700 to $749343 $750 to $799263 $800 to $899463 $900 to $999345 $1,000 to $1,249198 $1,250 to $1,49971 $1,500 to $1,99959 $2,000 to $2,499214 No cash rent
Percentage of workers working in this county: 44.9%Number of people working at home: 1,138 (8.6% of all workers )
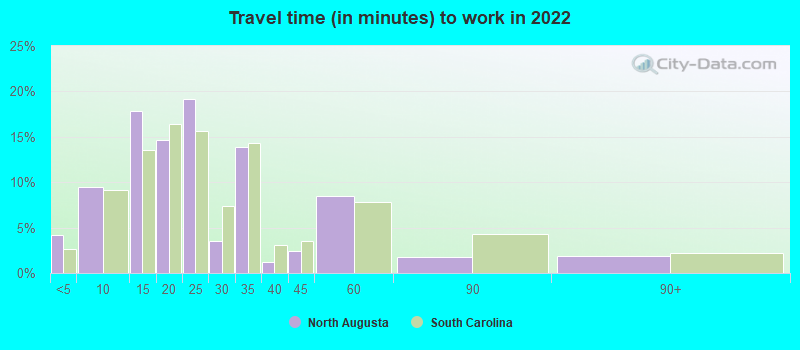
Travel time to work (commute)
Less than 5 minutes: 2265 to 9 minutes: 95710 to 14 minutes: 1,97215 to 19 minutes: 2,71620 to 24 minutes: 1,62525 to 29 minutes: 1,23130 to 34 minutes: 80335 to 39 minutes: 40740 to 44 minutes: 37945 to 59 minutes: 73460 to 89 minutes: 33490 or more minutes: 176
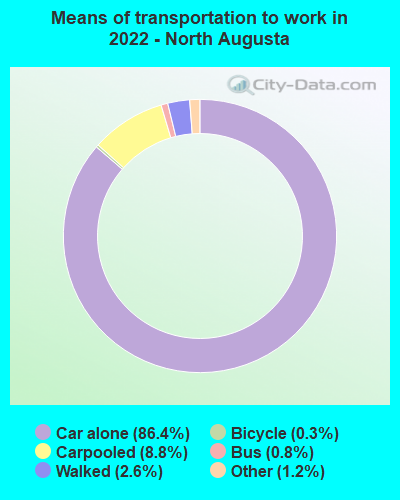
Means of transportation to work:
Drove a car alone: 7,039 (75.6%)Carpooled: 750 (8.1%)Bus : 56 (0.6%)Taxi: 105 (1.1%)Bicycle: 29 (0.3%)Walked: 196 (2.1%)Worked at home: 1,138 (12.2%)
Unemployment by race in 2022
Unemployment rate for White non-Hispanic residents 2.7% Males2.7% FemalesUnemployment rate for Black residents 2.3% FemalesUnemployment rate for two or more race residents 3.5% MalesUnemployment rate for Hispanic or Latino residents 9.8% Males9.0% Females
Year of entry for the foreign-born population in North Augusta, South Carolina
303 2010 or later 313 2000 to 2009 103 1990 to 1999 65 1980 to 1989 59 1970 to 1979 152 Before 1970
First ancestries reported:
American: 3,094 (22.7%)
English: 2,804 (20.6%)
German: 904 (6.6%)
Irish: 730 (5.4%)
European: 412 (3.0%)
Italian: 361 (2.7%)
Scottish: 283 (2.1%)
Scotch-Irish: 217 (1.6%)
French: 121 (0.9%)
French Canadian: 92 (0.7%)
Iranian: 78 (0.6%)
Greek: 73 (0.5%)
African: 73 (0.5%)
British: 55 (0.4%)
Norwegian: 50 (0.4%)
Polish: 50 (0.4%)
Swedish: 40 (0.3%)
Dutch: 34 (0.2%)
Romanian: 30 (0.2%)
Bulgarian: 16 (0.1%)
Scandinavian: 13 (0.10%)
Portuguese: 7 (0.05%)
Czechoslovakian: 5 (0.04%)
Jamaican: 1 (0.01%) Most common places of birth for foreign-born residents (%): Cuba North Augusta:
34.7% (267)South Carolina:
1.5% (3,987)
Mexico North Augusta:
18.9% (145)South Carolina:
22.5% (60,774)
India North Augusta:
17.9% (138)South Carolina:
6.8% (18,307)
Iran North Augusta:
11.8% (91)South Carolina:
0.5% (1,270)
Japan North Augusta:
6.2% (48)South Carolina:
0.8% (2,055)
Romania North Augusta:
3.8% (29)South Carolina:
0.6% (1,507)
Costa Rica North Augusta:
3.6% (28)South Carolina:
0.5% (1,395)
Colombia North Augusta:
3.1% (24)South Carolina:
4.3% (11,533)
China, excluding Hong Kong and Taiwan North Augusta:
2.5% (19)South Carolina:
3.2% (8,721)
Malaysia North Augusta:
2.5% (19)South Carolina:
0.0% (120)
Germany North Augusta:
2.2% (17)South Carolina:
3.7% (9,982)
Place of birth for U.S.-born residents:
This state: 4,664Other state: 19,894Northeast: 1,649Midwest: 2,250South: 15,633West: 541 87.4% of North Augusta residents lived in the same house 1 years ago.
Out of people who lived in different houses, 23.1% lived in this county.
Out of people who lived in different counties, 19.5% lived in South Carolina.
North Augusta:
87.4%State average:
86.5%
Education attainment for males 25 years and older:
No schooling: 40Nursery to 4th grade: 45th and 6th grade: 07th and 8th grade: 459th grade: 32310th grade: 14911th grade: 4912th grade, no diploma: 109High school graduate (or equivalency): 2,004Less than 1 year of college: 909Some college more than 1 year, no degree: 1,540Associate degree: 747Bachelor's degree: 2,368Master's degree: 601Professional school degree: 273Doctorate degree: 326
Education attainment for females 25 years and older:
No schooling: 81Nursery to 4th grade: 585th and 6th grade: 1227th and 8th grade: 709th grade: 13310th grade: 21011th grade: 7612th grade, no diploma: 68High school graduate (or equivalency): 2,300Less than 1 year of college: 563Some college more than 1 year, no degree: 1,761Associate degree: 946Bachelor's degree: 2,662Master's degree: 1,046Professional school degree: 193Doctorate degree: 216
Housing units in structures:
One, detached: 9,121One, attached: 1,109Two: 2343 or 4: 7135 to 9: 76210 to 19: 21020 to 49: 16950 or more: 150Mobile homes: 271Housing units lacking complete plumbing facilities in 2022: 1.6%Housing units lacking complete kitchen facilities in 2022: 2.4%House/condo owner moved in on average 7 years ago
Renter moved in on average 3 years ago
Private vs. public school enrollment:
Students in private schools in grades 1 to 8 (elementary and middle school): 186 Here:
9.8%South Carolina:
14.4%
Students in private schools in grades 9 to 12 (high school): 42 Here:
5.3%South Carolina:
11.1%
Students in private undergraduate colleges: 54 Here:
8.0%South Carolina:
21.9%