Newnan, GA (Georgia) Houses and Residents
| Newnan: | $350,607 |
| Georgia: | $297,400 |
Total population: 36,203 (Urban population: 15,383 (1,183 inside urbanized areas, 14,200 inside urban clusters), Rural population: 715 (all nonfarm))
Houses: 17,825 (17,129 occupied: 9,632 owner occupied, 7,428 renter occupied)
| % of renters here: | 44% |
| State: | 34% |
Housing density: 995 houses/condos per square mile
Median price asked for vacant for-sale houses and condos in 2022: $217,867.
Median contract rent in 2022: $1,176 (lower quartile is $674, upper quartile is $1,480)
Median rent asked for vacant for-rent units in 2022: $1,167
Median gross rent in Newnan, GA in 2022: $1,337
Housing units in Newnan with a mortgage: 7,146 (624 second mortgage, 101 home equity loan, 522 both second mortgage and home equity loan)
Houses without a mortgage: 70
Median household income for houses/condos with a mortgage: $106,935
Median household income for apartments without a mortgage: $72,330
Median monthly housing costs: $1,392
Compare current foreclosures in Newnan, GA:
| Photo | Address | Area | Beds / Baths | Price | Details |
|---|---|---|---|---|---|

|
#1
Stonebridge Xing
Newnan, GA 30265
|
1,680 sq. feet
|
3 baths 3 beds |
show details | |

|
#2
Griffin Dr
Newnan, GA 30263
|
1,536 sq. feet
|
2 baths 3 beds |
show details | |

|
#3
Olmstead Trce
Newnan, GA 30263
|
3,286 sq. feet
|
2 baths 3 beds |
show details | |

|
#4
Leah Dr
Newnan, GA 30265
|
2,682 sq. feet
|
2 baths 3 beds |
show details | |

|
#5
Old Carrollton Rd
Newnan, GA 30263
|
1,667 sq. feet
|
2 baths 3 beds |
show details | |

|
#6
Wentworth Way
Newnan, GA 30265
|
2,522 sq. feet
|
3 baths 3 beds |
show details | |

|
#7
Pebble Pl
Newnan, GA 30265
|
1,777 sq. feet
|
2 baths 3 beds |
show details | |

|
#8
Kingsbrook Cir
Newnan, GA 30265
|
1,846 sq. feet
|
2 baths 3 beds |
show details | |

|
#9
Pine Cres
Newnan, GA 30265
|
2,598 sq. feet
|
2 baths 3 beds |
show details | |

|
#10
Mallard Dr
Newnan, GA 30263
|
1,232 sq. feet
|
2 baths 3 beds |
show details |
| Photo | Address | Area | Beds / Baths | Price | Details |
|---|---|---|---|---|---|

|
#11
Baldwin Ct
Newnan, GA 30263
|
1,893 sq. feet
|
2 baths 3 beds |
show details | |

|
#12
Ware Rd
Newnan, GA 30263
|
3,986 sq. feet
|
2 baths - beds |
show details | |

|
#13
Holbrook Rd
Newnan, GA 30263
|
2,320 sq. feet
|
2 baths - beds |
show details | |

|
#14
Columns Way
Newnan, GA 30265
|
1,927 sq. feet
|
2 baths - beds |
show details | |

|
#15
Emory St
Newnan, GA 30265
|
1,866 sq. feet
|
4 baths - beds |
show details | |

|
#16
Stonebridge Xing
Newnan, GA 30265
|
1,746 sq. feet
|
2 baths - beds |
show details | |

|
#17
Lake Ridge Rd
Newnan, GA 30263
|
4,456 sq. feet
|
2 baths - beds |
show details | |

|
#18
Midway Rd
Newnan, GA 30263
|
1,534 sq. feet
|
2 baths - beds |
show details | |

|
#19
Covington Ter
Newnan, GA 30263
|
1,576 sq. feet
|
2 baths - beds |
show details | |

|
#20
Westgate Park Ln
Newnan, GA 30263
|
1,375 sq. feet
|
1 baths - beds |
show details |
| Photo | Address | Area | Beds / Baths | Price | Details |
|---|---|---|---|---|---|

|
#21
Candlewood Ct
Newnan, GA 30265
|
1,916 sq. feet
|
2 baths - beds |
show details | |

|
#22
Springfield Ct
Newnan, GA 30265
|
3,706 sq. feet
|
3 baths - beds |
show details | |

|
#23
Austin Rd
Newnan, GA 30263
|
1,350 sq. feet
|
1 baths - beds |
show details | |

|
#24
Covey Trl
Newnan, GA 30265
|
1,188 sq. feet
|
2 baths - beds |
show details | |

|
#25
Cates Rd
Newnan, GA 30263
|
1,180 sq. feet
|
2 baths - beds |
show details | |

|
#26
Chastain Way
Newnan, GA 30263
|
1,440 sq. feet
|
2 baths - beds |
show details | |

|
#27
Fair St
Newnan, GA 30263
|
1,306 sq. feet
|
1 baths - beds |
show details | |

|
#28
Macedonia Rd
Newnan, GA 30263
|
1,606 sq. feet
|
3 baths - beds |
show details | |

|
#29
Maple Dr
Newnan, GA 30263
|
1,008 sq. feet
|
1 baths - beds |
show details | |

|
#30
Cherokee St
Newnan, GA 30263
|
825 sq. feet
|
1 baths - beds |
show details |
| Photo | Address | Area | Beds / Baths | Price | Details |
|---|---|---|---|---|---|

|
#31
Posey Ridge Ct
Newnan, GA 30265
|
2,328 sq. feet
|
2 baths - beds |
show details | |

|
#32
Pintail Dr
Newnan, GA 30263
|
1,928 sq. feet
|
2 baths - beds |
show details | |

|
#33
River Park Trl
Newnan, GA 30265
|
1,488 sq. feet
|
2 baths - beds |
show details | |

|
#34
Walt Carmichael Rd
Newnan, GA 30263
|
1,284 sq. feet
|
2 baths - beds |
show details | |

|
#35
Paces Landing Dr
Newnan, GA 30263
|
1,317 sq. feet
|
2 baths - beds |
show details | |

|
#36
Dr Elliott Rd
Newnan, GA 30263
|
1,247 sq. feet
|
1 baths - beds |
show details | |

|
#37
Mitchell St
Newnan, GA 30263
|
1,008 sq. feet
|
1 baths - beds |
show details | |

|
#38
Preserve Dr
Newnan, GA 30263
|
1,684 sq. feet
|
2 baths - beds |
show details | |

|
#39
Lakeshore Dr
Newnan, GA 30263
|
3,192 sq. feet
|
2 baths - beds |
show details | |

|
#40
Stony Oak Dr
Newnan, GA 30263
|
2,278 sq. feet
|
2 baths - beds |
show details |
| Photo | Address | Area | Beds / Baths | Price | Details |
|---|---|---|---|---|---|

|
#41
Arnco 6th St
Newnan, GA 30263
|
1,240 sq. feet
|
1 baths - beds |
show details | |

|
#42
Smokey Ridge Dr
Newnan, GA 30263
|
2,541 sq. feet
|
2 baths - beds |
show details | |

|
#43
Westport Pl
Newnan, GA 30265
|
1,473 sq. feet
|
2 baths - beds |
show details | |

|
#44
Elm Cir
Newnan, GA 30263
|
1,476 sq. feet
|
2 baths - beds |
show details | |

|
#45
Ancient Oak Ln
Newnan, GA 30263
|
3,376 sq. feet
|
3 baths - beds |
show details | |

|
#46
Corn Crib Ct
Newnan, GA 30263
|
1,196 sq. feet
|
2 baths - beds |
show details | |

|
#47
Welcome Rd
Newnan, GA 30263
|
1,072 sq. feet
|
1 baths - beds |
show details | |

|
#48
Lynn Cir
Newnan, GA 30263
|
1,824 sq. feet
|
2 baths - beds |
show details | |

|
#49
Park Forest Curv
Newnan, GA 30265
|
1,860 sq. feet
|
2 baths - beds |
show details | |

|
Check over 1 million property listings on Foreclosure.com!
|
browse all offers | |||

Latest news about housing in Newnan, GA collected exclusively by city-data.com from local newspapers, TV, and radio stations


Median year apartment built: 1997
Household type by relationship:
Households: 44,261- Male householders: 7,180 (1,987 living alone), Female householders: 9,809 (3,169 living alone)
7,725 spouses (7,647 opposite-sex spouses), 1,007 unmarried partners, (942 opposite-sex unmarried partners), 13,923 children (13,285 natural, 285 adopted, 353 stepchildren), 2,098 grandchildren, 355 brothers or sisters, 616 parents, 0 foster children, 613 other relatives, 438 non-relatives
- In group quarters: 491
Size of family households: 4,793 2-persons, 2,705 3-persons, 2,280 4-persons, 808 5-persons, 196 6-persons, 317 7-or-more-persons.
Size of nonfamily households: 4,693 1-person, 1,234 2-persons, 86 3-persons.
5,839 married couples with children.
3,276 single-parent households (163 men, 3,113 women).
87.9% of residents of Newnan speak English at home.
7.1% of residents speak Spanish at home (77% speak English very well, 9% speak English well, 11% speak English not well, 2% don't speak English at all).
2.2% of residents speak other Indo-European language at home (64% speak English very well, 15% speak English well, 21% speak English not well).
2.1% of residents speak Asian or Pacific Island language at home (33% speak English very well, 25% speak English well, 41% speak English not well).
0.5% of residents speak other language at home (57% speak English very well, 29% speak English well, 14% speak English not well).
Foreign born population: 3,399 (7.7%)
(44.7% of them are naturalized citizens)
| Here: | 6.9 |
| State: | 6.8 |
| Here: | 3.9 |
| State: | 4.6 |

- Bedrooms in owner-occupied houses and condos in Newnan, Georgia
- 0no bedroom
- 591 bedroom
- 9442 bedrooms
- 3,9443 bedrooms
- 3,1934 bedrooms
- 1,4915+ bedrooms

- Bedrooms in renter-occupied apartments in Newnan, Georgia
- 690no bedroom
- 1,6171 bedroom
- 2,8282 bedrooms
- 1,8053 bedrooms
- 3064 bedrooms
- 1825+ bedrooms

- Cars and other vehicles available in Newnan in owner-occupied houses/condos
- 220no vehicle
- 2,8541 vehicle
- 4,4482 vehicles
- 1,4223 vehicles
- 4704 vehicles
- 2195+ vehicles

- Cars and other vehicles available in Newnan in renter-occupied apartments
- 862no vehicle
- 3,8481 vehicle
- 2,0942 vehicles
- 5223 vehicles
- 154 vehicles
- 895+ vehicles

- Rooms in owner-occupied houses in Newnan, Georgia
- 01 room
- 02 rooms
- 833 rooms
- 4894 rooms
- 1,2605 rooms
- 1,8596 rooms
- 2,0787 rooms
- 1,4678 rooms
- 2,3969+ rooms

- Rooms in renter-occupied apartments in Newnan, Georgia
- 6711 room
- 4052 rooms
- 1,4093 rooms
- 1,6154 rooms
- 1,3185 rooms
- 1,0076 rooms
- 5837 rooms
- 2728 rooms
- 1509+ rooms


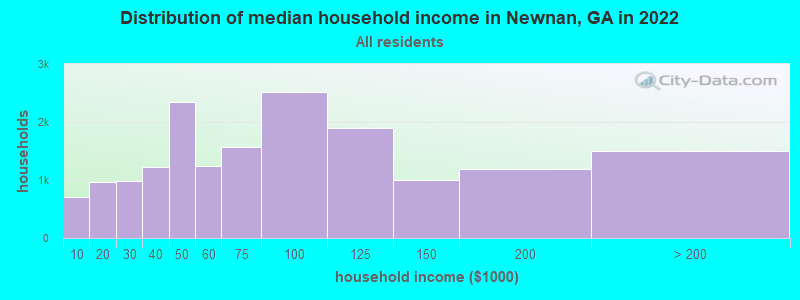
Newnan, GA household income distribution

- 710Less than $10,000
- 971$10,000 to $19,999
- 978$20,000 to $29,999
- 1,217$30,000 to $39,999
- 2,341$40,000 to $49,999
- 1,233$50,000 to $59,999
- 1,568$60,000 to $74,999
- 2,514$75,000 to $99,999
- 1,905$100,000 to $124,999
- 994$125,000 to $149,999
- 1,196$150,000 to $199,999
- 1,498$200,000 or more
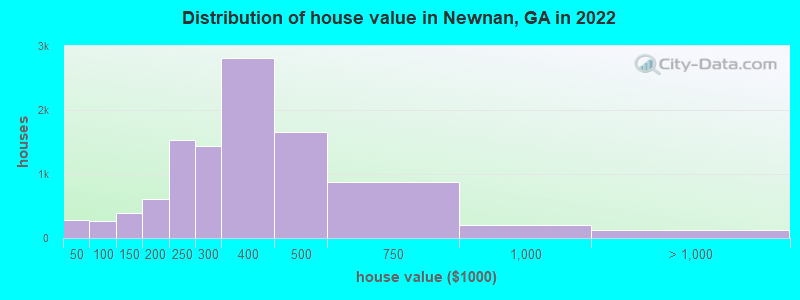
Home value of owner - occupied houses in 2022 in Newnan, GA
-
- 131Less than $10,000
- 31$15,000 to $19,999
- 36$20,000 to $24,999
- 27$25,000 to $29,999
- 22$30,000 to $34,999
- 32$40,000 to $49,999
- 19$50,000 to $59,999
- 73$60,000 to $69,999
- 23$70,000 to $79,999
- 60$80,000 to $89,999
- 52$90,000 to $99,999
- 185$100,000 to $124,999
- 197$125,000 to $149,999
- 378$150,000 to $174,999
- 231$175,000 to $199,999
- 1,534$200,000 to $249,999
- 1,441$250,000 to $299,999
- 2,805$300,000 to $399,999
- 1,652$400,000 to $499,999
- 876$500,000 to $749,999
- 199$750,000 to $999,999
- 86$1,000,000 to $1,499,999
- 33$1,500,000 to $1,999,999
Rent paid by renters in 2022 in Newnan, GA
-
- 236Less than $100
- 65$100 to $149
- 166$150 to $199
- 75$200 to $249
- 34$250 to $299
- 153$300 to $349
- 451$400 to $449
- 106$450 to $499
- 12$500 to $549
- 78$550 to $599
- 162$600 to $649
- 220$650 to $699
- 148$700 to $749
- 117$750 to $799
- 232$800 to $899
- 529$900 to $999
- 1,279$1,000 to $1,249
- 1,283$1,250 to $1,499
- 1,410$1,500 to $1,999
- 401$2,000 to $2,499
- 55$2,500 to $2,999
- 9No cash rent


Percentage of workers working in this county: 61.8%
Number of people working at home: 2,500 (11.5% of all workers)
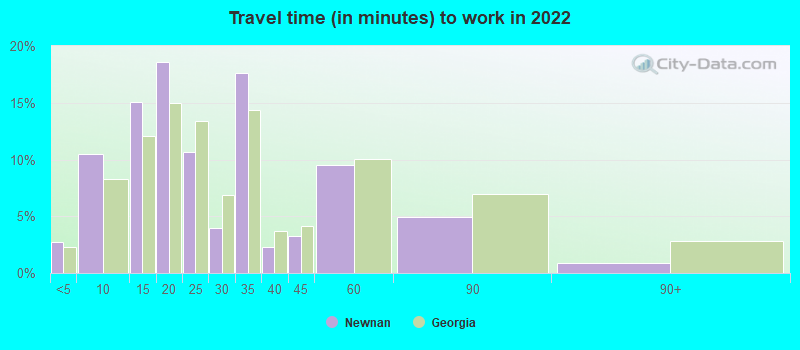
Travel time to work (commute)
- Less than 5 minutes: 644
- 5 to 9 minutes: 2,421
- 10 to 14 minutes: 2,650
- 15 to 19 minutes: 3,530
- 20 to 24 minutes: 1,462
- 25 to 29 minutes: 427
- 30 to 34 minutes: 2,391
- 35 to 39 minutes: 949
- 40 to 44 minutes: 1,016
- 45 to 59 minutes: 1,788
- 60 to 89 minutes: 1,707
- 90 or more minutes: 270
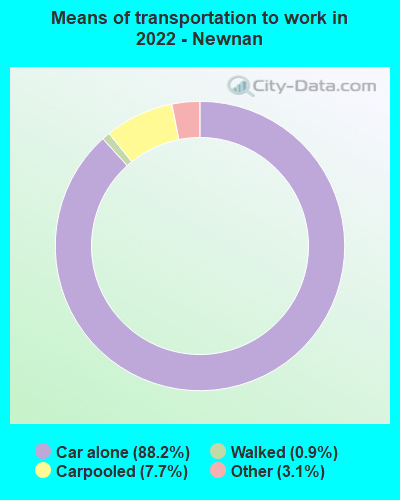
Means of transportation to work:
- Drove a car alone: 16,746 (76.7%)
- Carpooled: 1,519 (7.0%)
- Bus: 5 (0.0%)
- Ferryboat: 7 (0.0%)
- Taxi: 629 (2.9%)
- Walked: 181 (0.8%)
- Worked at home: 2,500 (11.5%)

- Unemployment by race in 2022
- Unemployment rate for White non-Hispanic residents
- 1.0%Males
- 1.6%Females
- Unemployment rate for Black residents
- 1.1%Males
- 5.2%Females
- Unemployment rate for Asian residents
- 1.8%Females
- Unemployment rate for other race residents
- 10.9%Females
- Unemployment rate for two or more race residents
- 14.9%Females
- Unemployment rate for Hispanic or Latino residents
- 11.8%Females

- Year of entry for the foreign-born population in Newnan, Georgia
- 1,8202010 or later
- 1,1452000 to 2009
- 6231990 to 1999
- 1791980 to 1989
- 431970 to 1979
- 27Before 1970
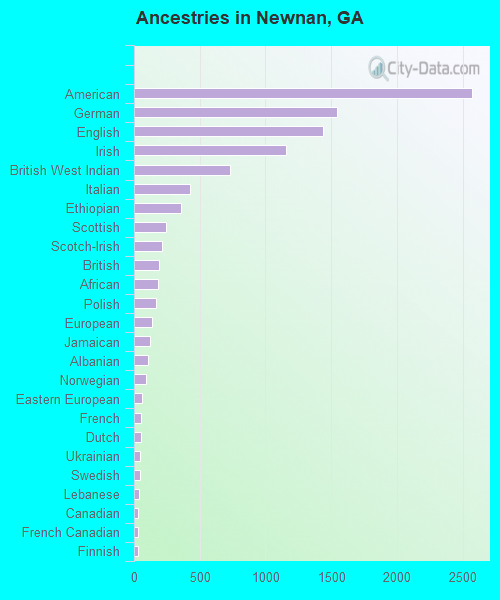
First ancestries reported:
- American: 2,573 (11.1%)
- German: 1,546 (6.7%)
- English: 1,439 (6.2%)
- Irish: 1,154 (5.0%)
- British West Indian: 731 (3.2%)
- Italian: 423 (1.8%)
- Ethiopian: 354 (1.5%)
- Scottish: 243 (1.0%)
- Scotch-Irish: 215 (0.9%)
- British: 194 (0.8%)
- African: 184 (0.8%)
- Polish: 168 (0.7%)
- European: 136 (0.6%)
- Jamaican: 124 (0.5%)
- Albanian: 110 (0.5%)
- Norwegian: 88 (0.4%)
- Eastern European: 60 (0.3%)
- French: 56 (0.2%)
- Dutch: 52 (0.2%)
- Ukrainian: 49 (0.2%)
- Swedish: 42 (0.2%)
- Lebanese: 37 (0.2%)
- Canadian: 29 (0.1%)
- French Canadian: 28 (0.1%)
- Finnish: 27 (0.1%)
- Turkish: 23 (0.10%)
- Greek: 22 (0.09%)
- Hungarian: 17 (0.07%)
- Pennsylvania German: 16 (0.07%)
- Haitian: 15 (0.06%)
- Welsh: 13 (0.06%)
- Austrian: 12 (0.05%)
- Portuguese: 12 (0.05%)
- Swiss: 6 (0.03%)
- Bahamian: 3 (0.01%)
- Northern European: 3 (0.01%)
Most common places of birth for foreign-born residents (%):
| Newnan: | 17.4% (696) |
| Georgia: | 0.4% (4,066) |
| Newnan: | 9.6% (384) |
| Georgia: | 20.0% (223,400) |
| Newnan: | 9.5% (382) |
| Georgia: | 3.9% (43,756) |
| Newnan: | 7.6% (306) |
| Georgia: | 3.6% (39,974) |
| Newnan: | 7.1% (286) |
| Georgia: | 9.2% (103,325) |
| Newnan: | 5.7% (230) |
| Georgia: | 0.2% (2,022) |
| Newnan: | 4.8% (192) |
| Georgia: | 3.5% (39,227) |
| Newnan: | 3.5% (142) |
| Georgia: | 1.8% (20,700) |
| Newnan: | 2.7% (108) |
| Georgia: | 1.6% (17,851) |
| Newnan: | 2.7% (108) |
| Georgia: | 1.6% (17,476) |
| Newnan: | 2.4% (96) |
| Georgia: | 2.1% (23,813) |
| Newnan: | 1.8% (74) |
| Georgia: | 0.3% (3,088) |
| Newnan: | 1.8% (72) |
| Georgia: | 4.6% (51,270) |
| Newnan: | 1.6% (64) |
| Georgia: | 2.5% (27,794) |
Place of birth for U.S.-born residents:
- This state: 21,624
- Other state: 18,218
- Northeast: 3,594
- Midwest: 2,894
- South: 9,773
- West: 2,004
86.5% of Newnan residents lived in the same house 1 years ago.
Out of people who lived in different houses, 33.1% lived in this county.
Out of people who lived in different counties, 53.3% lived in Georgia.
| Newnan: | 86.5% |
| State average: | 86.6% |
Education attainment for males 25 years and older:
- No schooling: 7
- Nursery to 4th grade: 4
- 5th and 6th grade: 214
- 7th and 8th grade: 40
- 9th grade: 87
- 10th grade: 114
- 11th grade: 445
- 12th grade, no diploma: 357
- High school graduate (or equivalency): 2,815
- Less than 1 year of college: 801
- Some college more than 1 year, no degree: 1,676
- Associate degree: 1,371
- Bachelor's degree: 3,412
- Master's degree: 1,421
- Professional school degree: 334
- Doctorate degree: 288

Education attainment for females 25 years and older:
- No schooling: 118
- Nursery to 4th grade: 10
- 5th and 6th grade: 69
- 7th and 8th grade: 387
- 9th grade: 97
- 10th grade: 73
- 11th grade: 211
- 12th grade, no diploma: 567
- High school graduate (or equivalency): 3,234
- Less than 1 year of college: 1,477
- Some college more than 1 year, no degree: 2,199
- Associate degree: 1,633
- Bachelor's degree: 3,669
- Master's degree: 1,696
- Professional school degree: 598
- Doctorate degree: 366


Housing units in structures:
- One, detached: 10,890
- One, attached: 1,148
- Two: 612
- 3 or 4: 793
- 5 to 9: 802
- 10 to 19: 2,190
- 20 to 49: 631
- 50 or more: 755
Housing units lacking complete kitchen facilities in 2022: 1.3%
House/condo owner moved in on average 7 years ago
Renter moved in on average 2 years ago

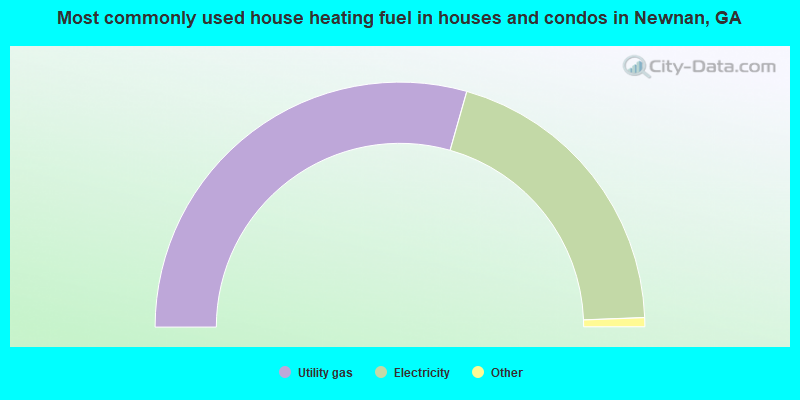
- 58.8%Utility gas
- 40.0%Electricity
- 0.9%Bottled, tank, or LP gas
- 0.3%Wood
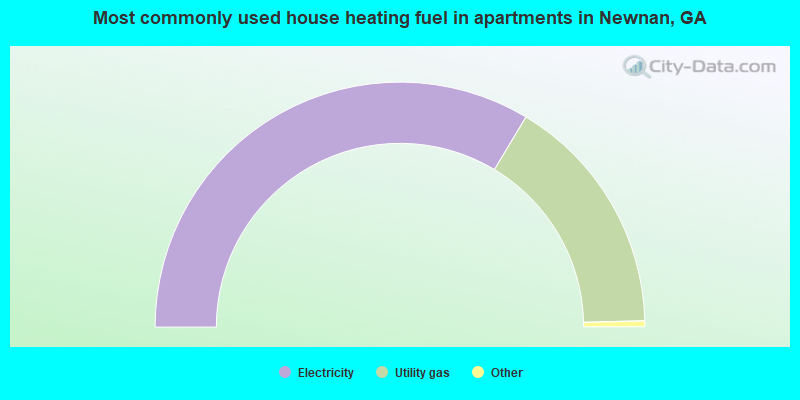
- 67.2%Electricity
- 32.0%Utility gas
- 0.4%Bottled, tank, or LP gas
- 0.4%No fuel used
Private vs. public school enrollment:
| Here: | 12.4% |
| Georgia: | 12.1% |
| Here: | 13.7% |
| Georgia: | 10.8% |
| Here: | 8.5% |
| Georgia: | 17.1% |


