Newark, NJ (New Jersey) Houses and Residents
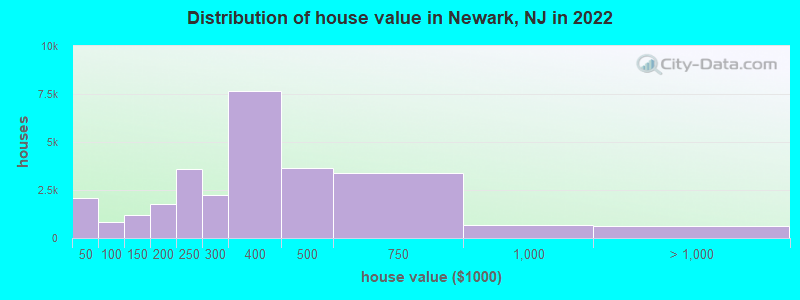
Estimated median house or condo value in 2022: $344,800 (it was $132,800 in 2000 )
Newark:
$344,800New Jersey:
$428,900
Lower value quartile - upper value quartile: $233,200 - $469,300Mean price in 2022: Detached houses: $412,982 Here:
$412,982State:
$537,591
Townhouses or other attached units: $338,798 Here:
$338,798State:
$381,113
In 2-unit structures: $320,136 Here:
$320,136State:
$444,476
In 3-to-4-unit structures: $385,287 Here:
$385,287State:
$457,463
In 5-or-more-unit structures: $410,665 Here:
$410,665State:
$368,745
Total population: 280,579 (Urban population: 273,546, Rural population: 0)
Houses: 118,265 (112,713 occupied: 33,374 owner occupied, 79,339 renter occupied )
% of renters here:
70%State:
35%
Housing density: 4,970 houses/condos per square mile
Median price asked for vacant for-sale houses and condos in 2022: $217,683.
Median contract rent in 2022: $1,126 (lower quartile is $782, upper quartile is $1,511)
Median rent asked for vacant for-rent units in 2022: $985
Median gross rent in Newark, NJ in 2022: $1,293
Housing units in Newark with a mortgage: 21,839 (735 second mortgage, 0 home equity loan, 486 both second mortgage and home equity loan )Houses without a mortgage: 436
Median household income for houses/condos with a mortgage: $88,554
Median household income for apartments without a mortgage: $53,963
Median monthly housing costs: $1,378
Data:
Median house or condo value ($)
Median house or condo value ($ change since 2000)
Median house or condo value ($) - White
Median house or condo value ($) - Black or African American
Median house or condo value ($) - Asian
Median house or condo value ($) - Hispanic or Latino
Median house or condo value ($) - American Indian and Alaska Native
Median house or condo value ($) - Multirace
Median house or condo value ($) - Other Race
Median price asked for mobile homes ($)
Household density (households per square mile)
Mean house or condo value by units in structure - 1, detached ($)
Mean house or condo value by units in structure - 1, attached ($)
Mean house or condo value by units in structure - 2 ($)
Mean house or condo value by units in structure by units in structure - 3 or 4 ($)
Mean house or condo value by units in structure - 5 or more ($)
Mean house or condo value by units in structure - Boat, RV, van, etc. ($)
Mean house or condo value by units in structure - Mobile home ($)
Median contract rent ($)
Median contract rent - Lower quartile ($)
Median contract rent - Upper quartile ($)
Median gross rent ($)
Urban houses (%)
Rural houses (%)
Houses occupied (%)
Houses occupied (% change since 2000)
Houses owner occupied (%)
Houses owner occupied (% change since 2000)
Houses renter occupied (%)
Houses renter occupied (% change since 2000)
Vacant housing units - For rent (%)
Vacant housing units - For rent (% change since 2000)
Vacant housing units - For sale only (%)
Vacant housing units - For sale only (% change since 2000)
Vacant housing units - Rented or sold, not occupied (%)
Vacant housing units - Rented or sold, not occupied (% change since 2000)
Vacant housing units - For seasonal, recreational, or occasional use (%)
Vacant housing units - For seasonal, recreational, or occasional use (% change since 2000)
Vacant housing units - For migrant workers (%)
Vacant housing units - For migrant workers (% change since 2000)
Vacant housing units - Other vacant (%)
Vacant housing units - Other vacant (% change since 2000)
Median monthly housing costs ($)
Median household income for houses/condos with a mortgage ($)
Median household income for houses/condos without a mortgage ($)
Median household income ($)
Median household income ($) - White
Median household income ($) - Black or African American
Median household income ($) - Asian
Median household income ($) - Hispanic or Latino
Median household income ($) - American Indian and Alaska Native
Median household income ($) - Multirace
Median household income ($) - Other Race
Mortgage status - with mortgage (%)
Mortgage status - with second mortgage (%)
Mortgage status - with home equity loan (%)
Mortgage status - with both second mortgage and home equity loan (%)
Mortgage status - without a mortgage (%)
Median year house/condo built
Median year apartment built
Household type by relationship - Male householder living alone (%)
Household type by relationship - Male householder not living alone (%)
Household type by relationship - Female householder living alone (%)
Household type by relationship - Female householder not living alone (%)
Household type by relationship - Opposite-Sex spouse (%)
Household type by relationship - Same-Sex spouse (%)
Household type by relationship - Opposite-Sex unmarried partner (%)
Household type by relationship - Same-Sex unmarried partner (%)
Household type by relationship - In group quarters (%)
Size of family households - 2-person household (%)
Size of family households - 3-person household (%)
Size of family households - 4-person household (%)
Size of family households - 5-person household (%)
Size of family households - 6-person household (%)
Size of family households - 7-or-more-person household (%)
Size of nonfamily households - 1-person household (%)
Size of nonfamily households - 2-person household (%)
Size of nonfamily households - 3-person household (%)
Size of nonfamily households - 4-person household (%)
Size of nonfamily households - 5-person household (%)
Size of nonfamily households - 6-person household (%)
Size of nonfamily households - 7-or-moreperson household (%)
Year house built - Built 2010 or later (%)
Year house built - Built 2000 to 2009 (%)
Year house built - Built 1990 to 1999 (%)
Year house built - Built 1980 to 1989 (%)
Year house built - Built 1970 to 1979 (%)
Year house built - Built 1960 to 1969 (%)
Year house built - Built 1950 to 1959 (%)
Year house built - Built 1940 to 1949 (%)
Year house built - Built 1939 or earlier (%)
Median number of rooms in houses and condos
Median number of rooms in apartments
Median number of bedrooms in owner occupied houses
Mean number of bedrooms in owner occupied houses
Median number of bedrooms in renter occupied houses
Mean number of bedrooms in renter occupied houses
Median number of vehichles in owner occupied houses
Mean number of vehichles in owner occupied houses
Median number of vehichles in renter occupied houses
Mean number of vehichles in renter occupied houses
Rooms in owner-occupied houses - 1 room (%)
Rooms in owner-occupied houses - 2 rooms (%)
Rooms in owner-occupied houses - 3 rooms (%)
Rooms in owner-occupied houses - 4 rooms (%)
Rooms in owner-occupied houses - 5 rooms (%)
Rooms in owner-occupied houses - 6 rooms (%)
Rooms in owner-occupied houses - 7 rooms (%)
Rooms in owner-occupied houses - 8 rooms (%)
Rooms in owner-occupied houses - 9+ rooms (%)
Rooms in renter-occupied houses - 1 room (%)
Rooms in renter-occupied houses - 2 rooms (%)
Rooms in renter-occupied houses - 3 rooms (%)
Rooms in renter-occupied houses - 4 rooms (%)
Rooms in renter-occupied houses - 5 rooms (%)
Rooms in renter-occupied houses - 6 rooms (%)
Rooms in renter-occupied houses - 7 rooms (%)
Rooms in renter-occupied houses - 8 rooms (%)
Rooms in renter-occupied houses - 9+ rooms (%)
Bedrooms in owner-occupied houses - no bedrooms (%)
Bedrooms in owner-occupied houses - 1 bedroom (%)
Bedrooms in owner-occupied houses - 2 bedrooms (%)
Bedrooms in owner-occupied houses - 3 bedrooms (%)
Bedrooms in owner-occupied houses - 4 bedrooms (%)
Bedrooms in owner-occupied houses - 5+ bedrooms (%)
Bedrooms in renter-occupied houses - no bedrooms (%)
Bedrooms in renter-occupied houses - 1 bedroom (%)
Bedrooms in renter-occupied houses - 2 bedrooms (%)
Bedrooms in renter-occupied houses - 3 bedrooms (%)
Bedrooms in renter-occupied houses - 4 bedrooms (%)
Bedrooms in renter-occupied houses - 5+ bedrooms (%)
Vehicles available in owner-occupied houses - no vehicle available (%)
Vehicles available in owner-occupied houses - 1 vehicle available(%)
Vehicles available in owner-occupied houses - 2 Vehicles available (%)
Vehicles available in owner-occupied houses - 3 Vehicles available (%)
Vehicles available in owner-occupied houses - 4 Vehicles available (%)
Vehicles available in owner-occupied houses - 5+ Vehicles available (%)
Vehicles available in renter-occupied houses - no vehicle available (%)
Vehicles available in renter-occupied houses - 1 vehicle available (%)
Vehicles available in renter-occupied houses - 2 Vehicles available (%)
Vehicles available in renter-occupied houses - 3 Vehicles available (%)
Vehicles available in renter-occupied houses - 4 Vehicles available (%)
Vehicles available in renter-occupied houses - 5+ Vehicles available (%)
Housing units in structures - 1, detached (%)
Housing units in structures - 1, attached (%)
Housing units in structures - 2 (%)
Housing units in structures - 3 or 4 (%)
Housing units in structures - 5 to 9 (%)
Housing units in structures - 10 to 19 (%)
Housing units in structures - 20 to 49 (%)
Housing units in structures - 50 or more (%)
Housing units in structures - Mobile home (%)
Housing units in structures - Boat, RV, van, etc. (%)
Housing units in structures - Owners - 1, detached (%)
Housing units in structures - Owners - 1, attached (%)
Housing units in structures - Owners - 2 (%)
Housing units in structures - Owners - 3 or 4 (%)
Housing units in structures - Owners - 5 to 9 (%)
Housing units in structures - Owners - 10 to 19 (%)
Housing units in structures - Owners - 20 to 49 (%)
Housing units in structures - Owners - 50 or more (%)
Housing units in structures - Owners - Mobile home (%)
Housing units in structures - Owners - Boat, RV, van, etc. (%)
Housing units in structures - Renters - 1, detached (%)
Housing units in structures - Renters - 1, attached (%)
Housing units in structures - Renters - 2 (%)
Housing units in structures - Renters - 3 or 4 (%)
Housing units in structures - Renters - 5 to 9 (%)
Housing units in structures - Renters - 10 to 19 (%)
Housing units in structures - Renters - 20 to 49 (%)
Housing units in structures - Renters - 50 or more (%)
Housing units in structures - Renters - Mobile home (%)
Housing units in structures - Renters - Boat, RV, van, etc. (%)
House/condo owner moved in on average (years ago)
Renter moved in on average (years ago)
Year householder moved into unit - Moved in 1999 to March 2000 (%)
Year householder moved into unit - Moved in 1999 to March 2000 (%) - White
Year householder moved into unit - Moved in 1999 to March 2000 (%) - Black or African American
Year householder moved into unit - Moved in 1999 to March 2000 (%) - Asian
Year householder moved into unit - Moved in 1999 to March 2000 (%) - Hispanic or Latino
Year householder moved into unit - Moved in 1999 to March 2000 (%) - American Indian and Alaska Native
Year householder moved into unit - Moved in 1999 to March 2000 (%) - Multirace
Year householder moved into unit - Moved in 1999 to March 2000 (%) - Other Race
Year householder moved into unit - Moved in 1995 to 1998 (%)
Year householder moved into unit - Moved in 1995 to 1998 (%) - White
Year householder moved into unit - Moved in 1995 to 1998 (%) - Black or African American
Year householder moved into unit - Moved in 1995 to 1998 (%) - Asian
Year householder moved into unit - Moved in 1995 to 1998 (%) - Hispanic or Latino
Year householder moved into unit - Moved in 1995 to 1998 (%) - American Indian and Alaska Native
Year householder moved into unit - Moved in 1995 to 1998 (%) - Multirace
Year householder moved into unit - Moved in 1995 to 1998 (%) - Other Race
Year householder moved into unit - Moved in 1990 to 1994 (%)
Year householder moved into unit - Moved in 1990 to 1994 (%) - White
Year householder moved into unit - Moved in 1990 to 1994 (%) - Black or African American
Year householder moved into unit - Moved in 1990 to 1994 (%) - Asian
Year householder moved into unit - Moved in 1990 to 1994 (%) - Hispanic or Latino
Year householder moved into unit - Moved in 1990 to 1994 (%) - American Indian and Alaska Native
Year householder moved into unit - Moved in 1990 to 1994 (%) - Multirace
Year householder moved into unit - Moved in 1990 to 1994 (%) - Other Race
Year householder moved into unit - Moved in 1980 to 1989 (%)
Year householder moved into unit - Moved in 1980 to 1989 (%) - White
Year householder moved into unit - Moved in 1980 to 1989 (%) - Black or African American
Year householder moved into unit - Moved in 1980 to 1989 (%) - Asian
Year householder moved into unit - Moved in 1980 to 1989 (%) - Hispanic or Latino
Year householder moved into unit - Moved in 1980 to 1989 (%) - American Indian and Alaska Native
Year householder moved into unit - Moved in 1980 to 1989 (%) - Multirace
Year householder moved into unit - Moved in 1980 to 1989 (%) - Other Race
Year householder moved into unit - Moved in 1970 to 1979 (%)
Year householder moved into unit - Moved in 1970 to 1979 (%) - White
Year householder moved into unit - Moved in 1970 to 1979 (%) - Black or African American
Year householder moved into unit - Moved in 1970 to 1979 (%) - Asian
Year householder moved into unit - Moved in 1970 to 1979 (%) - Hispanic or Latino
Year householder moved into unit - Moved in 1970 to 1979 (%) - American Indian and Alaska Native
Year householder moved into unit - Moved in 1970 to 1979 (%) - Multirace
Year householder moved into unit - Moved in 1970 to 1979 (%) - Other Race
Year householder moved into unit - Moved in 1969 or earlier (%)
Year householder moved into unit - Moved in 1969 or earlier (%) - White
Year householder moved into unit - Moved in 1969 or earlier (%) - Black or African American
Year householder moved into unit - Moved in 1969 or earlier (%) - Asian
Year householder moved into unit - Moved in 1969 or earlier (%) - Hispanic or Latino
Year householder moved into unit - Moved in 1969 or earlier (%) - American Indian and Alaska Native
Year householder moved into unit - Moved in 1969 or earlier (%) - Multirace
Year householder moved into unit - Moved in 1969 or earlier (%) - Other Race
Housing units lacking complete plumbing facilities (%)
Housing units lacking complete kitchen facilities (%)
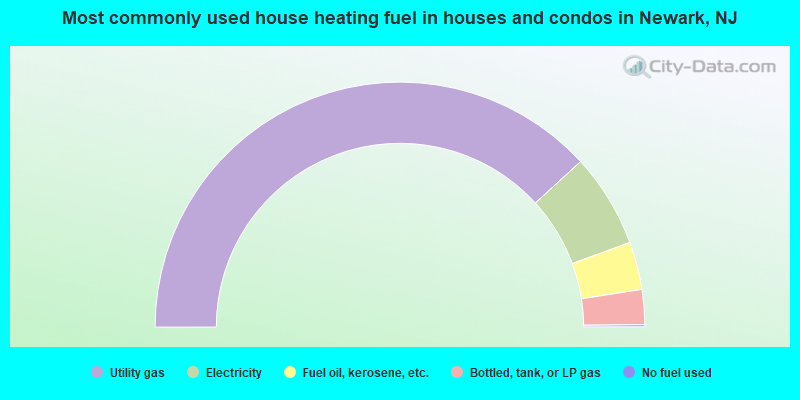
House heating fuel used in houses and condos - Utility gas (%)
House heating fuel used in houses and condos - Bottled, tank, or LP gas (%)
House heating fuel used in houses and condos - Electricity (%)
House heating fuel used in houses and condos - Fuel oil, kerosene, etc. (%)
House heating fuel used in houses and condos - Coal or coke (%)
House heating fuel used in houses and condos - Wood (%)
House heating fuel used in houses and condos - Solar energy (%)
House heating fuel used in houses and condos - Other fuel (%)
House heating fuel used in houses and condos - No fuel used (%)
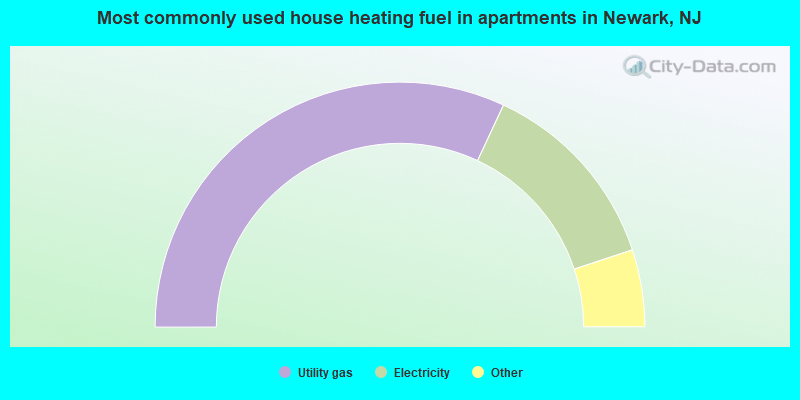
House heating fuel used in apartments - Utility gas (%)
House heating fuel used in apartments - Bottled, tank, or LP gas (%)
House heating fuel used in apartments - Electricity (%)
House heating fuel used in apartments - Fuel oil, kerosene, etc. (%)
House heating fuel used in apartments - Coal or coke (%)
House heating fuel used in apartments - Wood (%)
House heating fuel used in apartments - Solar energy (%)
House heating fuel used in apartments - Other fuel (%)
House heating fuel used in apartments - No fuel used (%)
Latest news about housing in Newark, NJ collected exclusively by city-data.com from local newspapers, TV, and radio stations
Median year house/condo built: 1955Median year apartment built: 1967Household type by relationship:
Households: 305,339
Male householders: 50,047 (16,837 living alone ), Female householders: 62,666 (20,122 living alone )34,076 spouses (33,767 opposite-sex spouses ), 8,538 unmarried partners , (8,426 opposite-sex unmarried partners ), 99,611 children (97,097 natural , 1,030 adopted , 1,484 stepchildren ), 8,586 grandchildren , 5,672 brothers or sisters , 4,486 parents , 0 foster children , 10,735 other relatives , 9,488 non-relatives In group quarters: 11,434
Size of family households: 21,132 2-persons , 19,152 3-persons , 15,608 4-persons , 8,148 5-persons , 2,913 6-persons , 2,231 7-or-more-persons .
Size of nonfamily households: 36,959 1-person , 5,785 2-persons , 244 3-persons , 541 4-persons .
31,576 married couples with children. single-parent households (6,783 men , 25,797 women ).
52.6% of residents of Newark speak English at home. of residents speak Spanish at home (47% speak English very well , 18% speak English well , 25% speak English not well , 10% don't speak English at all ).of residents speak other Indo-European language at home (49% speak English very well , 16% speak English well , 25% speak English not well , 10% don't speak English at all ).of residents speak Asian or Pacific Island language at home (41% speak English very well , 30% speak English well , 24% speak English not well , 5% don't speak English at all ).of residents speak other language at home (88% speak English very well , 10% speak English well , 2% speak English not well ).
Foreign born population: 106,540 (34.9%)of them are naturalized citizens )
Median number of rooms in houses and condos:
Median number of rooms in apartments
Owner-occupied Renter-occupied
Bedrooms in owner-occupied houses and condos in Newark, New Jersey
631 no bedroom 2,511 1 bedroom 10,896 2 bedrooms 12,310 3 bedrooms 4,587 4 bedrooms 2,439 5+ bedrooms
Bedrooms in renter-occupied apartments in Newark, New Jersey
6,557 no bedroom 19,513 1 bedroom 26,360 2 bedrooms 23,951 3 bedrooms 2,669 4 bedrooms 289 5+ bedrooms
Owner-occupied Renter-occupied
Rooms in owner-occupied houses in Newark, New Jersey
631 1 room 485 2 rooms 836 3 rooms 6,612 4 rooms 7,554 5 rooms 6,647 6 rooms 3,502 7 rooms 1,893 8 rooms 5,214 9+ rooms
Rooms in renter-occupied apartments in Newark, New Jersey
4,930 1 room 3,928 2 rooms 15,503 3 rooms 20,934 4 rooms 18,887 5 rooms 5,695 6 rooms 7,818 7 rooms 955 8 rooms 689 9+ rooms
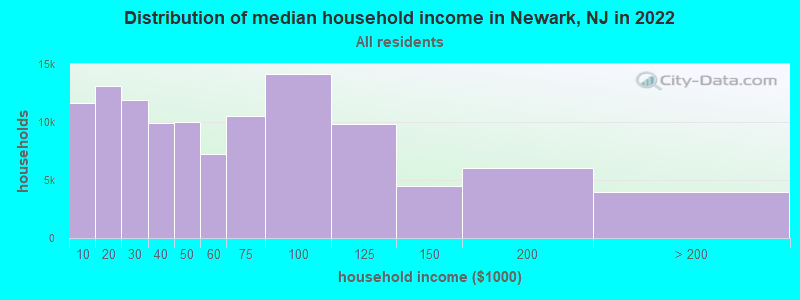
Newark, NJ household income distribution 11,675 Less than $10,00013,120 $10,000 to $19,99911,868 $20,000 to $29,9999,918 $30,000 to $39,9999,982 $40,000 to $49,9997,201 $50,000 to $59,99910,495 $60,000 to $74,99914,155 $75,000 to $99,9999,835 $100,000 to $124,9994,458 $125,000 to $149,9996,062 $150,000 to $199,9993,944 $200,000 or more
Home value of owner - occupied houses in 2022 in Newark, NJ 1,613 Less than $10,00040 $10,000 to $14,99933 $15,000 to $19,99959 $20,000 to $24,99958 $25,000 to $29,99922 $30,000 to $34,99984 $35,000 to $39,999194 $40,000 to $49,999267 $50,000 to $59,99962 $60,000 to $69,999122 $70,000 to $79,999133 $80,000 to $89,99976 $90,000 to $99,999801 $100,000 to $124,999373 $125,000 to $149,999726 $150,000 to $174,9991,061 $175,000 to $199,9993,572 $200,000 to $249,9992,258 $250,000 to $299,9997,661 $300,000 to $399,9993,621 $400,000 to $499,9993,411 $500,000 to $749,999675 $750,000 to $999,999398 $1,000,000 to $1,499,99914 $1,500,000 to $1,999,999231 $2,000,000 or moreRent paid by renters in 2022 in Newark, NJ 1,607 Less than $100343 $100 to $1491,059 $150 to $1992,877 $200 to $2491,692 $250 to $2991,509 $300 to $349910 $350 to $3991,234 $400 to $449649 $450 to $4991,686 $500 to $549671 $550 to $5991,134 $600 to $649589 $650 to $6991,419 $700 to $7493,109 $750 to $7994,695 $800 to $8995,509 $900 to $99916,119 $1,000 to $1,24911,159 $1,250 to $1,49913,892 $1,500 to $1,9994,082 $2,000 to $2,4991,501 $2,500 to $2,999135 $3,000 to $3,499114 $3,500 or more1,645 No cash rent
Percentage of workers working in this county: 62.2%Number of people working at home: 8,409 (6.5% of all workers )
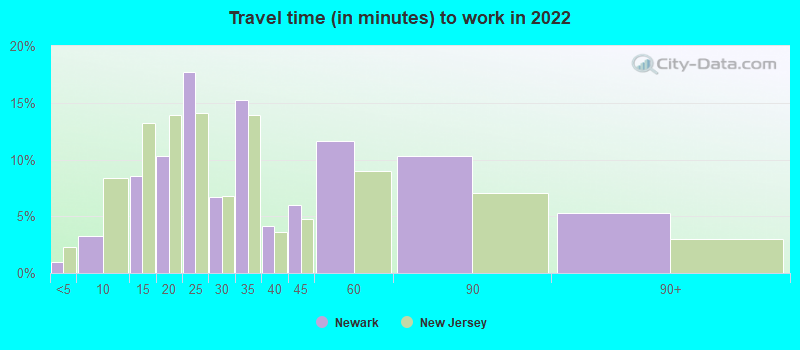
Travel time to work (commute)
Less than 5 minutes: 1,8015 to 9 minutes: 5,66910 to 14 minutes: 11,80815 to 19 minutes: 11,93720 to 24 minutes: 29,37625 to 29 minutes: 4,74530 to 34 minutes: 17,72035 to 39 minutes: 2,82440 to 44 minutes: 6,95245 to 59 minutes: 11,65360 to 89 minutes: 11,52590 or more minutes: 5,590
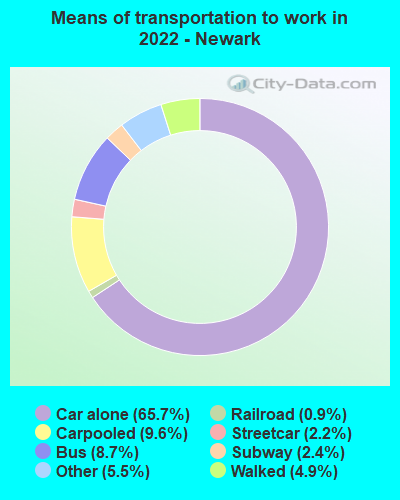
Means of transportation to work:
Drove a car alone: 105,875 (62.5%)Carpooled: 15,424 (9.1%)Bus : 13,948 (8.2%)Subway or elevated rail : 3,566 (2.1%)Long-distance train or commuter rail : 3,904 (2.3%)Light rail, streetcar or trolley : 1,511 (0.9%)Ferryboat: 155 (0.1%)Taxi: 8,789 (5.2%)Walked: 7,908 (4.7%)Worked at home: 8,409 (5.0%)
Unemployment by race in 2022
Unemployment rate for White non-Hispanic residents 9.9% Males10.6% FemalesUnemployment rate for Black residents 12.8% Males12.4% FemalesUnemployment rate for American Indian and Alaska Native residents 5.5% Males8.7% FemalesUnemployment rate for Asian residents 9.3% Males8.6% FemalesUnemployment rate for other race residents 2.3% Males10.4% FemalesUnemployment rate for two or more race residents 4.1% Males4.0% FemalesUnemployment rate for Hispanic or Latino residents 2.9% Males6.9% Females
Year of entry for the foreign-born population in Newark, New Jersey
42,190 2010 or later 28,883 2000 to 2009 16,420 1990 to 1999 18,943 1980 to 1989 8,192 1970 to 1979 5,242 Before 1970
First ancestries reported:
Brazilian: 14,190 (6.3%)
Portuguese: 7,163 (3.2%)
Nigerian: 5,914 (2.6%)
American: 4,287 (1.9%)
African: 4,254 (1.9%)
Haitian: 4,212 (1.9%)
Jamaican: 3,556 (1.6%)
Ghanaian: 3,021 (1.3%)
Italian: 2,263 (1.0%)
Guyanese: 2,199 (1.0%)
Trinidadian and Tobagonian: 1,239 (0.6%)
Irish: 582 (0.3%)
Liberian: 514 (0.2%)
West Indian: 439 (0.2%)
British West Indian: 403 (0.2%)
Polish: 370 (0.2%)
Kenyan: 355 (0.2%)
Senegalese: 346 (0.2%)
German: 304 (0.1%)
English: 275 (0.1%)
Barbadian: 258 (0.1%)
Cape Verdean: 248 (0.1%)
European: 241 (0.1%)
Greek: 220 (0.10%)
Egyptian: 193 (0.09%)
Ugandan: 159 (0.07%)
Ukrainian: 154 (0.07%)
Moroccan: 124 (0.06%)
Russian: 94 (0.04%)
Arab: 90 (0.04%)
Iranian: 87 (0.04%)
Palestinian: 83 (0.04%)
Armenian: 83 (0.04%)
Eastern European: 69 (0.03%)
Lebanese: 64 (0.03%)
Turkish: 59 (0.03%)
Latvian: 57 (0.03%)
British: 52 (0.02%)
Iraqi: 51 (0.02%)
French: 50 (0.02%)
Hungarian: 45 (0.02%)
Swedish: 42 (0.02%)
Bahamian: 37 (0.02%)
Scottish: 36 (0.02%)
Ethiopian: 33 (0.01%)
Dutch: 25 (0.01%)
Canadian: 25 (0.01%)
Belizean: 24 (0.01%)
Israeli: 20 (0.01%)
Jordanian: 19 (0.01%)
Sierra Leonean: 19 (0.01%)
New Zealander: 16 (0.01%)
Afghan: 15 (0.01%)
Sudanese: 15 (0.01%)
Dutch West Indian: 14 (0.01%)
Scandinavian: 13 (0.01%)
South African: 13 (0.01%)
Albanian: 12 (0.01%)
Most common places of birth for foreign-born residents (%): Ecuador Newark:
18.9% (20,510)New Jersey:
4.4% (95,275)
Brazil Newark:
13.5% (14,635)New Jersey:
2.1% (46,020)
Dominican Republic Newark:
12.0% (12,970)New Jersey:
9.7% (209,055)
Nigeria Newark:
6.4% (6,920)New Jersey:
1.2% (25,213)
Portugal Newark:
5.8% (6,270)New Jersey:
1.3% (28,871)
Haiti Newark:
4.1% (4,486)New Jersey:
2.3% (49,491)
Ghana Newark:
3.6% (3,912)New Jersey:
0.8% (17,949)
Guatemala Newark:
3.0% (3,261)New Jersey:
2.2% (46,813)
Guyana Newark:
3.0% (3,240)New Jersey:
1.2% (26,173)
Jamaica Newark:
2.9% (3,180)New Jersey:
2.2% (47,365)
Mexico Newark:
2.3% (2,533)New Jersey:
4.8% (102,527)
Peru Newark:
2.3% (2,527)New Jersey:
2.7% (58,563)
El Salvador Newark:
2.2% (2,408)New Jersey:
2.3% (48,885)
Trinidad and Tobago Newark:
1.9% (2,045)New Jersey:
0.7% (15,533)
Spain Newark:
1.5% (1,672)New Jersey:
0.5% (10,246)
Place of birth for U.S.-born residents:
This state: 146,303Other state: 35,706Northeast: 19,585Midwest: 605South: 13,316West: 2,200 90.2% of Newark residents lived in the same house 1 years ago.
Out of people who lived in different houses, 35.0% lived in this county.
Out of people who lived in different counties, 81.5% lived in New Jersey.
Newark:
90.2%State average:
90.4%
Education attainment for males 25 years and older:
No schooling: 4,218Nursery to 4th grade: 1,7285th and 6th grade: 1,1487th and 8th grade: 4,2009th grade: 1,41910th grade: 3,15111th grade: 2,56112th grade, no diploma: 4,635High school graduate (or equivalency): 34,933Less than 1 year of college: 4,391Some college more than 1 year, no degree: 12,875Associate degree: 2,961Bachelor's degree: 11,348Master's degree: 4,668Professional school degree: 996Doctorate degree: 598
Education attainment for females 25 years and older:
No schooling: 4,549Nursery to 4th grade: 1,5905th and 6th grade: 1,6677th and 8th grade: 4,7179th grade: 58710th grade: 2,09811th grade: 2,37512th grade, no diploma: 4,580High school graduate (or equivalency): 34,124Less than 1 year of college: 6,689Some college more than 1 year, no degree: 10,524Associate degree: 6,711Bachelor's degree: 15,393Master's degree: 5,252Professional school degree: 767Doctorate degree: 644
Housing units in structures:
One, detached: 15,029One, attached: 15,501Two: 25,3053 or 4: 23,5185 to 9: 8,77010 to 19: 4,63320 to 49: 8,61450 or more: 16,826Mobile homes: 69Housing units lacking complete plumbing facilities in 2022: 1.2%Housing units lacking complete kitchen facilities in 2022: 3.2%House/condo owner moved in on average 16 years ago
Renter moved in on average 5 years ago
Private vs. public school enrollment:
Students in private schools in grades 1 to 8 (elementary and middle school): 1,785 Here:
5.3%New Jersey:
12.3%
Students in private schools in grades 9 to 12 (high school): 1,396 Here:
9.9%New Jersey:
13.1%
Students in private undergraduate colleges: 3,173 Here:
17.3%New Jersey:
33.2%