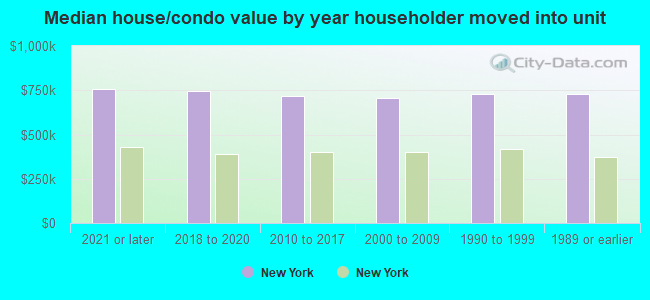
New York, NY (New York) Houses and Residents
| New York: | $724,400 |
| New York: | $400,400 |
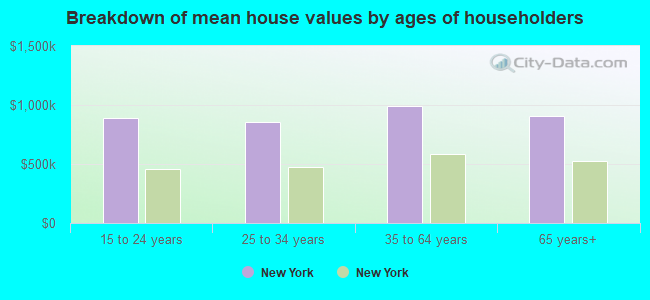
Mean price in 2022:
Detached houses: $846,661
Here: $846,661 State: $476,719 Townhouses or other attached units: $1,044,021
Here: $1,044,021 State: $699,270 In 2-unit structures: $785,523
Here: $785,523 State: $713,077 In 3-to-4-unit structures: $1,021,681
Here: $1,021,681 State: $764,568 In 5-or-more-unit structures: $1,089,576
Here: $1,089,576 State: $912,009 Mobile homes: $507,759
Here: $507,759 State: $88,925 Occupied boats, RVs, vans, etc.: $1,152,454
Here: $1,152,454 State: $480,795
Total population: 8,491,079 (Urban population: 8,008,278, Rural population: 0)
Houses: 3,679,063 (3,373,039 occupied: 1,102,002 owner occupied, 2,271,037 renter occupied)
| % of renters here: | 67% |
| State: | 46% |
Housing density: 12,130 houses/condos per square mile
Median price asked for vacant for-sale houses and condos in 2022: $1,532,599.
Median contract rent in 2022: $1,573 (lower quartile is $1,025, upper quartile is over $2,000)
Median rent asked for vacant for-rent units in 2022: $1,910
Median gross rent in New York, NY in 2022: $1,688
Housing units in New York with a mortgage: 619,055 (50,156 second mortgage, 2,680 home equity loan, 37,526 both second mortgage and home equity loan)
Houses without a mortgage: 16,407
Median household income for houses/condos with a mortgage: $133,864
Median household income for apartments without a mortgage: $89,465
Median monthly housing costs: $1,722
Compare current foreclosures in New York, NY:
| Photo | Address | Area | Beds / Baths | Price | Details |
|---|---|---|---|---|---|

|
#1
E 52nd St Apt 4f
New York, NY 10022
|
700 sq. feet
|
1 baths 1 beds |
$689,900
|
show details |

|
#2
E 81st St Apt 4c
New York, NY 10028
|
696 sq. feet
|
1 baths 1 beds |
$745,000
|
show details |

|
#3
E 36th St Apt 9f
New York, NY 10016
|
700 sq. feet
|
1 baths 1 beds |
$499,900
|
show details |

|
#4
2nd Ave # 5c
New York, NY 10029
|
550 sq. feet
|
1 baths 1 beds |
$429,900
|
show details |

|
#5
E 73rd St
New York, NY 10021
|
1,253 sq. feet
|
2 baths 2 beds |
$699,900
|
show details |

|
#6
W 110th St Apt 9-10
New York, NY 10025
|
- sq. feet
|
2 baths 2 beds |
$627,000
|
show details |

|
#7
Park Ave # 3w4c
New York, NY 10028
|
- sq. feet
|
4 baths 4 beds |
$8,250,000
|
show details |

|
#8
E 56th St # 1700
New York, NY 10022
|
1,986 sq. feet
|
- baths 2 beds |
$995,000
|
show details |

|
#9
W End Ave Apt 10d
New York, NY 10023
|
- sq. feet
|
1 baths 1 beds |
$429,900
|
show details |

|
#10
York Ave Apt 2a
New York, NY 10021
|
442 sq. feet
|
1 baths 1 beds |
show details |
| Photo | Address | Area | Beds / Baths | Price | Details |
|---|---|---|---|---|---|

|
#11
W 81st St 4 E
New York, NY 10024
|
780 sq. feet
|
1 baths 2 beds |
show details | |

|
#12
3rd Ave Apt 29f
New York, NY 10128
|
1,161 sq. feet
|
2 baths 2 beds |
show details | |

|
#13
E 104th St # 7b
New York, NY 10029
|
1,243 sq. feet
|
2 baths 2 beds |
show details | |

|
#14
Broadway Apt 7e
New York, NY 10019
|
- sq. feet
|
1 baths 1 beds |
show details | |

|
#15
E 61st St Apt 28e
New York, NY 10065
|
2,500 sq. feet
|
- baths - beds |
show details | |

|
#16
Park Avenue Unit 1203 And Parking Unit 7
New York, NY 10016
|
1,430 sq. feet
|
- baths - beds |
show details | |

|
#17
W 42nd St
New York, NY 10036
|
- sq. feet
|
1 baths 1 beds |
show details | |

|
#18
Broadway Apt 21g
New York, NY 10019
|
- sq. feet
|
2 baths 2 beds |
show details | |

|
#19
W 123rd St
New York, NY 10027
|
3,024 sq. feet
|
- baths - beds |
show details | |

|
#20
W 95th St Apt 1f
New York, NY 10025
|
- sq. feet
|
- baths - beds |
show details |
| Photo | Address | Area | Beds / Baths | Price | Details |
|---|---|---|---|---|---|

|
#21
Broadway Ter Apt 1a
New York, NY 10040
|
- sq. feet
|
- baths - beds |
show details | |

|
#22
Rector Pl
New York, NY 10280
|
- sq. feet
|
- baths - beds |
show details | |

|
#23
E 88th St Apt 5f
New York, NY 10128
|
- sq. feet
|
- baths - beds |
show details | |

|
#24
E 126th St # 1022
New York, NY 10035
|
- sq. feet
|
- baths - beds |
show details | |

|
#25
Vermilyea Ave Apt 1b
New York, NY 10034
|
- sq. feet
|
- baths - beds |
show details | |

|
#26
Malcolm X Blvd Apt 4h
New York, NY 10037
|
- sq. feet
|
- baths - beds |
show details | |

|
#27
W 18th St # 6k
New York, NY 10011
|
- sq. feet
|
- baths - beds |
show details | |

|
#28
W 120th St
New York, NY 10027
|
- sq. feet
|
- baths - beds |
show details | |

|
#29
W 57th St
New York, NY 10019
|
- sq. feet
|
- baths - beds |
show details | |

|
#30
W 42nd 2e
New York, NY 10036
|
- sq. feet
|
- baths - beds |
show details |
| Photo | Address | Area | Beds / Baths | Price | Details |
|---|---|---|---|---|---|

|
#31
E 1st 5c
New York, NY 10003
|
- sq. feet
|
- baths - beds |
show details | |

|
#32
W 46th St
New York, NY 10036
|
- sq. feet
|
- baths - beds |
show details | |

|
#33
5th Ave
New York, NY 10022
|
- sq. feet
|
- baths - beds |
show details | |

|
#34
2nd Ave
New York, NY 10035
|
- sq. feet
|
- baths - beds |
show details | |

|
#35
Riverside Blvd Apt 17b
New York, NY 10069
|
- sq. feet
|
- baths - beds |
show details | |

|
#36
E 121st St # 5g
New York, NY 10035
|
- sq. feet
|
- baths - beds |
show details | |

|
#37
E 106th St
New York, NY 10029
|
- sq. feet
|
- baths - beds |
show details | |

|
#38
W 57th St # 569
New York, NY 10019
|
- sq. feet
|
- baths - beds |
show details | |

|
#39
Broadway
New York, NY 10040
|
- sq. feet
|
- baths - beds |
show details | |

|
#40
Pinehurst Ave Apt 2b
New York, NY 10033
|
- sq. feet
|
- baths - beds |
show details |
| Photo | Address | Area | Beds / Baths | Price | Details |
|---|---|---|---|---|---|

|
#41
E 84th St Apt 19e
New York, NY 10028
|
- sq. feet
|
- baths - beds |
show details | |

|
#42
2nd Ave Apt 3a
New York, NY 10035
|
- sq. feet
|
- baths - beds |
show details | |

|
#43
W 93rd St Apt 28d
New York, NY 10025
|
- sq. feet
|
- baths - beds |
show details | |

|
#44
W 93rd St Apt 2b
New York, NY 10025
|
- sq. feet
|
- baths - beds |
show details | |

|
#45
E 72nd St Apt 15h
New York, NY 10021
|
- sq. feet
|
- baths - beds |
show details | |

|
#46
Wadsworth Ave Apt 4v
New York, NY 10033
|
- sq. feet
|
- baths - beds |
show details | |

|
#47
W 186th St Apt 5f
New York, NY 10033
|
- sq. feet
|
- baths - beds |
show details | |

|
#48
Fdr Dr Apt 1c
New York, NY 10009
|
- sq. feet
|
- baths - beds |
show details | |

|
#49
Water St Apt 5e
New York, NY 10005
|
- sq. feet
|
- baths - beds |
show details | |

|
Check over 1 million property listings on Foreclosure.com!
|
browse all offers | |||


Median year apartment built: 1953
Household type by relationship:
Households: 8,335,897- Male householders: 1,544,366 (482,755 living alone), Female householders: 1,828,673 (666,731 living alone)
1,171,086 spouses (1,142,951 opposite-sex spouses), 240,130 unmarried partners, (216,964 opposite-sex unmarried partners), 2,240,618 children (2,171,516 natural, 24,783 adopted, 44,319 stepchildren), 204,148 grandchildren, 139,577 brothers or sisters, 202,426 parents, 6,663 foster children, 219,411 other relatives, 333,466 non-relatives
- In group quarters: 205,333
Size of family households: 740,799 2-persons, 485,560 3-persons, 368,974 4-persons, 179,161 5-persons, 78,077 6-persons, 64,943 7-or-more-persons.
Size of nonfamily households: 1,149,486 1-person, 242,763 2-persons, 44,471 3-persons, 13,248 4-persons, 3,193 5-persons, 1,445 6-persons, 919 7-or-more-persons.
902,048 married couples with children.
505,016 single-parent households (96,380 men, 408,636 women).
52.0% of residents of New York speak English at home.
23.1% of residents speak Spanish at home (53% speak English very well, 19% speak English well, 19% speak English not well, 9% don't speak English at all).
12.8% of residents speak other Indo-European language at home (58% speak English very well, 26% speak English well, 13% speak English not well, 3% don't speak English at all).
9.0% of residents speak Asian or Pacific Island language at home (40% speak English very well, 23% speak English well, 25% speak English not well, 12% don't speak English at all).
3.1% of residents speak other language at home (68% speak English very well, 22% speak English well, 8% speak English not well, 2% don't speak English at all).
Foreign born population: 3,065,136 (36.8%)
(60.3% of them are naturalized citizens)
| Here: | 5.1 |
| State: | 6.3 |
| Here: | 3.5 |
| State: | 3.8 |
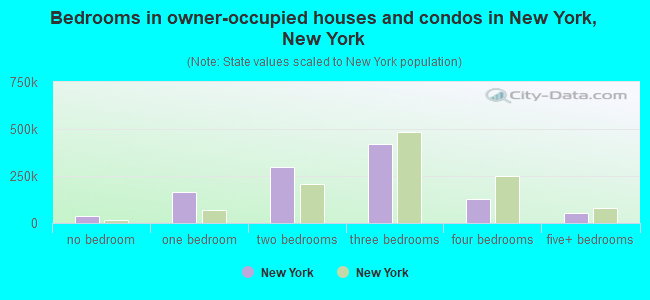
- Bedrooms in owner-occupied houses and condos in New York, New York
- 39,151no bedroom
- 162,7991 bedroom
- 295,5672 bedrooms
- 420,7923 bedrooms
- 128,2184 bedrooms
- 55,4755+ bedrooms
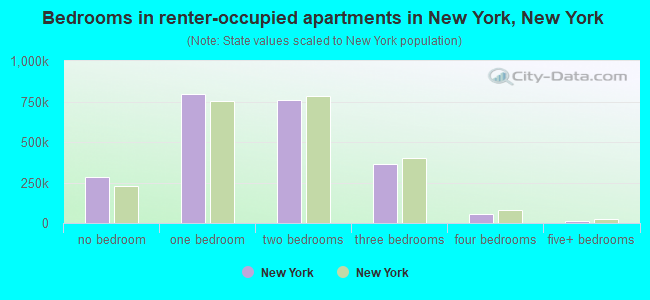
- Bedrooms in renter-occupied apartments in New York, New York
- 286,622no bedroom
- 794,9541 bedroom
- 760,4732 bedrooms
- 361,9633 bedrooms
- 55,8044 bedrooms
- 11,2215+ bedrooms
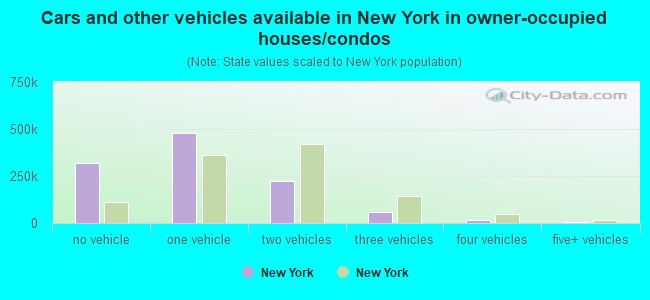
- Cars and other vehicles available in New York in owner-occupied houses/condos
- 318,677no vehicle
- 476,6661 vehicle
- 224,7932 vehicles
- 59,5923 vehicles
- 17,5934 vehicles
- 4,6815+ vehicles
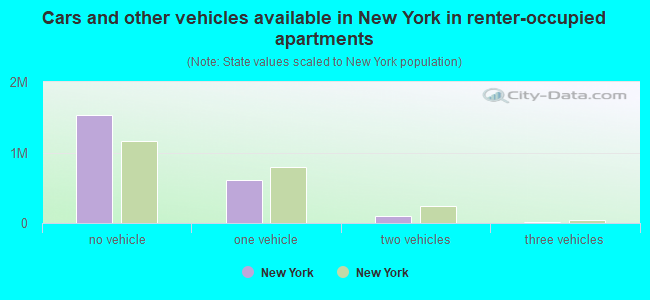
- Cars and other vehicles available in New York in renter-occupied apartments
- 1,537,367no vehicle
- 612,9431 vehicle
- 106,2612 vehicles
- 12,1343 vehicles
- 1,5544 vehicles
- 7785+ vehicles
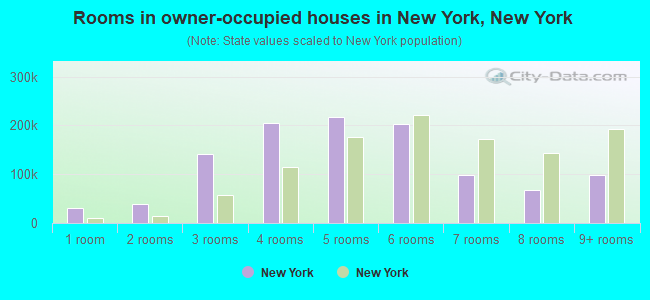
- Rooms in owner-occupied houses in New York, New York
- 30,2061 room
- 39,9142 rooms
- 142,3283 rooms
- 204,3374 rooms
- 216,7825 rooms
- 203,7976 rooms
- 98,3707 rooms
- 67,3018 rooms
- 98,9679+ rooms
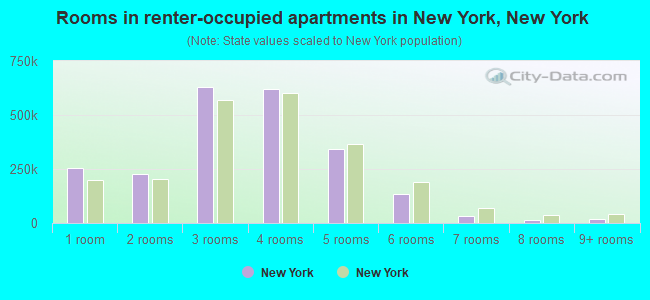
- Rooms in renter-occupied apartments in New York, New York
- 252,3621 room
- 228,6782 rooms
- 629,9913 rooms
- 619,1474 rooms
- 342,6735 rooms
- 132,9026 rooms
- 33,4667 rooms
- 14,4948 rooms
- 17,3249+ rooms
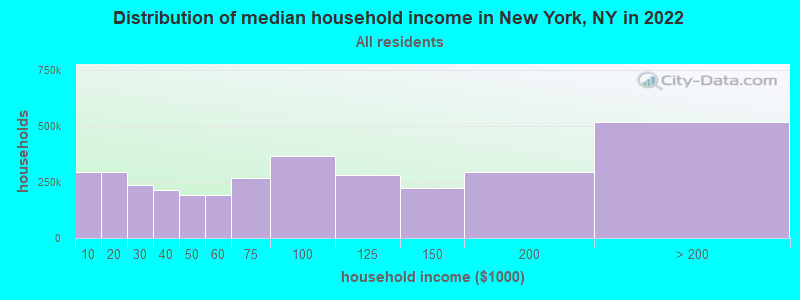
New York, NY household income distribution

- 293,375Less than $10,000
- 293,280$10,000 to $19,999
- 235,066$20,000 to $29,999
- 214,954$30,000 to $39,999
- 192,895$40,000 to $49,999
- 192,330$50,000 to $59,999
- 269,578$60,000 to $74,999
- 367,627$75,000 to $99,999
- 281,593$100,000 to $124,999
- 222,521$125,000 to $149,999
- 292,862$150,000 to $199,999
- 516,958$200,000 or more
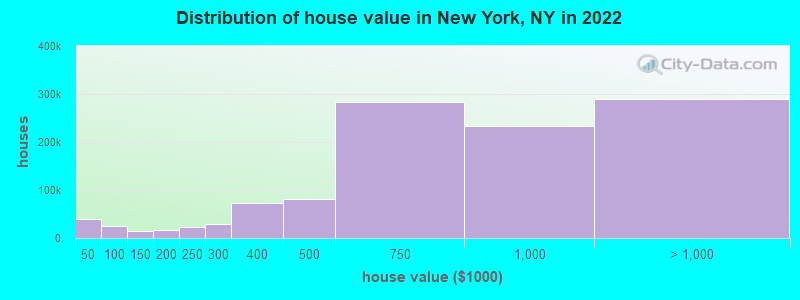
Home value of owner - occupied houses in 2022 in New York, NY
-
- 16,389Less than $10,000
- 2,317$10,000 to $14,999
- 2,870$15,000 to $19,999
- 4,181$20,000 to $24,999
- 2,905$25,000 to $29,999
- 2,760$30,000 to $34,999
- 1,695$35,000 to $39,999
- 5,856$40,000 to $49,999
- 4,060$50,000 to $59,999
- 4,784$60,000 to $69,999
- 2,797$70,000 to $79,999
- 3,352$80,000 to $89,999
- 4,702$90,000 to $99,999
- 10,637$100,000 to $124,999
- 4,849$125,000 to $149,999
- 9,073$150,000 to $174,999
- 7,262$175,000 to $199,999
- 23,169$200,000 to $249,999
- 29,503$250,000 to $299,999
- 73,323$300,000 to $399,999
- 80,663$400,000 to $499,999
- 282,809$500,000 to $749,999
- 233,071$750,000 to $999,999
- 139,039$1,000,000 to $1,499,999
- 57,346$1,500,000 to $1,999,999
- 92,590$2,000,000 or more
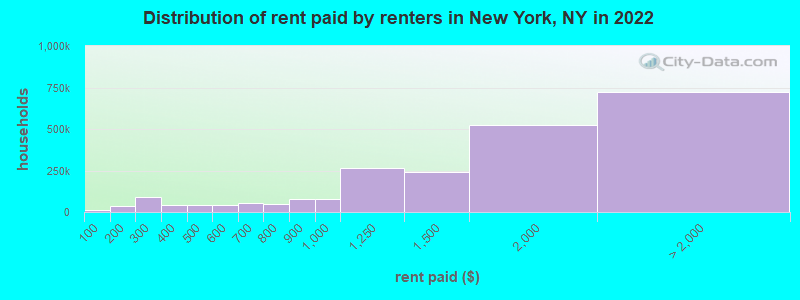
Rent paid by renters in 2022 in New York, NY
-
- 9,047Less than $100
- 8,785$100 to $149
- 26,465$150 to $199
- 46,084$200 to $249
- 46,856$250 to $299
- 26,010$300 to $349
- 19,011$350 to $399
- 25,271$400 to $449
- 16,376$450 to $499
- 25,670$500 to $549
- 16,008$550 to $599
- 28,806$600 to $649
- 25,222$650 to $699
- 26,401$700 to $749
- 23,316$750 to $799
- 76,443$800 to $899
- 80,234$900 to $999
- 262,156$1,000 to $1,249
- 239,594$1,250 to $1,499
- 521,899$1,500 to $1,999
- 273,445$2,000 to $2,499
- 124,711$2,500 to $2,999
- 84,025$3,000 to $3,499
- 177,046$3,500 or more
- 62,156No cash rent
Percentage of workers working in this county: 62.4%
Number of people working at home: 634,778 (16.1% of all workers)
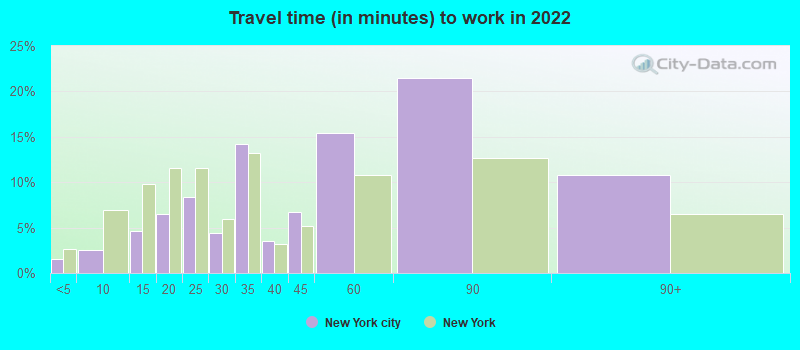
Travel time to work (commute)
- Less than 5 minutes: 58,750
- 5 to 9 minutes: 92,347
- 10 to 14 minutes: 172,586
- 15 to 19 minutes: 247,490
- 20 to 24 minutes: 317,926
- 25 to 29 minutes: 159,185
- 30 to 34 minutes: 520,629
- 35 to 39 minutes: 128,100
- 40 to 44 minutes: 229,340
- 45 to 59 minutes: 514,707
- 60 to 89 minutes: 635,196
- 90 or more minutes: 233,638
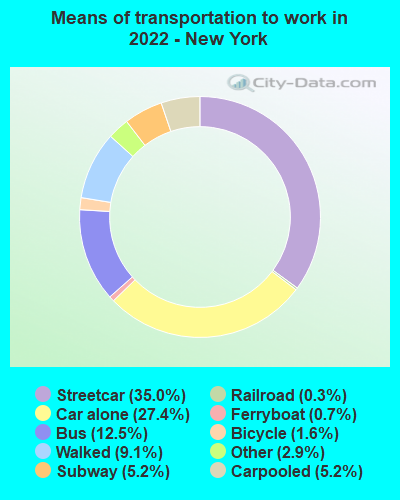
Means of transportation to work:
- Drove a car alone: 1,087,340 (23.7%)
- Carpooled: 204,775 (4.5%)
- Bus: 495,305 (10.8%)
- Subway or elevated rail: 1,386,616 (30.2%)
- Long-distance train or commuter rail: 207,776 (4.5%)
- Light rail, streetcar or trolley: 13,019 (0.3%)
- Ferryboat: 25,987 (0.6%)
- Taxi: 114,160 (2.5%)
- Bicycle: 65,171 (1.4%)
- Walked: 361,350 (7.9%)
- Worked at home: 634,778 (13.8%)
- Unemployment by race in 2022
- Unemployment rate for White non-Hispanic residents
- 4.4%Males
- 4.1%Females
- Unemployment rate for Black residents
- 11.2%Males
- 8.9%Females
- Unemployment rate for American Indian and Alaska Native residents
- 8.3%Males
- 9.2%Females
- Unemployment rate for Asian residents
- 5.1%Males
- 4.2%Females
- Unemployment rate for other race residents
- 6.9%Males
- 7.7%Females
- Unemployment rate for two or more race residents
- 6.4%Males
- 7.6%Females
- Unemployment rate for Hispanic or Latino residents
- 6.6%Males
- 8.0%Females
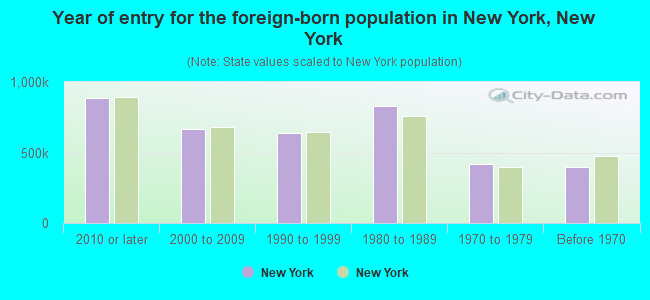
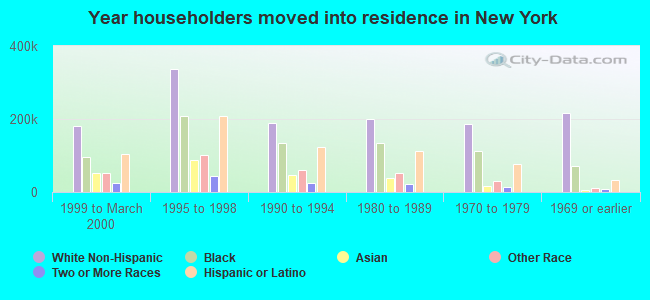
- Year of entry for the foreign-born population in New York, New York
- 887,1272010 or later
- 668,8502000 to 2009
- 641,8221990 to 1999
- 831,7581980 to 1989
- 417,3481970 to 1979
- 397,402Before 1970
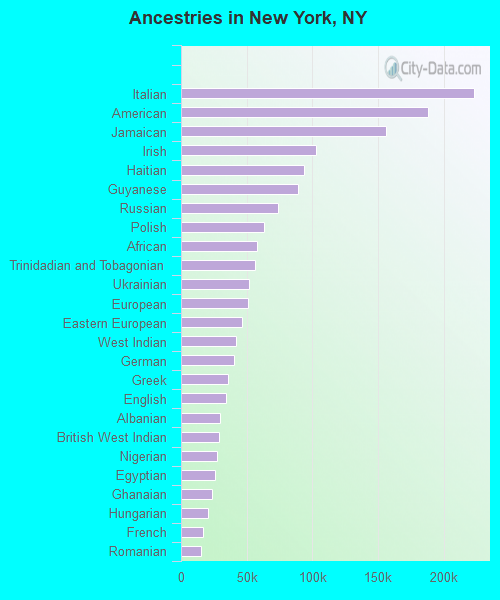
First ancestries reported:
- Italian: 223,388 (4.2%)
- American: 188,027 (3.6%)
- Jamaican: 156,460 (3.0%)
- Irish: 102,652 (1.9%)
- Haitian: 93,599 (1.8%)
- Guyanese: 89,335 (1.7%)
- Russian: 74,078 (1.4%)
- Polish: 62,917 (1.2%)
- African: 57,919 (1.1%)
- Trinidadian and Tobagonian: 56,578 (1.1%)
- Ukrainian: 51,853 (1.0%)
- European: 50,810 (1.0%)
- Eastern European: 46,340 (0.9%)
- West Indian: 42,170 (0.8%)
- German: 40,255 (0.8%)
- Greek: 36,007 (0.7%)
- English: 34,425 (0.7%)
- Albanian: 30,026 (0.6%)
- British West Indian: 29,005 (0.5%)
- Nigerian: 27,269 (0.5%)
- Egyptian: 25,797 (0.5%)
- Ghanaian: 23,808 (0.5%)
- Hungarian: 20,900 (0.4%)
- French: 16,797 (0.3%)
- Romanian: 15,322 (0.3%)
- Barbadian: 13,546 (0.3%)
- Turkish: 13,006 (0.2%)
- Israeli: 10,524 (0.2%)
- Iranian: 9,240 (0.2%)
- British: 9,029 (0.2%)
- Armenian: 8,693 (0.2%)
- Moroccan: 7,926 (0.2%)
- Scottish: 7,724 (0.1%)
- Lebanese: 7,570 (0.1%)
- Brazilian: 7,130 (0.1%)
- Syrian: 7,115 (0.1%)
- Macedonian: 6,582 (0.1%)
- Belizean: 6,381 (0.1%)
- Arab: 5,368 (0.1%)
- Norwegian: 5,171 (0.10%)
- Ethiopian: 5,073 (0.10%)
- Senegalese: 4,891 (0.09%)
- Palestinian: 4,771 (0.09%)
- Lithuanian: 4,710 (0.09%)
- Afghan: 4,629 (0.09%)
- Portuguese: 4,531 (0.09%)
- Slavic: 4,264 (0.08%)
- Liberian: 4,156 (0.08%)
- Croatian: 3,952 (0.07%)
- Dutch: 3,787 (0.07%)
- Swedish: 3,525 (0.07%)
- Bulgarian: 3,519 (0.07%)
- Danish: 3,055 (0.06%)
- Slovak: 3,032 (0.06%)
- South African: 2,936 (0.06%)
- Serbian: 2,915 (0.06%)
- Austrian: 2,905 (0.06%)
- French Canadian: 2,802 (0.05%)
- Northern European: 2,474 (0.05%)
- Scotch-Irish: 2,207 (0.04%)
- Czech: 1,953 (0.04%)
- Yugoslavian: 1,927 (0.04%)
- Swiss: 1,894 (0.04%)
- Scandinavian: 1,686 (0.03%)
- Canadian: 1,679 (0.03%)
- Maltese: 1,626 (0.03%)
- Australian: 1,500 (0.03%)
- Belgian: 1,310 (0.02%)
- Kenyan: 1,299 (0.02%)
- U.S. Virgin Islander: 1,296 (0.02%)
- Latvian: 1,160 (0.02%)
- Jordanian: 1,098 (0.02%)
- Iraqi: 1,064 (0.02%)
- Welsh: 1,059 (0.02%)
- Sudanese: 1,045 (0.02%)
- Cape Verdean: 971 (0.02%)
- Sierra Leonean: 911 (0.02%)
- Icelander: 898 (0.02%)
- Dutch West Indian: 885 (0.02%)
- Czechoslovakian: 799 (0.02%)
- Finnish: 786 (0.01%)
- Cypriot: 785 (0.01%)
- Soviet Union: 518 (0.01%)
- Somali: 496 (0.01%)
- Bahamian: 468 (0.01%)
- Zimbabwean: 428 (0.01%)
- Assyrian: 366 (0.01%)
- Celtic: 328 (0.01%)
- Estonian: 301 (0.01%)
- Basque: 275 (0.01%)
Most common places of birth for foreign-born residents (%):
| New York: | 13.7% (419,526) |
| New York: | 11.3% (502,381) |
| New York: | 11.3% (347,231) |
| New York: | 9.5% (423,118) |
| New York: | 5.4% (166,670) |
| New York: | 4.9% (219,146) |
| New York: | 4.9% (151,559) |
| New York: | 5.0% (224,376) |
| New York: | 4.5% (137,769) |
| New York: | 3.7% (165,926) |
| New York: | 4.0% (121,999) |
| New York: | 4.0% (177,976) |
| New York: | 3.2% (97,506) |
| New York: | 2.6% (118,181) |
| New York: | 2.6% (78,316) |
| New York: | 2.7% (119,938) |
| New York: | 2.5% (78,001) |
| New York: | 2.7% (122,494) |
| New York: | 2.4% (72,125) |
| New York: | 2.0% (88,108) |
| New York: | 2.2% (68,805) |
| New York: | 3.3% (146,955) |
| New York: | 2.1% (65,719) |
| New York: | 1.9% (83,376) |
| New York: | 1.8% (53,997) |
| New York: | 2.0% (88,656) |
| New York: | 1.7% (50,825) |
| New York: | 1.9% (82,663) |
| New York: | 1.6% (48,411) |
| New York: | 1.4% (63,022) |
Place of birth for U.S.-born residents:
- This state: 3,998,613
- Other state: 974,492
- Northeast: 318,620
- Midwest: 162,571
- South: 323,719
- West: 169,582
89.3% of New York residents lived in the same house 1 years ago.
Out of people who lived in different houses, 37.2% lived in this county.
Out of people who lived in different counties, 27.2% lived in New York.
| New York: | 89.3% |
| State average: | 89.6% |
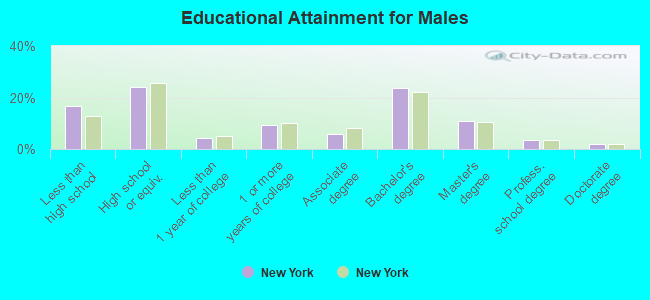
Education attainment for males 25 years and older:
- No schooling: 106,767
- Nursery to 4th grade: 22,162
- 5th and 6th grade: 58,032
- 7th and 8th grade: 54,880
- 9th grade: 44,097
- 10th grade: 43,582
- 11th grade: 41,386
- 12th grade, no diploma: 93,630
- High school graduate (or equivalency): 681,630
- Less than 1 year of college: 115,987
- Some college more than 1 year, no degree: 262,444
- Associate degree: 159,096
- Bachelor's degree: 665,967
- Master's degree: 304,555
- Professional school degree: 103,379
- Doctorate degree: 53,367
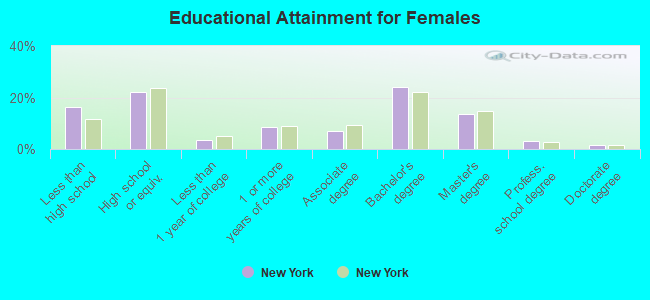
Education attainment for females 25 years and older:
- No schooling: 122,527
- Nursery to 4th grade: 28,958
- 5th and 6th grade: 74,216
- 7th and 8th grade: 61,456
- 9th grade: 50,062
- 10th grade: 43,719
- 11th grade: 46,730
- 12th grade, no diploma: 86,872
- High school graduate (or equivalency): 699,247
- Less than 1 year of college: 115,116
- Some college more than 1 year, no degree: 266,701
- Associate degree: 216,267
- Bachelor's degree: 758,774
- Master's degree: 431,724
- Professional school degree: 95,078
- Doctorate degree: 52,605
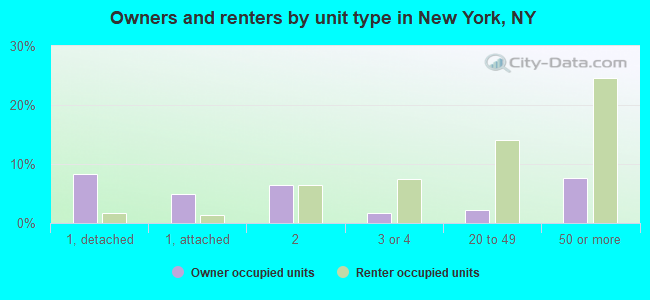
Housing units in structures:
- One, detached: 339,417
- One, attached: 257,428
- Two: 448,188
- 3 or 4: 332,899
- 5 to 9: 246,495
- 10 to 19: 245,587
- 20 to 49: 593,019
- 50 or more: 1,207,779
- Mobile homes: 7,079
- Boats, RVs, vans, etc.: 1,172
Median worth of mobile homes: $105,100
Housing units lacking complete kitchen facilities in 2022: 1.6%
House/condo owner moved in on average 15 years ago
Renter moved in on average 6 years ago
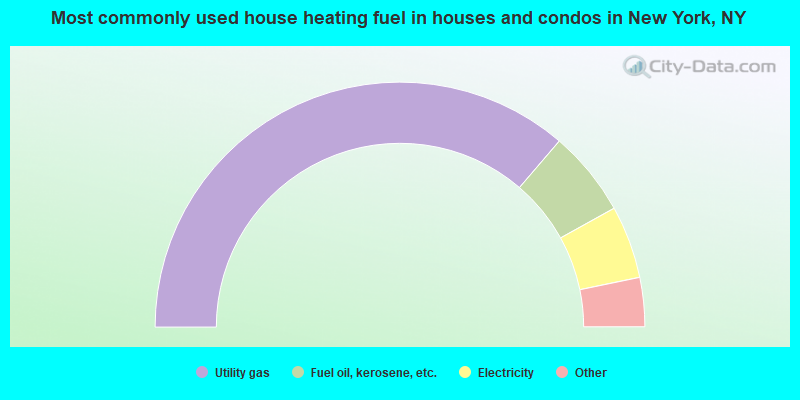
- 72.5%Utility gas
- 11.3%Fuel oil, kerosene, etc.
- 9.6%Electricity
- 3.3%Bottled, tank, or LP gas
- 1.5%No fuel used
- 1.3%Other fuel
- 0.3%Solar energy
- 0.1%Wood
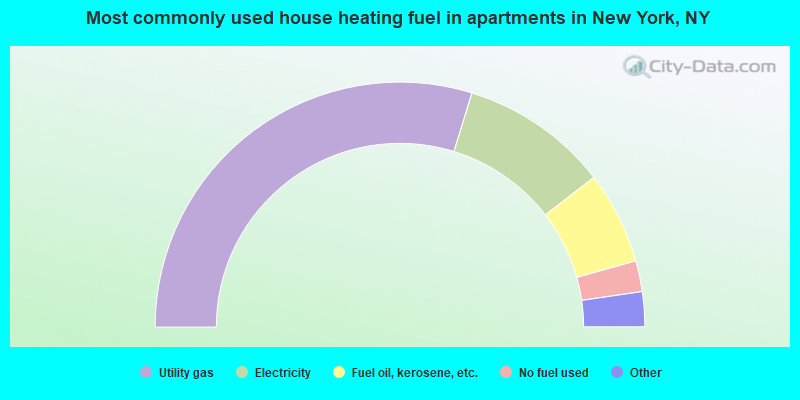
- 59.5%Utility gas
- 19.6%Electricity
- 12.2%Fuel oil, kerosene, etc.
- 4.1%No fuel used
- 2.5%Bottled, tank, or LP gas
- 1.9%Other fuel
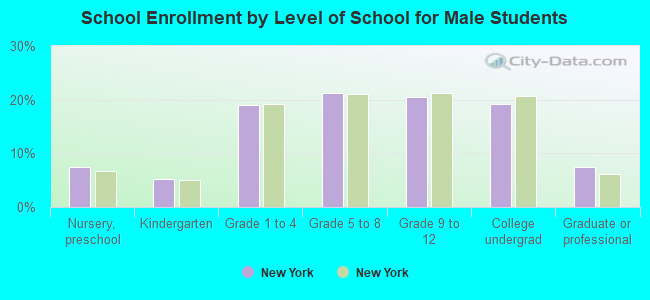
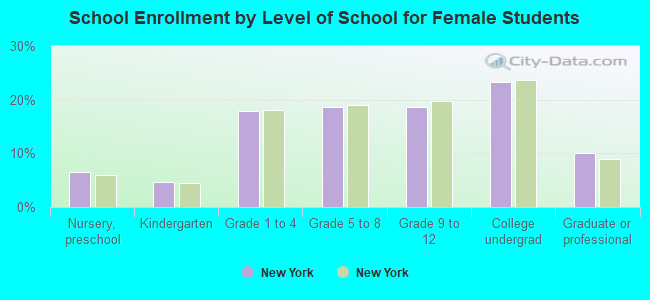
Private vs. public school enrollment:
| Here: | 19.0% |
| New York: | 15.6% |
| Here: | 19.9% |
| New York: | 15.0% |
| Here: | 40.0% |
| New York: | 39.2% |