New Milford, NJ (New Jersey) Houses and Residents
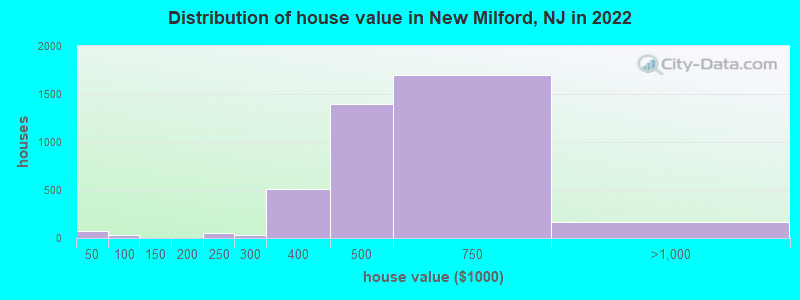
Estimated median house or condo value in 2022: $494,618 (it was $222,600 in 2000 )
New Milford:
$494,618New Jersey:
$428,900
Lower value quartile - upper value quartile: $424,984 - $605,006Total population: 16,678 (Urban population: 16,400, Rural population: 0)
Houses: 6,400 (6,208 occupied: 3,965 owner occupied, 2,276 renter occupied )
% of renters here:
36%State:
35%
Housing density: 2,770 houses/condos per square mile
Median price asked for vacant for-sale houses and condos in 2022: $1,092,604.
Median contract rent in 2022: $1,479 (lower quartile is $1,315, upper quartile is $1,794)
Median rent asked for vacant for-rent units in 2022: $6,932
Median gross rent in New Milford, NJ in 2022: $1,641
Housing units in New Milford with a mortgage: 2,542 (350 second mortgage, 0 home equity loan, 340 both second mortgage and home equity loan )Houses without a mortgage: 229
Median household income for houses/condos with a mortgage: $170,221
Median household income for apartments without a mortgage: $94,571
Median monthly housing costs: $1,799
Data:
Median house or condo value ($)
Median house or condo value ($ change since 2000)
Median house or condo value ($) - White
Median house or condo value ($) - Black or African American
Median house or condo value ($) - Asian
Median house or condo value ($) - Hispanic or Latino
Median house or condo value ($) - American Indian and Alaska Native
Median house or condo value ($) - Multirace
Median house or condo value ($) - Other Race
Median price asked for mobile homes ($)
Household density (households per square mile)
Mean house or condo value by units in structure - 1, detached ($)
Mean house or condo value by units in structure - 1, attached ($)
Mean house or condo value by units in structure - 2 ($)
Mean house or condo value by units in structure by units in structure - 3 or 4 ($)
Mean house or condo value by units in structure - 5 or more ($)
Mean house or condo value by units in structure - Boat, RV, van, etc. ($)
Mean house or condo value by units in structure - Mobile home ($)
Median contract rent ($)
Median contract rent - Lower quartile ($)
Median contract rent - Upper quartile ($)
Median gross rent ($)
Urban houses (%)
Rural houses (%)
Houses occupied (%)
Houses occupied (% change since 2000)
Houses owner occupied (%)
Houses owner occupied (% change since 2000)
Houses renter occupied (%)
Houses renter occupied (% change since 2000)
Vacant housing units - For rent (%)
Vacant housing units - For rent (% change since 2000)
Vacant housing units - For sale only (%)
Vacant housing units - For sale only (% change since 2000)
Vacant housing units - Rented or sold, not occupied (%)
Vacant housing units - Rented or sold, not occupied (% change since 2000)
Vacant housing units - For seasonal, recreational, or occasional use (%)
Vacant housing units - For seasonal, recreational, or occasional use (% change since 2000)
Vacant housing units - For migrant workers (%)
Vacant housing units - For migrant workers (% change since 2000)
Vacant housing units - Other vacant (%)
Vacant housing units - Other vacant (% change since 2000)
Median monthly housing costs ($)
Median household income for houses/condos with a mortgage ($)
Median household income for houses/condos without a mortgage ($)
Median household income ($)
Median household income ($) - White
Median household income ($) - Black or African American
Median household income ($) - Asian
Median household income ($) - Hispanic or Latino
Median household income ($) - American Indian and Alaska Native
Median household income ($) - Multirace
Median household income ($) - Other Race
Mortgage status - with mortgage (%)
Mortgage status - with second mortgage (%)
Mortgage status - with home equity loan (%)
Mortgage status - with both second mortgage and home equity loan (%)
Mortgage status - without a mortgage (%)
Median year house/condo built
Median year apartment built
Household type by relationship - Male householder living alone (%)
Household type by relationship - Male householder not living alone (%)
Household type by relationship - Female householder living alone (%)
Household type by relationship - Female householder not living alone (%)
Household type by relationship - Opposite-Sex spouse (%)
Household type by relationship - Same-Sex spouse (%)
Household type by relationship - Opposite-Sex unmarried partner (%)
Household type by relationship - Same-Sex unmarried partner (%)
Household type by relationship - In group quarters (%)
Size of family households - 2-person household (%)
Size of family households - 3-person household (%)
Size of family households - 4-person household (%)
Size of family households - 5-person household (%)
Size of family households - 6-person household (%)
Size of family households - 7-or-more-person household (%)
Size of nonfamily households - 1-person household (%)
Size of nonfamily households - 2-person household (%)
Size of nonfamily households - 3-person household (%)
Size of nonfamily households - 4-person household (%)
Size of nonfamily households - 5-person household (%)
Size of nonfamily households - 6-person household (%)
Size of nonfamily households - 7-or-moreperson household (%)
Year house built - Built 2010 or later (%)
Year house built - Built 2000 to 2009 (%)
Year house built - Built 1990 to 1999 (%)
Year house built - Built 1980 to 1989 (%)
Year house built - Built 1970 to 1979 (%)
Year house built - Built 1960 to 1969 (%)
Year house built - Built 1950 to 1959 (%)
Year house built - Built 1940 to 1949 (%)
Year house built - Built 1939 or earlier (%)
Median number of rooms in houses and condos
Median number of rooms in apartments
Median number of bedrooms in owner occupied houses
Mean number of bedrooms in owner occupied houses
Median number of bedrooms in renter occupied houses
Mean number of bedrooms in renter occupied houses
Median number of vehichles in owner occupied houses
Mean number of vehichles in owner occupied houses
Median number of vehichles in renter occupied houses
Mean number of vehichles in renter occupied houses
Rooms in owner-occupied houses - 1 room (%)
Rooms in owner-occupied houses - 2 rooms (%)
Rooms in owner-occupied houses - 3 rooms (%)
Rooms in owner-occupied houses - 4 rooms (%)
Rooms in owner-occupied houses - 5 rooms (%)
Rooms in owner-occupied houses - 6 rooms (%)
Rooms in owner-occupied houses - 7 rooms (%)
Rooms in owner-occupied houses - 8 rooms (%)
Rooms in owner-occupied houses - 9+ rooms (%)
Rooms in renter-occupied houses - 1 room (%)
Rooms in renter-occupied houses - 2 rooms (%)
Rooms in renter-occupied houses - 3 rooms (%)
Rooms in renter-occupied houses - 4 rooms (%)
Rooms in renter-occupied houses - 5 rooms (%)
Rooms in renter-occupied houses - 6 rooms (%)
Rooms in renter-occupied houses - 7 rooms (%)
Rooms in renter-occupied houses - 8 rooms (%)
Rooms in renter-occupied houses - 9+ rooms (%)
Bedrooms in owner-occupied houses - no bedrooms (%)
Bedrooms in owner-occupied houses - 1 bedroom (%)
Bedrooms in owner-occupied houses - 2 bedrooms (%)
Bedrooms in owner-occupied houses - 3 bedrooms (%)
Bedrooms in owner-occupied houses - 4 bedrooms (%)
Bedrooms in owner-occupied houses - 5+ bedrooms (%)
Bedrooms in renter-occupied houses - no bedrooms (%)
Bedrooms in renter-occupied houses - 1 bedroom (%)
Bedrooms in renter-occupied houses - 2 bedrooms (%)
Bedrooms in renter-occupied houses - 3 bedrooms (%)
Bedrooms in renter-occupied houses - 4 bedrooms (%)
Bedrooms in renter-occupied houses - 5+ bedrooms (%)
Vehicles available in owner-occupied houses - no vehicle available (%)
Vehicles available in owner-occupied houses - 1 vehicle available(%)
Vehicles available in owner-occupied houses - 2 Vehicles available (%)
Vehicles available in owner-occupied houses - 3 Vehicles available (%)
Vehicles available in owner-occupied houses - 4 Vehicles available (%)
Vehicles available in owner-occupied houses - 5+ Vehicles available (%)
Vehicles available in renter-occupied houses - no vehicle available (%)
Vehicles available in renter-occupied houses - 1 vehicle available (%)
Vehicles available in renter-occupied houses - 2 Vehicles available (%)
Vehicles available in renter-occupied houses - 3 Vehicles available (%)
Vehicles available in renter-occupied houses - 4 Vehicles available (%)
Vehicles available in renter-occupied houses - 5+ Vehicles available (%)
Housing units in structures - 1, detached (%)
Housing units in structures - 1, attached (%)
Housing units in structures - 2 (%)
Housing units in structures - 3 or 4 (%)
Housing units in structures - 5 to 9 (%)
Housing units in structures - 10 to 19 (%)
Housing units in structures - 20 to 49 (%)
Housing units in structures - 50 or more (%)
Housing units in structures - Mobile home (%)
Housing units in structures - Boat, RV, van, etc. (%)
Housing units in structures - Owners - 1, detached (%)
Housing units in structures - Owners - 1, attached (%)
Housing units in structures - Owners - 2 (%)
Housing units in structures - Owners - 3 or 4 (%)
Housing units in structures - Owners - 5 to 9 (%)
Housing units in structures - Owners - 10 to 19 (%)
Housing units in structures - Owners - 20 to 49 (%)
Housing units in structures - Owners - 50 or more (%)
Housing units in structures - Owners - Mobile home (%)
Housing units in structures - Owners - Boat, RV, van, etc. (%)
Housing units in structures - Renters - 1, detached (%)
Housing units in structures - Renters - 1, attached (%)
Housing units in structures - Renters - 2 (%)
Housing units in structures - Renters - 3 or 4 (%)
Housing units in structures - Renters - 5 to 9 (%)
Housing units in structures - Renters - 10 to 19 (%)
Housing units in structures - Renters - 20 to 49 (%)
Housing units in structures - Renters - 50 or more (%)
Housing units in structures - Renters - Mobile home (%)
Housing units in structures - Renters - Boat, RV, van, etc. (%)
House/condo owner moved in on average (years ago)
Renter moved in on average (years ago)
Year householder moved into unit - Moved in 1999 to March 2000 (%)
Year householder moved into unit - Moved in 1999 to March 2000 (%) - White
Year householder moved into unit - Moved in 1999 to March 2000 (%) - Black or African American
Year householder moved into unit - Moved in 1999 to March 2000 (%) - Asian
Year householder moved into unit - Moved in 1999 to March 2000 (%) - Hispanic or Latino
Year householder moved into unit - Moved in 1999 to March 2000 (%) - American Indian and Alaska Native
Year householder moved into unit - Moved in 1999 to March 2000 (%) - Multirace
Year householder moved into unit - Moved in 1999 to March 2000 (%) - Other Race
Year householder moved into unit - Moved in 1995 to 1998 (%)
Year householder moved into unit - Moved in 1995 to 1998 (%) - White
Year householder moved into unit - Moved in 1995 to 1998 (%) - Black or African American
Year householder moved into unit - Moved in 1995 to 1998 (%) - Asian
Year householder moved into unit - Moved in 1995 to 1998 (%) - Hispanic or Latino
Year householder moved into unit - Moved in 1995 to 1998 (%) - American Indian and Alaska Native
Year householder moved into unit - Moved in 1995 to 1998 (%) - Multirace
Year householder moved into unit - Moved in 1995 to 1998 (%) - Other Race
Year householder moved into unit - Moved in 1990 to 1994 (%)
Year householder moved into unit - Moved in 1990 to 1994 (%) - White
Year householder moved into unit - Moved in 1990 to 1994 (%) - Black or African American
Year householder moved into unit - Moved in 1990 to 1994 (%) - Asian
Year householder moved into unit - Moved in 1990 to 1994 (%) - Hispanic or Latino
Year householder moved into unit - Moved in 1990 to 1994 (%) - American Indian and Alaska Native
Year householder moved into unit - Moved in 1990 to 1994 (%) - Multirace
Year householder moved into unit - Moved in 1990 to 1994 (%) - Other Race
Year householder moved into unit - Moved in 1980 to 1989 (%)
Year householder moved into unit - Moved in 1980 to 1989 (%) - White
Year householder moved into unit - Moved in 1980 to 1989 (%) - Black or African American
Year householder moved into unit - Moved in 1980 to 1989 (%) - Asian
Year householder moved into unit - Moved in 1980 to 1989 (%) - Hispanic or Latino
Year householder moved into unit - Moved in 1980 to 1989 (%) - American Indian and Alaska Native
Year householder moved into unit - Moved in 1980 to 1989 (%) - Multirace
Year householder moved into unit - Moved in 1980 to 1989 (%) - Other Race
Year householder moved into unit - Moved in 1970 to 1979 (%)
Year householder moved into unit - Moved in 1970 to 1979 (%) - White
Year householder moved into unit - Moved in 1970 to 1979 (%) - Black or African American
Year householder moved into unit - Moved in 1970 to 1979 (%) - Asian
Year householder moved into unit - Moved in 1970 to 1979 (%) - Hispanic or Latino
Year householder moved into unit - Moved in 1970 to 1979 (%) - American Indian and Alaska Native
Year householder moved into unit - Moved in 1970 to 1979 (%) - Multirace
Year householder moved into unit - Moved in 1970 to 1979 (%) - Other Race
Year householder moved into unit - Moved in 1969 or earlier (%)
Year householder moved into unit - Moved in 1969 or earlier (%) - White
Year householder moved into unit - Moved in 1969 or earlier (%) - Black or African American
Year householder moved into unit - Moved in 1969 or earlier (%) - Asian
Year householder moved into unit - Moved in 1969 or earlier (%) - Hispanic or Latino
Year householder moved into unit - Moved in 1969 or earlier (%) - American Indian and Alaska Native
Year householder moved into unit - Moved in 1969 or earlier (%) - Multirace
Year householder moved into unit - Moved in 1969 or earlier (%) - Other Race
Housing units lacking complete plumbing facilities (%)
Housing units lacking complete kitchen facilities (%)
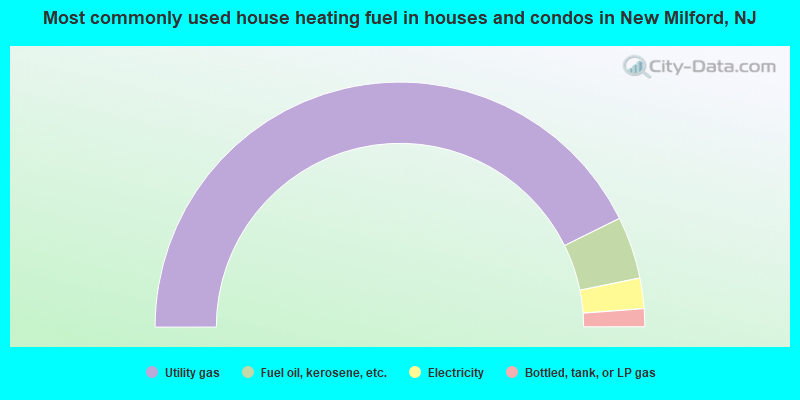
House heating fuel used in houses and condos - Utility gas (%)
House heating fuel used in houses and condos - Bottled, tank, or LP gas (%)
House heating fuel used in houses and condos - Electricity (%)
House heating fuel used in houses and condos - Fuel oil, kerosene, etc. (%)
House heating fuel used in houses and condos - Coal or coke (%)
House heating fuel used in houses and condos - Wood (%)
House heating fuel used in houses and condos - Solar energy (%)
House heating fuel used in houses and condos - Other fuel (%)
House heating fuel used in houses and condos - No fuel used (%)
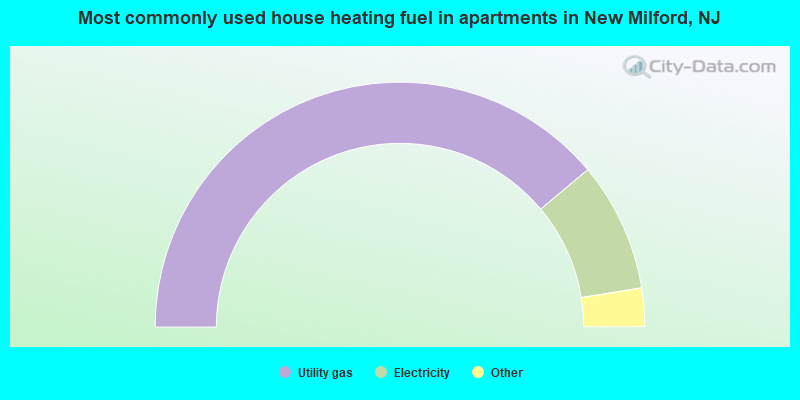
House heating fuel used in apartments - Utility gas (%)
House heating fuel used in apartments - Bottled, tank, or LP gas (%)
House heating fuel used in apartments - Electricity (%)
House heating fuel used in apartments - Fuel oil, kerosene, etc. (%)
House heating fuel used in apartments - Coal or coke (%)
House heating fuel used in apartments - Wood (%)
House heating fuel used in apartments - Solar energy (%)
House heating fuel used in apartments - Other fuel (%)
House heating fuel used in apartments - No fuel used (%)
Median year house/condo built: 1953Median year apartment built: 1960Household type by relationship:
Households: 16,883
Male householders: 3,022 (774 living alone ), Female householders: 3,146 (826 living alone )3,671 spouses (3,652 opposite-sex spouses ), 196 unmarried partners , (196 opposite-sex unmarried partners ), 5,547 children (5,396 natural , 57 adopted , 92 stepchildren ), 221 grandchildren , 190 brothers or sisters , 260 parents , 0 foster children , 220 other relatives , 194 non-relatives In group quarters: 209
Size of family households: 1,544 2-persons , 1,013 3-persons , 1,127 4-persons , 401 5-persons , 157 6-persons , 72 7-or-more-persons .
Size of nonfamily households: 1,655 1-person , 230 2-persons , 26 3-persons .
3,093 married couples with children. single-parent households (0 men , 565 women ).
57.9% of residents of New Milford speak English at home. of residents speak Spanish at home (69% speak English very well , 26% speak English well , 4% speak English not well , 1% don't speak English at all ).of residents speak other Indo-European language at home (73% speak English very well , 21% speak English well , 6% speak English not well ).of residents speak Asian or Pacific Island language at home (71% speak English very well , 21% speak English well , 8% speak English not well ).of residents speak other language at home (63% speak English very well , 19% speak English well , 18% speak English not well ).
Foreign born population: 5,240 (31.0%)of them are naturalized citizens )
Median number of rooms in houses and condos:
Median number of rooms in apartments
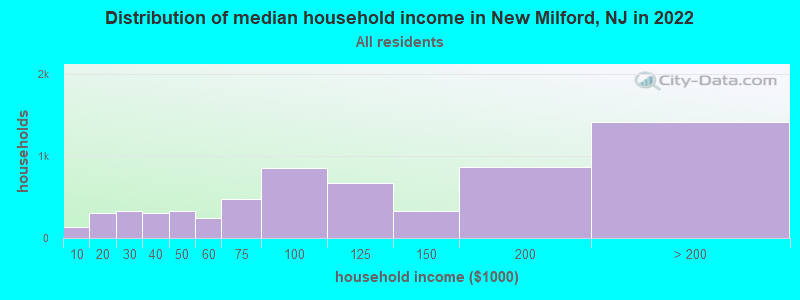
New Milford, NJ household income distribution 128 Less than $10,000310 $10,000 to $19,999333 $20,000 to $29,999302 $30,000 to $39,999332 $40,000 to $49,999248 $50,000 to $59,999471 $60,000 to $74,999850 $75,000 to $99,999675 $100,000 to $124,999331 $125,000 to $149,999862 $150,000 to $199,9991,413 $200,000 or more
Home value of owner - occupied houses in 2022 in New Milford, NJ 57 Less than $10,0003 $15,000 to $19,9997 $40,000 to $49,99914 $50,000 to $59,99912 $70,000 to $79,9994 $125,000 to $149,99948 $200,000 to $249,99926 $250,000 to $299,999508 $300,000 to $399,9991,398 $400,000 to $499,9991,696 $500,000 to $749,999159 $750,000 to $999,9998 $1,000,000 to $1,499,999Rent paid by renters in 2022 in New Milford, NJ 43 $200 to $24923 $350 to $39920 $800 to $89934 $900 to $999229 $1,000 to $1,249858 $1,250 to $1,499834 $1,500 to $1,99976 $2,000 to $2,49963 $2,500 to $2,99954 $3,000 to $3,49937 $3,500 or more10 No cash rent
Percentage of workers working in this county: 70.9%Number of people working at home: 1,297 (14.5% of all workers )
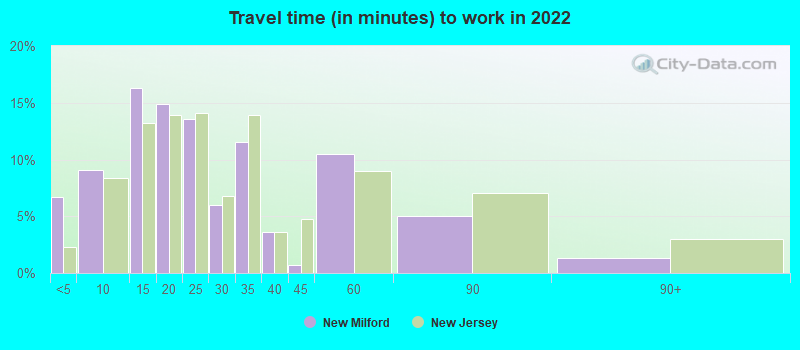
Travel time to work (commute)
Less than 5 minutes: 1755 to 9 minutes: 51610 to 14 minutes: 83215 to 19 minutes: 1,02720 to 24 minutes: 1,36225 to 29 minutes: 63130 to 34 minutes: 94435 to 39 minutes: 21840 to 44 minutes: 30045 to 59 minutes: 69960 to 89 minutes: 49790 or more minutes: 299
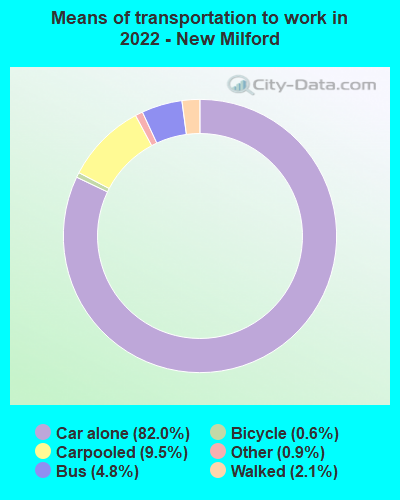
Means of transportation to work:
Drove a car alone: 2,469 (58.3%)Carpooled: 342 (8.1%)Bus : 134 (3.2%)Taxi: 32 (0.8%)Bicycle: 11 (0.3%)Walked: 68 (1.6%)Worked at home: 1,297 (30.6%)
Unemployment by race in 2022
Unemployment rate for White non-Hispanic residents 1.8% Males5.5% FemalesUnemployment rate for Asian residents 14.2% Males1.6% FemalesUnemployment rate for other race residents 2.2% FemalesUnemployment rate for two or more race residents 7.6% Males10.2% FemalesUnemployment rate for Hispanic or Latino residents 3.3% Males3.8% Females
Year of entry for the foreign-born population in New Milford, New Jersey
1,367 2010 or later 1,127 2000 to 2009 1,063 1990 to 1999 1,264 1980 to 1989 574 1970 to 1979 885 Before 1970
First ancestries reported:
Italian: 781 (8.8%)
Irish: 640 (7.2%)
American: 418 (4.7%)
Armenian: 269 (3.0%)
Turkish: 223 (2.5%)
Polish: 197 (2.2%)
German: 185 (2.1%)
Greek: 150 (1.7%)
Eastern European: 99 (1.1%)
Israeli: 98 (1.1%)
Ukrainian: 93 (1.1%)
Russian: 90 (1.0%)
Nigerian: 80 (0.9%)
Brazilian: 56 (0.6%)
Dutch: 52 (0.6%)
Guyanese: 41 (0.5%)
Moroccan: 40 (0.5%)
European: 38 (0.4%)
Jamaican: 37 (0.4%)
Egyptian: 32 (0.4%)
Assyrian: 25 (0.3%)
Czechoslovakian: 22 (0.2%)
Palestinian: 22 (0.2%)
Haitian: 20 (0.2%)
Ethiopian: 19 (0.2%)
Hungarian: 17 (0.2%)
Scottish: 17 (0.2%)
Slovak: 15 (0.2%)
Trinidadian and Tobagonian: 13 (0.1%)
West Indian: 13 (0.1%)
Lebanese: 12 (0.1%)
Norwegian: 11 (0.1%)
English: 10 (0.1%)
French Canadian: 6 (0.07%)
French: 5 (0.06%) Most common places of birth for foreign-born residents (%): Philippines New Milford:
19.3% (1,009)New Jersey:
4.0% (85,934)
India New Milford:
13.8% (725)New Jersey:
12.8% (274,609)
Dominican Republic New Milford:
8.3% (435)New Jersey:
9.7% (209,055)
Turkey New Milford:
5.5% (286)New Jersey:
0.8% (16,778)
Colombia New Milford:
4.7% (244)New Jersey:
4.2% (90,817)
Uruguay New Milford:
4.5% (235)New Jersey:
0.3% (6,972)
Ukraine New Milford:
2.2% (117)New Jersey:
1.1% (22,760)
Korea New Milford:
2.1% (112)New Jersey:
3.3% (70,512)
Ecuador New Milford:
1.9% (102)New Jersey:
4.4% (95,275)
Peru New Milford:
1.8% (92)New Jersey:
2.7% (58,563)
China, excluding Hong Kong and Taiwan New Milford:
1.7% (88)New Jersey:
3.7% (78,969)
Other Caribbean New Milford:
1.7% (87)New Jersey:
0.2% (3,658)
Mexico New Milford:
1.6% (86)New Jersey:
4.8% (102,527)
Japan New Milford:
1.5% (80)New Jersey:
0.5% (10,042)
Place of birth for U.S.-born residents:
This state: 7,437Other state: 3,785Northeast: 3,332Midwest: 129South: 108West: 206 91.4% of New Milford residents lived in the same house 1 years ago.
Out of people who lived in different houses, 32.8% lived in this county.
Out of people who lived in different counties, 39.4% lived in New Jersey.
New Milford:
91.4%State average:
90.4%
Education attainment for males 25 years and older:
No schooling: 216Nursery to 4th grade: 85th and 6th grade: 597th and 8th grade: 09th grade: 1010th grade: 10411th grade: 1012th grade, no diploma: 89High school graduate (or equivalency): 986Less than 1 year of college: 389Some college more than 1 year, no degree: 555Associate degree: 701Bachelor's degree: 1,868Master's degree: 628Professional school degree: 150Doctorate degree: 114
Education attainment for females 25 years and older:
No schooling: 69Nursery to 4th grade: 325th and 6th grade: 517th and 8th grade: 249th grade: 410th grade: 2911th grade: 2312th grade, no diploma: 50High school graduate (or equivalency): 1,263Less than 1 year of college: 378Some college more than 1 year, no degree: 504Associate degree: 593Bachelor's degree: 1,900Master's degree: 926Professional school degree: 102Doctorate degree: 95
Housing units in structures:
One, detached: 4,120One, attached: 131Two: 3743 or 4: 1,3135 to 9: 15410 to 19: 9820 to 49: 4350 or more: 152Mobile homes: 10Housing units lacking complete plumbing facilities in 2022: 0.5%Housing units lacking complete kitchen facilities in 2022: 0.4%House/condo owner moved in on average 19 years ago
Renter moved in on average 2 years ago
Private vs. public school enrollment:
Students in private schools in grades 1 to 8 (elementary and middle school): 76 Here:
4.3%New Jersey:
12.3%
Students in private schools in grades 9 to 12 (high school): 83 Here:
11.5%New Jersey:
13.1%
Students in private undergraduate colleges: 164 Here:
21.1%New Jersey:
33.2%