New Kensington, PA (Pennsylvania) Houses and Residents
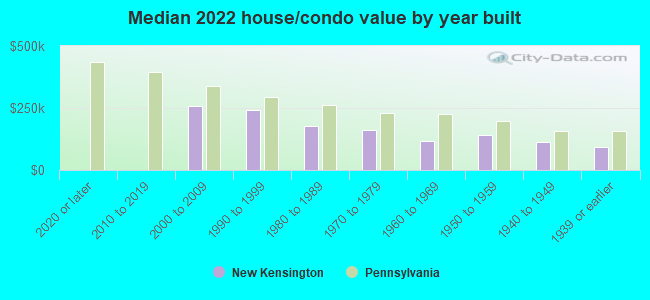
Estimated median house or condo value in 2022: $123,601 (it was $69,700 in 2000 )
New Kensington:
$123,601Pennsylvania:
$245,500
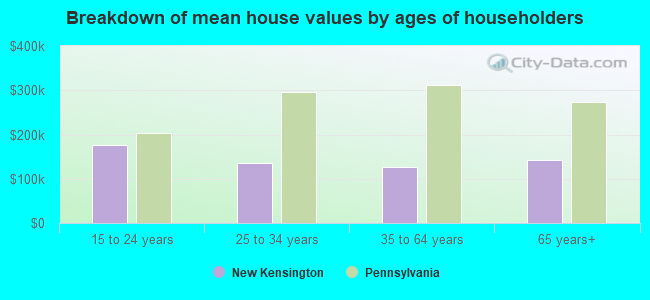
Lower value quartile - upper value quartile: $86,589 - $177,537Mean price in 2022: Detached houses: $152,837 Here:
$152,837State:
$317,202
Townhouses or other attached units: $218,091 Here:
$218,091State:
$254,369
In 2-unit structures: $98,668 Here:
$98,668State:
$249,182
In 5-or-more-unit structures: $173,337 Here:
$173,337State:
$320,068
Mobile homes: $140,829 Here:
$140,829State:
$92,414
Total population: 12,796 (All urban)
Houses: 7,075 (5,988 occupied: 3,644 owner occupied, 2,432 renter occupied )
% of renters here:
40%State:
31%
Housing density: 1,783 houses/condos per square mile
Median price asked for vacant for-sale houses and condos in 2022: $308,083.
Median contract rent in 2022: $613 (lower quartile is $405, upper quartile is $705)
Median rent asked for vacant for-rent units in 2022: $582
Median gross rent in New Kensington, PA in 2022: $692
Housing units in New Kensington with a mortgage: 2,091 (195 second mortgage, 30 home equity loan, 170 both second mortgage and home equity loan )Houses without a mortgage: 271
Median household income for houses/condos with a mortgage: $76,186
Median household income for apartments without a mortgage: $59,092
Median monthly housing costs: $775
Data:
Median house or condo value ($)
Median house or condo value ($ change since 2000)
Median house or condo value ($) - White
Median house or condo value ($) - Black or African American
Median house or condo value ($) - Asian
Median house or condo value ($) - Hispanic or Latino
Median house or condo value ($) - American Indian and Alaska Native
Median house or condo value ($) - Multirace
Median house or condo value ($) - Other Race
Median price asked for mobile homes ($)
Household density (households per square mile)
Mean house or condo value by units in structure - 1, detached ($)
Mean house or condo value by units in structure - 1, attached ($)
Mean house or condo value by units in structure - 2 ($)
Mean house or condo value by units in structure by units in structure - 3 or 4 ($)
Mean house or condo value by units in structure - 5 or more ($)
Mean house or condo value by units in structure - Boat, RV, van, etc. ($)
Mean house or condo value by units in structure - Mobile home ($)
Median contract rent ($)
Median contract rent - Lower quartile ($)
Median contract rent - Upper quartile ($)
Median gross rent ($)
Urban houses (%)
Rural houses (%)
Houses occupied (%)
Houses occupied (% change since 2000)
Houses owner occupied (%)
Houses owner occupied (% change since 2000)
Houses renter occupied (%)
Houses renter occupied (% change since 2000)
Vacant housing units - For rent (%)
Vacant housing units - For rent (% change since 2000)
Vacant housing units - For sale only (%)
Vacant housing units - For sale only (% change since 2000)
Vacant housing units - Rented or sold, not occupied (%)
Vacant housing units - Rented or sold, not occupied (% change since 2000)
Vacant housing units - For seasonal, recreational, or occasional use (%)
Vacant housing units - For seasonal, recreational, or occasional use (% change since 2000)
Vacant housing units - For migrant workers (%)
Vacant housing units - For migrant workers (% change since 2000)
Vacant housing units - Other vacant (%)
Vacant housing units - Other vacant (% change since 2000)
Median monthly housing costs ($)
Median household income for houses/condos with a mortgage ($)
Median household income for houses/condos without a mortgage ($)
Median household income ($)
Median household income ($) - White
Median household income ($) - Black or African American
Median household income ($) - Asian
Median household income ($) - Hispanic or Latino
Median household income ($) - American Indian and Alaska Native
Median household income ($) - Multirace
Median household income ($) - Other Race
Mortgage status - with mortgage (%)
Mortgage status - with second mortgage (%)
Mortgage status - with home equity loan (%)
Mortgage status - with both second mortgage and home equity loan (%)
Mortgage status - without a mortgage (%)
Median year house/condo built
Median year apartment built
Household type by relationship - Male householder living alone (%)
Household type by relationship - Male householder not living alone (%)
Household type by relationship - Female householder living alone (%)
Household type by relationship - Female householder not living alone (%)
Household type by relationship - Opposite-Sex spouse (%)
Household type by relationship - Same-Sex spouse (%)
Household type by relationship - Opposite-Sex unmarried partner (%)
Household type by relationship - Same-Sex unmarried partner (%)
Household type by relationship - In group quarters (%)
Size of family households - 2-person household (%)
Size of family households - 3-person household (%)
Size of family households - 4-person household (%)
Size of family households - 5-person household (%)
Size of family households - 6-person household (%)
Size of family households - 7-or-more-person household (%)
Size of nonfamily households - 1-person household (%)
Size of nonfamily households - 2-person household (%)
Size of nonfamily households - 3-person household (%)
Size of nonfamily households - 4-person household (%)
Size of nonfamily households - 5-person household (%)
Size of nonfamily households - 6-person household (%)
Size of nonfamily households - 7-or-moreperson household (%)
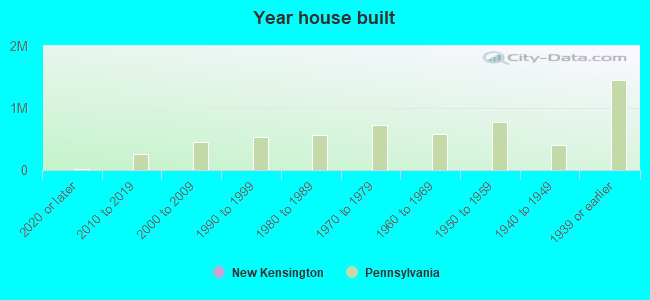
Year house built - Built 2010 or later (%)
Year house built - Built 2000 to 2009 (%)
Year house built - Built 1990 to 1999 (%)
Year house built - Built 1980 to 1989 (%)
Year house built - Built 1970 to 1979 (%)
Year house built - Built 1960 to 1969 (%)
Year house built - Built 1950 to 1959 (%)
Year house built - Built 1940 to 1949 (%)
Year house built - Built 1939 or earlier (%)
Median number of rooms in houses and condos
Median number of rooms in apartments
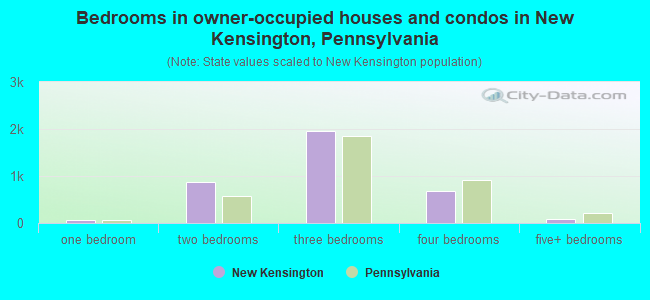
Median number of bedrooms in owner occupied houses
Mean number of bedrooms in owner occupied houses
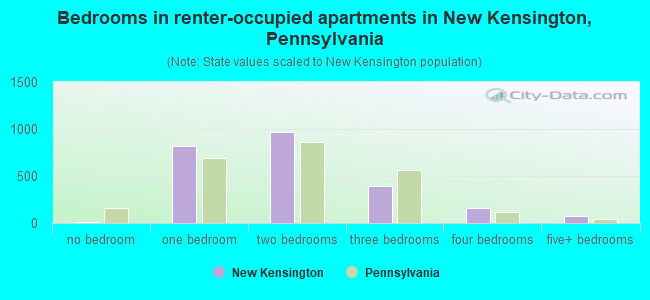
Median number of bedrooms in renter occupied houses
Mean number of bedrooms in renter occupied houses
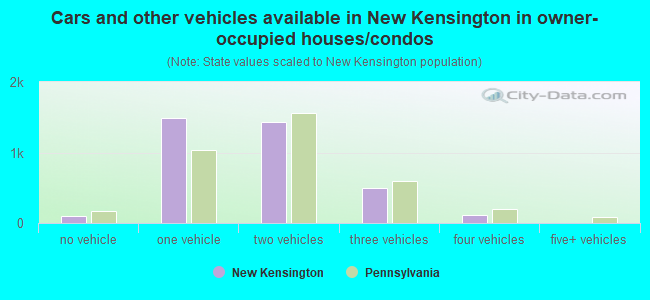
Median number of vehichles in owner occupied houses
Mean number of vehichles in owner occupied houses
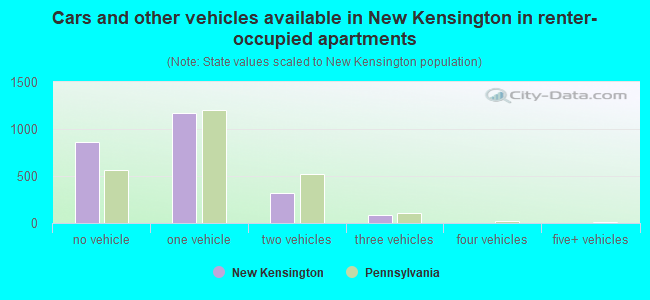
Median number of vehichles in renter occupied houses
Mean number of vehichles in renter occupied houses
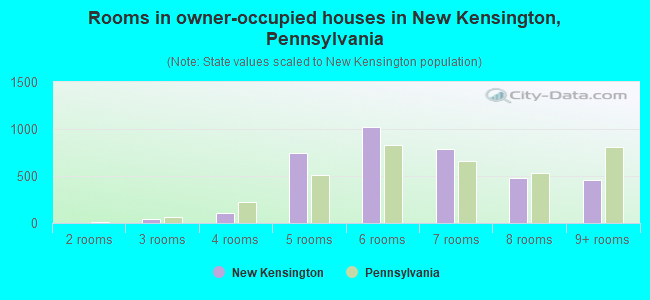
Rooms in owner-occupied houses - 1 room (%)
Rooms in owner-occupied houses - 2 rooms (%)
Rooms in owner-occupied houses - 3 rooms (%)
Rooms in owner-occupied houses - 4 rooms (%)
Rooms in owner-occupied houses - 5 rooms (%)
Rooms in owner-occupied houses - 6 rooms (%)
Rooms in owner-occupied houses - 7 rooms (%)
Rooms in owner-occupied houses - 8 rooms (%)
Rooms in owner-occupied houses - 9+ rooms (%)
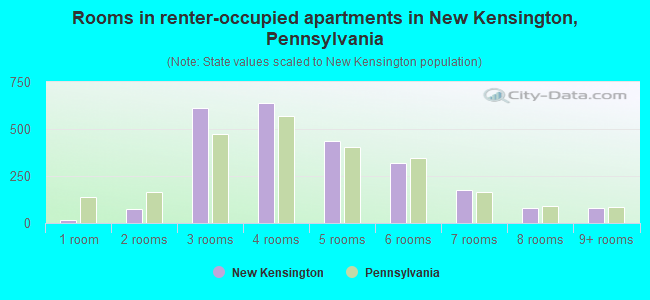
Rooms in renter-occupied houses - 1 room (%)
Rooms in renter-occupied houses - 2 rooms (%)
Rooms in renter-occupied houses - 3 rooms (%)
Rooms in renter-occupied houses - 4 rooms (%)
Rooms in renter-occupied houses - 5 rooms (%)
Rooms in renter-occupied houses - 6 rooms (%)
Rooms in renter-occupied houses - 7 rooms (%)
Rooms in renter-occupied houses - 8 rooms (%)
Rooms in renter-occupied houses - 9+ rooms (%)
Bedrooms in owner-occupied houses - no bedrooms (%)
Bedrooms in owner-occupied houses - 1 bedroom (%)
Bedrooms in owner-occupied houses - 2 bedrooms (%)
Bedrooms in owner-occupied houses - 3 bedrooms (%)
Bedrooms in owner-occupied houses - 4 bedrooms (%)
Bedrooms in owner-occupied houses - 5+ bedrooms (%)
Bedrooms in renter-occupied houses - no bedrooms (%)
Bedrooms in renter-occupied houses - 1 bedroom (%)
Bedrooms in renter-occupied houses - 2 bedrooms (%)
Bedrooms in renter-occupied houses - 3 bedrooms (%)
Bedrooms in renter-occupied houses - 4 bedrooms (%)
Bedrooms in renter-occupied houses - 5+ bedrooms (%)
Vehicles available in owner-occupied houses - no vehicle available (%)
Vehicles available in owner-occupied houses - 1 vehicle available(%)
Vehicles available in owner-occupied houses - 2 Vehicles available (%)
Vehicles available in owner-occupied houses - 3 Vehicles available (%)
Vehicles available in owner-occupied houses - 4 Vehicles available (%)
Vehicles available in owner-occupied houses - 5+ Vehicles available (%)
Vehicles available in renter-occupied houses - no vehicle available (%)
Vehicles available in renter-occupied houses - 1 vehicle available (%)
Vehicles available in renter-occupied houses - 2 Vehicles available (%)
Vehicles available in renter-occupied houses - 3 Vehicles available (%)
Vehicles available in renter-occupied houses - 4 Vehicles available (%)
Vehicles available in renter-occupied houses - 5+ Vehicles available (%)
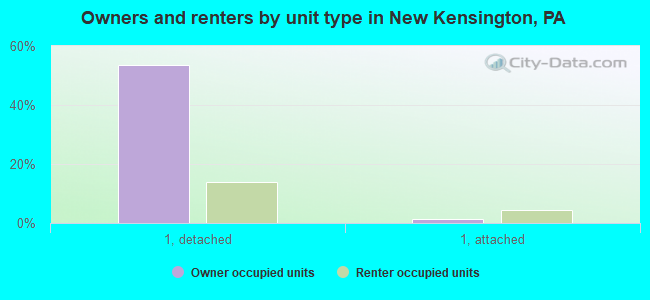
Housing units in structures - 1, detached (%)
Housing units in structures - 1, attached (%)
Housing units in structures - 2 (%)
Housing units in structures - 3 or 4 (%)
Housing units in structures - 5 to 9 (%)
Housing units in structures - 10 to 19 (%)
Housing units in structures - 20 to 49 (%)
Housing units in structures - 50 or more (%)
Housing units in structures - Mobile home (%)
Housing units in structures - Boat, RV, van, etc. (%)
Housing units in structures - Owners - 1, detached (%)
Housing units in structures - Owners - 1, attached (%)
Housing units in structures - Owners - 2 (%)
Housing units in structures - Owners - 3 or 4 (%)
Housing units in structures - Owners - 5 to 9 (%)
Housing units in structures - Owners - 10 to 19 (%)
Housing units in structures - Owners - 20 to 49 (%)
Housing units in structures - Owners - 50 or more (%)
Housing units in structures - Owners - Mobile home (%)
Housing units in structures - Owners - Boat, RV, van, etc. (%)
Housing units in structures - Renters - 1, detached (%)
Housing units in structures - Renters - 1, attached (%)
Housing units in structures - Renters - 2 (%)
Housing units in structures - Renters - 3 or 4 (%)
Housing units in structures - Renters - 5 to 9 (%)
Housing units in structures - Renters - 10 to 19 (%)
Housing units in structures - Renters - 20 to 49 (%)
Housing units in structures - Renters - 50 or more (%)
Housing units in structures - Renters - Mobile home (%)
Housing units in structures - Renters - Boat, RV, van, etc. (%)
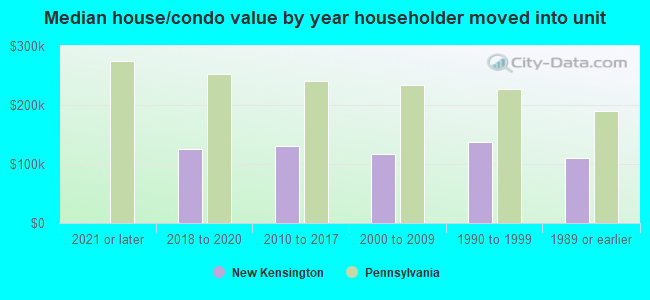
House/condo owner moved in on average (years ago)
Renter moved in on average (years ago)
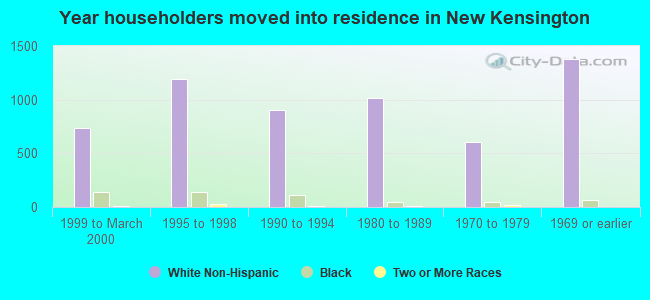
Year householder moved into unit - Moved in 1999 to March 2000 (%)
Year householder moved into unit - Moved in 1999 to March 2000 (%) - White
Year householder moved into unit - Moved in 1999 to March 2000 (%) - Black or African American
Year householder moved into unit - Moved in 1999 to March 2000 (%) - Asian
Year householder moved into unit - Moved in 1999 to March 2000 (%) - Hispanic or Latino
Year householder moved into unit - Moved in 1999 to March 2000 (%) - American Indian and Alaska Native
Year householder moved into unit - Moved in 1999 to March 2000 (%) - Multirace
Year householder moved into unit - Moved in 1999 to March 2000 (%) - Other Race
Year householder moved into unit - Moved in 1995 to 1998 (%)
Year householder moved into unit - Moved in 1995 to 1998 (%) - White
Year householder moved into unit - Moved in 1995 to 1998 (%) - Black or African American
Year householder moved into unit - Moved in 1995 to 1998 (%) - Asian
Year householder moved into unit - Moved in 1995 to 1998 (%) - Hispanic or Latino
Year householder moved into unit - Moved in 1995 to 1998 (%) - American Indian and Alaska Native
Year householder moved into unit - Moved in 1995 to 1998 (%) - Multirace
Year householder moved into unit - Moved in 1995 to 1998 (%) - Other Race
Year householder moved into unit - Moved in 1990 to 1994 (%)
Year householder moved into unit - Moved in 1990 to 1994 (%) - White
Year householder moved into unit - Moved in 1990 to 1994 (%) - Black or African American
Year householder moved into unit - Moved in 1990 to 1994 (%) - Asian
Year householder moved into unit - Moved in 1990 to 1994 (%) - Hispanic or Latino
Year householder moved into unit - Moved in 1990 to 1994 (%) - American Indian and Alaska Native
Year householder moved into unit - Moved in 1990 to 1994 (%) - Multirace
Year householder moved into unit - Moved in 1990 to 1994 (%) - Other Race
Year householder moved into unit - Moved in 1980 to 1989 (%)
Year householder moved into unit - Moved in 1980 to 1989 (%) - White
Year householder moved into unit - Moved in 1980 to 1989 (%) - Black or African American
Year householder moved into unit - Moved in 1980 to 1989 (%) - Asian
Year householder moved into unit - Moved in 1980 to 1989 (%) - Hispanic or Latino
Year householder moved into unit - Moved in 1980 to 1989 (%) - American Indian and Alaska Native
Year householder moved into unit - Moved in 1980 to 1989 (%) - Multirace
Year householder moved into unit - Moved in 1980 to 1989 (%) - Other Race
Year householder moved into unit - Moved in 1970 to 1979 (%)
Year householder moved into unit - Moved in 1970 to 1979 (%) - White
Year householder moved into unit - Moved in 1970 to 1979 (%) - Black or African American
Year householder moved into unit - Moved in 1970 to 1979 (%) - Asian
Year householder moved into unit - Moved in 1970 to 1979 (%) - Hispanic or Latino
Year householder moved into unit - Moved in 1970 to 1979 (%) - American Indian and Alaska Native
Year householder moved into unit - Moved in 1970 to 1979 (%) - Multirace
Year householder moved into unit - Moved in 1970 to 1979 (%) - Other Race
Year householder moved into unit - Moved in 1969 or earlier (%)
Year householder moved into unit - Moved in 1969 or earlier (%) - White
Year householder moved into unit - Moved in 1969 or earlier (%) - Black or African American
Year householder moved into unit - Moved in 1969 or earlier (%) - Asian
Year householder moved into unit - Moved in 1969 or earlier (%) - Hispanic or Latino
Year householder moved into unit - Moved in 1969 or earlier (%) - American Indian and Alaska Native
Year householder moved into unit - Moved in 1969 or earlier (%) - Multirace
Year householder moved into unit - Moved in 1969 or earlier (%) - Other Race
Housing units lacking complete plumbing facilities (%)
Housing units lacking complete kitchen facilities (%)
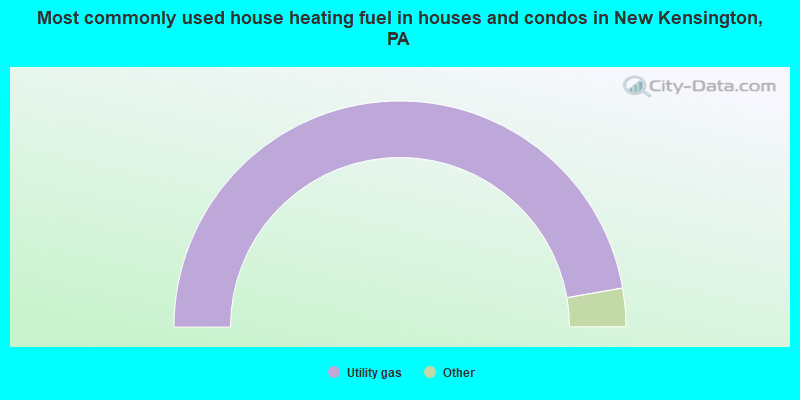
House heating fuel used in houses and condos - Utility gas (%)
House heating fuel used in houses and condos - Bottled, tank, or LP gas (%)
House heating fuel used in houses and condos - Electricity (%)
House heating fuel used in houses and condos - Fuel oil, kerosene, etc. (%)
House heating fuel used in houses and condos - Coal or coke (%)
House heating fuel used in houses and condos - Wood (%)
House heating fuel used in houses and condos - Solar energy (%)
House heating fuel used in houses and condos - Other fuel (%)
House heating fuel used in houses and condos - No fuel used (%)
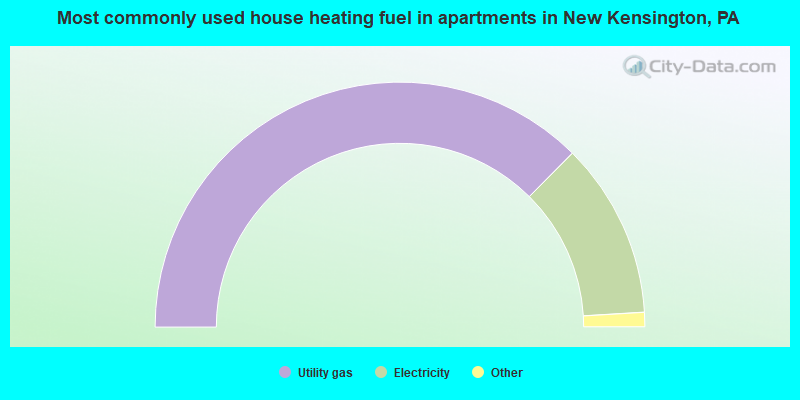
House heating fuel used in apartments - Utility gas (%)
House heating fuel used in apartments - Bottled, tank, or LP gas (%)
House heating fuel used in apartments - Electricity (%)
House heating fuel used in apartments - Fuel oil, kerosene, etc. (%)
House heating fuel used in apartments - Coal or coke (%)
House heating fuel used in apartments - Wood (%)
House heating fuel used in apartments - Solar energy (%)
House heating fuel used in apartments - Other fuel (%)
House heating fuel used in apartments - No fuel used (%)
Median year house/condo built: 1951Median year apartment built: 1964Household type by relationship:
Households: 12,082
Male householders: 3,054 (1,452 living alone ), Female householders: 2,869 (1,012 living alone )2,039 spouses (2,008 opposite-sex spouses ), 460 unmarried partners , (456 opposite-sex unmarried partners ), 2,452 children (2,237 natural , 20 adopted , 194 stepchildren ), 499 grandchildren , 76 brothers or sisters , 76 parents , 23 foster children , 165 other relatives , 352 non-relatives In group quarters: 9
Size of family households: 1,822 2-persons , 692 3-persons , 301 4-persons , 192 5-persons , 69 6-persons , 75 7-or-more-persons .
Size of nonfamily households: 2,404 1-person , 490 2-persons , 9 3-persons , 6 4-persons , 16 5-persons .
964 married couples with children. single-parent households (290 men , 399 women ).
95.8% of residents of New Kensington speak English at home. of residents speak Spanish at home (53% speak English very well , 47% speak English well ).of residents speak other Indo-European language at home (73% speak English very well , 18% speak English well , 9% speak English not well ).of residents speak Asian or Pacific Island language at home (50% speak English very well , 9% speak English well , 18% speak English not well , 23% don't speak English at all ).
Foreign born population: 255 (2.1%)of them are naturalized citizens )
Median number of rooms in houses and condos:
Median number of rooms in apartments
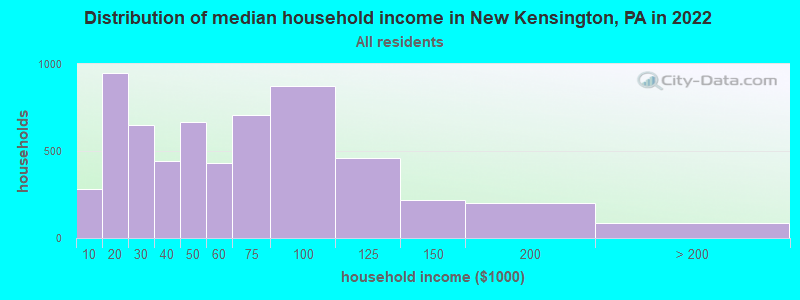
New Kensington, PA household income distribution 284 Less than $10,000950 $10,000 to $19,999649 $20,000 to $29,999443 $30,000 to $39,999669 $40,000 to $49,999433 $50,000 to $59,999709 $60,000 to $74,999871 $75,000 to $99,999461 $100,000 to $124,999219 $125,000 to $149,999200 $150,000 to $199,99989 $200,000 or more
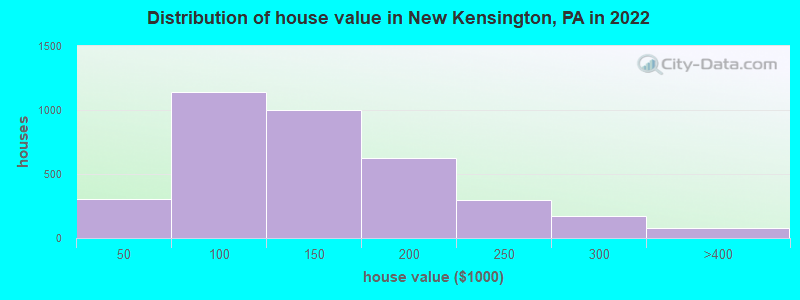
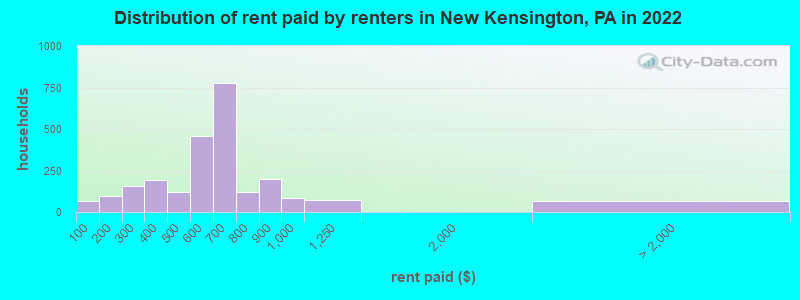
Home value of owner - occupied houses in 2022 in New Kensington, PA 45 Less than $10,00036 $10,000 to $14,9994 $15,000 to $19,99942 $20,000 to $24,99936 $25,000 to $29,99924 $30,000 to $34,99915 $35,000 to $39,99999 $40,000 to $49,999116 $50,000 to $59,999192 $60,000 to $69,999196 $70,000 to $79,999384 $80,000 to $89,999148 $90,000 to $99,999583 $100,000 to $124,999414 $125,000 to $149,999385 $150,000 to $174,999242 $175,000 to $199,999300 $200,000 to $249,999172 $250,000 to $299,99964 $300,000 to $399,99914 $750,000 to $999,999Rent paid by renters in 2022 in New Kensington, PA 65 Less than $1007 $100 to $14990 $150 to $1997 $200 to $249151 $250 to $29988 $300 to $349101 $350 to $39992 $400 to $44926 $450 to $499397 $500 to $54961 $550 to $599187 $600 to $649593 $650 to $69977 $700 to $74944 $750 to $799201 $800 to $89982 $900 to $99974 $1,000 to $1,2494 $2,000 to $2,49963 No cash rent
Percentage of workers working in this county: 46.2%Number of people working at home: 661 (12.5% of all workers )
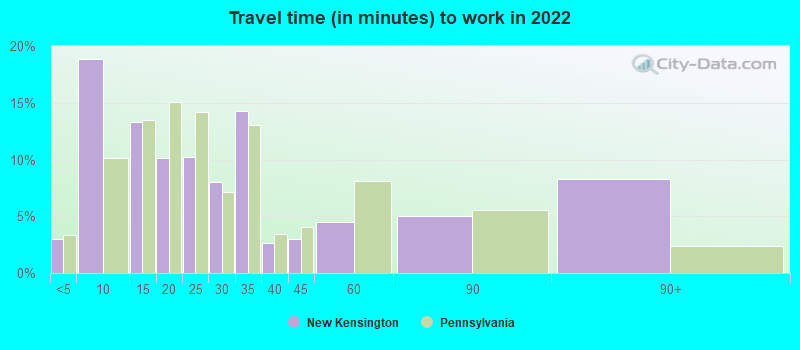
Travel time to work (commute)
Less than 5 minutes: 845 to 9 minutes: 64310 to 14 minutes: 39315 to 19 minutes: 67120 to 24 minutes: 56625 to 29 minutes: 46830 to 34 minutes: 45135 to 39 minutes: 28140 to 44 minutes: 37945 to 59 minutes: 34160 to 89 minutes: 17790 or more minutes: 160
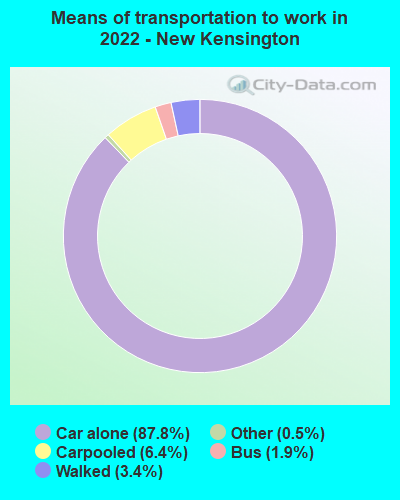
Means of transportation to work:
Drove a car alone: 3,388 (74.3%)Carpooled: 260 (5.7%)Bus : 153 (3.4%)Taxi: 16 (0.4%)Walked: 153 (3.4%)Worked at home: 661 (14.5%)
Unemployment by race in 2022
Unemployment rate for White non-Hispanic residents 7.0% Males1.1% FemalesUnemployment rate for Black residents 9.8% Males20.9% Females
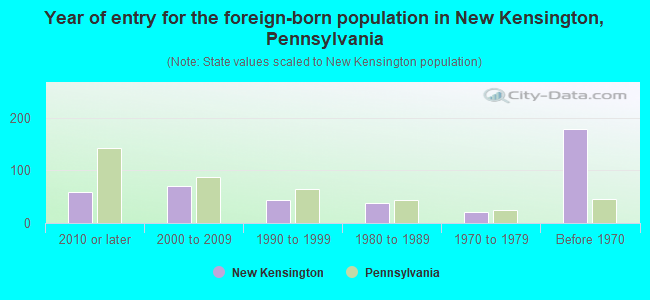
Year of entry for the foreign-born population in New Kensington, Pennsylvania
59 2010 or later 71 2000 to 2009 43 1990 to 1999 38 1980 to 1989 21 1970 to 1979 179 Before 1970
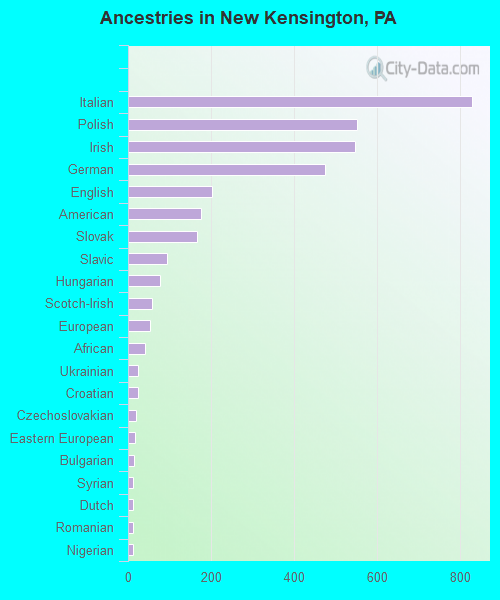
First ancestries reported:
Italian: 828 (17.8%)
Polish: 551 (11.9%)
Irish: 547 (11.8%)
German: 474 (10.2%)
English: 203 (4.4%)
American: 175 (3.8%)
Slovak: 167 (3.6%)
Slavic: 93 (2.0%)
Hungarian: 76 (1.6%)
Scotch-Irish: 58 (1.2%)
European: 53 (1.1%)
African: 41 (0.9%)
Ukrainian: 25 (0.5%)
Croatian: 23 (0.5%)
Czechoslovakian: 20 (0.4%)
Eastern European: 18 (0.4%)
Bulgarian: 14 (0.3%)
Syrian: 11 (0.2%)
Dutch: 11 (0.2%)
Romanian: 11 (0.2%)
Nigerian: 11 (0.2%)
Arab: 7 (0.2%)
Pennsylvania German: 7 (0.2%)
French: 6 (0.1%)
Russian: 6 (0.1%)
Swedish: 5 (0.1%)
Lithuanian: 4 (0.09%)
British: 3 (0.06%) Most common places of birth for foreign-born residents (%): China, excluding Hong Kong and Taiwan New Kensington:
47.9% (115)Pennsylvania:
7.2% (67,704)
Dominican Republic New Kensington:
23.8% (57)Pennsylvania:
9.2% (86,544)
Czechoslovakia (includes Czech Republic and Slovakia) New Kensington:
6.2% (15)Pennsylvania:
0.2% (1,916)
Romania New Kensington:
5.4% (13)Pennsylvania:
0.6% (5,598)
Germany New Kensington:
3.8% (9)Pennsylvania:
1.9% (18,065)
Italy New Kensington:
3.3% (8)Pennsylvania:
1.8% (16,884)
Poland New Kensington:
3.3% (8)Pennsylvania:
1.3% (12,172)
Russia New Kensington:
2.9% (7)Pennsylvania:
1.6% (15,272)
Spain New Kensington:
2.1% (5)Pennsylvania:
0.3% (2,635)
Place of birth for U.S.-born residents:
This state: 10,267Other state: 1,492Northeast: 427Midwest: 223South: 694West: 158 87.8% of New Kensington residents lived in the same house 1 years ago.
Out of people who lived in different houses, 40.9% lived in this county.
Out of people who lived in different counties, 89.2% lived in Pennsylvania.
New Kensington:
87.8%State average:
89.3%
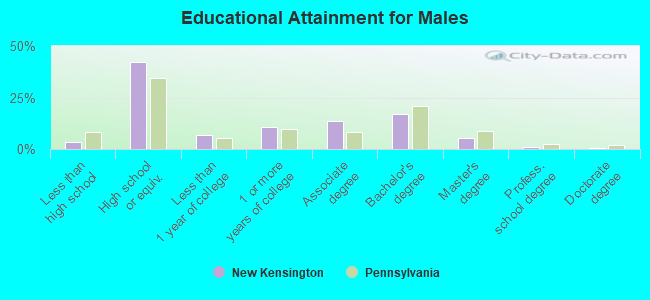
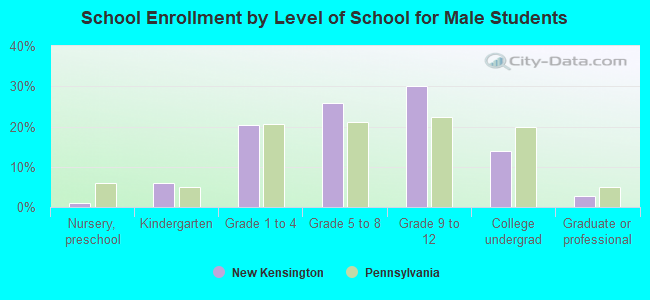
Education attainment for males 25 years and older:
No schooling: 42Nursery to 4th grade: 15th and 6th grade: 07th and 8th grade: 79th grade: 2210th grade: 4911th grade: 612th grade, no diploma: 38High school graduate (or equivalency): 1,943Less than 1 year of college: 306Some college more than 1 year, no degree: 492Associate degree: 614Bachelor's degree: 783Master's degree: 235Professional school degree: 39Doctorate degree: 12
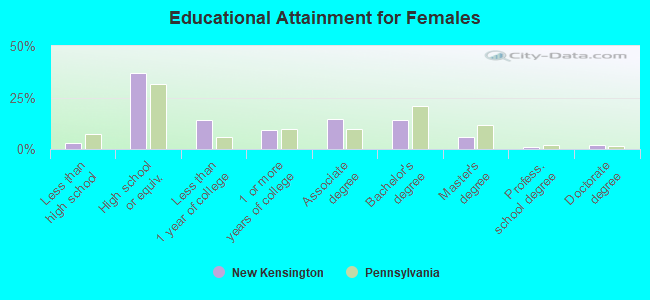
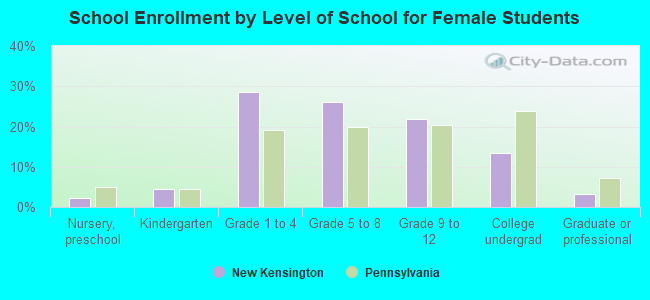
Education attainment for females 25 years and older:
No schooling: 44Nursery to 4th grade: 75th and 6th grade: 07th and 8th grade: 89th grade: 810th grade: 011th grade: 3412th grade, no diploma: 21High school graduate (or equivalency): 1,626Less than 1 year of college: 632Some college more than 1 year, no degree: 407Associate degree: 655Bachelor's degree: 615Master's degree: 262Professional school degree: 34Doctorate degree: 77
Housing units in structures:
One, detached: 4,607One, attached: 530Two: 3833 or 4: 4485 to 9: 31310 to 19: 24320 to 49: 15650 or more: 364Mobile homes: 23Boats, RVs, vans, etc.: 5Median worth of mobile homes: $142,326
Housing units lacking complete plumbing facilities in 2022: 4.1%Housing units lacking complete kitchen facilities in 2022: 6.0%House/condo owner moved in on average 18 years ago
Renter moved in on average 2 years ago
Private vs. public school enrollment:
Students in private schools in grades 1 to 8 (elementary and middle school): 116 Here:
12.4%Pennsylvania:
15.7%
Students in private schools in grades 9 to 12 (high school): 48 Here:
9.8%Pennsylvania:
13.4%
Students in private undergraduate colleges: 47 Here:
18.7%Pennsylvania:
39.8%