New Carrollton, MD (Maryland) Houses and Residents
| New Carrollton: | $378,519 |
| Maryland: | $398,100 |
Mean price in 2022:
Detached houses: $350,378
Here: $350,378 State: $526,819 In 5-or-more-unit structures: $155,071
Here: $155,071 State: $350,378
Total population: 12,708 (All urban)
Houses: 5,000 (4,811 occupied: 2,331 owner occupied, 2,502 renter occupied)
| % of renters here: | 52% |
| State: | 32% |
Housing density: 3,292 houses/condos per square mile
Median price asked for vacant for-sale houses and condos in 2022: $599,296.
Median contract rent in 2022: $1,545 (lower quartile is $1,219, upper quartile is $1,843)
Median rent asked for vacant for-rent units in 2022: $2,008
Median gross rent in New Carrollton, MD in 2022: $1,623
Housing units in New Carrollton with a mortgage: 1,681 (93 second mortgage, 0 home equity loan, 72 both second mortgage and home equity loan)
Houses without a mortgage: 48
Median household income for houses/condos with a mortgage: $102,967
Median household income for apartments without a mortgage: $79,833
Median monthly housing costs: $1,611
Compare current foreclosures near New Carrollton, MD:
| Photo | Address | Area | Beds / Baths | Price | Details |
|---|---|---|---|---|---|

|
#1
Fitzgibbon Ct
Bowie, MD 20721
|
1,300 sq. feet
|
2 baths 3 beds |
$369,200
|
show details |

|
#2
Eastern Ave NE
Washington, DC 20011
|
1,024 sq. feet
|
1 baths 3 beds |
$395,000
|
show details |

|
#3
Hammersmith Cir
Silver Spring, MD 20906
|
1,152 sq. feet
|
1 baths 3 beds |
$353,600
|
show details |

|
#4
Pooks Hill Rd Apt 1612s
Bethesda, MD 20814
|
1,250 sq. feet
|
1 baths 2 beds |
$289,000
|
show details |

|
#5
Mandan Rd Apt 103 Unit 621
Greenbelt, MD 20770
|
1,420 sq. feet
|
2 baths 3 beds |
$179,900
|
show details |

|
#6
Cathedral Ave NW Apt 108
Washington, DC 20016
|
765 sq. feet
|
1 baths 1 beds |
$269,900
|
show details |

|
#7
Interlachen Dr Apt 111
Silver Spring, MD 20906
|
965 sq. feet
|
1 baths 2 beds |
$148,000
|
show details |

|
#8
Gladys Retreat Cir
Bowie, MD 20720
|
2,880 sq. feet
|
3 baths 3 beds |
$409,900
|
show details |

|
#9
Rolling Meadows Rd
Upper Marlboro, MD 20772
|
2,459 sq. feet
|
2 baths 3 beds |
$405,000
|
show details |

|
#10
Carousel Ct
Upper Marlboro, MD 20772
|
2,112 sq. feet
|
2 baths 3 beds |
$385,000
|
show details |
| Photo | Address | Area | Beds / Baths | Price | Details |
|---|---|---|---|---|---|

|
#11
9th St NW
Washington, DC 20011
|
1,604 sq. feet
|
2 baths 3 beds |
$598,000
|
show details |

|
#12
Elkhorn Ln
Bowie, MD 20716
|
1,514 sq. feet
|
2 baths 3 beds |
$415,000
|
show details |

|
#13
Monroe St NW
Washington, DC 20010
|
- sq. feet
|
2 baths 2 beds |
$665,000
|
show details |

|
#14
Henson Ln
Temple Hills, MD 20748
|
1,566 sq. feet
|
2 baths 3 beds |
$300,000
|
show details |

|
#15
Addison Rd
Capitol Heights, MD 20743
|
1,400 sq. feet
|
1 baths 3 beds |
$260,000
|
show details |

|
#16
19th St NW
Washington, DC 20036
|
2,515 sq. feet
|
6 baths 8 beds |
$1,684,800
|
show details |

|
#17
Pickett Dr
Suitland, MD 20746
|
1,296 sq. feet
|
1 baths 2 beds |
$335,000
|
show details |

|
#18
17th St NW Apt 504
Washington, DC 20009
|
800 sq. feet
|
1 baths 1 beds |
$405,000
|
show details |

|
#19
Ensleigh Ln
Bowie, MD 20716
|
1,656 sq. feet
|
2 baths 3 beds |
$374,900
|
show details |

|
#20
Heming Ln
Bowie, MD 20716
|
1,800 sq. feet
|
2 baths 3 beds |
$400,000
|
show details |
| Photo | Address | Area | Beds / Baths | Price | Details |
|---|---|---|---|---|---|

|
#21
Applegarth Pl
Capitol Heights, MD 20743
|
1,200 sq. feet
|
1 baths 3 beds |
$314,900
|
show details |

|
#22
T St SE Apt 3
Washington, DC 20020
|
- sq. feet
|
2 baths 4 beds |
$307,500
|
show details |

|
#23
Wilson Bridge Dr Unit #6770 A-2
Oxon Hill, MD 20745
|
- sq. feet
|
1 baths 1 beds |
$99,750
|
show details |

|
#24
Delaware Ave SW Apt N720
Washington, DC 20024
|
- sq. feet
|
1 baths 1 beds |
$149,900
|
show details |

|
#25
Brooke Ln
Upper Marlboro, MD 20772
|
- sq. feet
|
5 baths 6 beds |
$949,000
|
show details |

|
#26
Holbrook Ter NE
Washington, DC 20002
|
3,164 sq. feet
|
4 baths 8 beds |
show details | |

|
#27
Oakwood St SE Apt B5
Washington, DC 20032
|
628 sq. feet
|
1 baths 1 beds |
show details | |

|
#28
Scaffold Way
Odenton, MD 21113
|
1,664 sq. feet
|
4 baths 4 beds |
show details | |

|
#29
N Royal St
Alexandria, VA 22314
|
- sq. feet
|
1 baths 1 beds |
show details | |

|
#30
Brooke Rd
Sandy Spring, MD 20860
|
5,046 sq. feet
|
4 baths 4 beds |
show details |
| Photo | Address | Area | Beds / Baths | Price | Details |
|---|---|---|---|---|---|

|
#31
Kipling Pkwy
District Heights, MD 20747
|
1,680 sq. feet
|
1 baths 3 beds |
show details | |

|
#32
Trenton Pl SE
Washington, DC 20032
|
1,872 sq. feet
|
3 baths 4 beds |
show details | |

|
#33
Navahoe St
Hyattsville, MD 20783
|
1,068 sq. feet
|
2 baths 3 beds |
show details | |

|
#34
Avena St
Silver Spring, MD 20902
|
1,188 sq. feet
|
2 baths 3 beds |
show details | |

|
#35
Carrollsburg Pl SW
Washington, DC 20024
|
1,720 sq. feet
|
2 baths 3 beds |
show details | |

|
#36
Lumar Dr
Fort Washington, MD 20744
|
1,920 sq. feet
|
5 baths 5 beds |
show details | |

|
#37
Coronella Ct
Upper Marlboro, MD 20774
|
3,386 sq. feet
|
6 baths 6 beds |
show details | |

|
#38
Softwater Way
Columbia, MD 21046
|
1,520 sq. feet
|
3 baths 4 beds |
show details | |

|
#39
Wahler Pl SE
Washington, DC 20032
|
1,364 sq. feet
|
2 baths 3 beds |
show details | |

|
#40
Deanwood Dr
Capitol Heights, MD 20743
|
640 sq. feet
|
1 baths 1 beds |
show details |
| Photo | Address | Area | Beds / Baths | Price | Details |
|---|---|---|---|---|---|

|
#41
Hill Way
Suitland, MD 20746
|
1,539 sq. feet
|
2 baths 4 beds |
show details | |

|
#42
Anacostia Rd SE
Washington, DC 20019
|
1,008 sq. feet
|
2 baths 4 beds |
show details | |

|
#43
Sutton Ln
Bowie, MD 20720
|
2,132 sq. feet
|
3 baths 3 beds |
show details | |

|
#44
Forest Run Dr # B
District Heights, MD 20747
|
2,267 sq. feet
|
3 baths 3 beds |
show details | |

|
#45
Connecticut Ave NW Apt 606
Washington, DC 20008
|
160 sq. feet
|
1 baths 1 beds |
show details | |

|
#46
28th St SE
Washington, DC 20020
|
1,200 sq. feet
|
3 baths 3 beds |
show details | |

|
#47
Byers St
Capitol Heights, MD 20743
|
2,238 sq. feet
|
2 baths 2 beds |
show details | |

|
#48
New York Ave NW Apt 402
Washington, DC 20001
|
842 sq. feet
|
1 baths 2 beds |
show details | |

|
#49
16th St NW Apt 305
Washington, DC 20009
|
1,158 sq. feet
|
1 baths 2 beds |
show details | |

|
Check over 1 million property listings on Foreclosure.com!
|
browse all offers | |||


Median year apartment built: 1968
Household type by relationship:
Households: 13,435- Male householders: 2,398 (726 living alone), Female householders: 2,299 (772 living alone)
1,776 spouses (1,756 opposite-sex spouses), 319 unmarried partners, (319 opposite-sex unmarried partners), 4,240 children (4,135 natural, 50 adopted, 54 stepchildren), 239 grandchildren, 563 brothers or sisters, 180 parents, 0 foster children, 660 other relatives, 737 non-relatives
- In group quarters: 19
Size of family households: 908 2-persons, 568 3-persons, 671 4-persons, 326 5-persons, 185 6-persons, 293 7-or-more-persons.
Size of nonfamily households: 1,475 1-person, 341 2-persons, 25 3-persons, 7 4-persons.
1,927 married couples with children.
818 single-parent households (313 men, 505 women).
54.7% of residents of New Carrollton speak English at home.
23.0% of residents speak Spanish at home (44% speak English very well, 23% speak English well, 30% speak English not well, 3% don't speak English at all).
9.5% of residents speak other Indo-European language at home (85% speak English very well, 12% speak English well, 4% speak English not well).
1.6% of residents speak Asian or Pacific Island language at home (61% speak English very well, 33% speak English well, 6% speak English not well).
14.9% of residents speak other language at home (79% speak English very well, 17% speak English well, 4% speak English not well).
Foreign born population: 5,726 (42.6%)
(45.5% of them are naturalized citizens)
| Here: | 7.0 |
| State: | 7.3 |
| Here: | 4.0 |
| State: | 4.2 |

- Bedrooms in owner-occupied houses and condos in New Carrollton, Maryland
- 8no bedroom
- 711 bedroom
- 1502 bedrooms
- 9073 bedrooms
- 7424 bedrooms
- 4535+ bedrooms

- Bedrooms in renter-occupied apartments in New Carrollton, Maryland
- 72no bedroom
- 8841 bedroom
- 1,1212 bedrooms
- 4053 bedrooms
- 204 bedrooms
- 05+ bedrooms

- Cars and other vehicles available in New Carrollton in owner-occupied houses/condos
- 87no vehicle
- 5911 vehicle
- 9542 vehicles
- 4203 vehicles
- 2014 vehicles
- 785+ vehicles

- Cars and other vehicles available in New Carrollton in renter-occupied apartments
- 462no vehicle
- 1,2931 vehicle
- 6832 vehicles
- 403 vehicles
- 244 vehicles
- 05+ vehicles

- Rooms in owner-occupied houses in New Carrollton, Maryland
- 81 room
- 212 rooms
- 03 rooms
- 1084 rooms
- 2645 rooms
- 5676 rooms
- 2957 rooms
- 5878 rooms
- 4819+ rooms

- Rooms in renter-occupied apartments in New Carrollton, Maryland
- 721 room
- 2082 rooms
- 4963 rooms
- 1,0364 rooms
- 4085 rooms
- 2206 rooms
- 347 rooms
- 08 rooms
- 299+ rooms


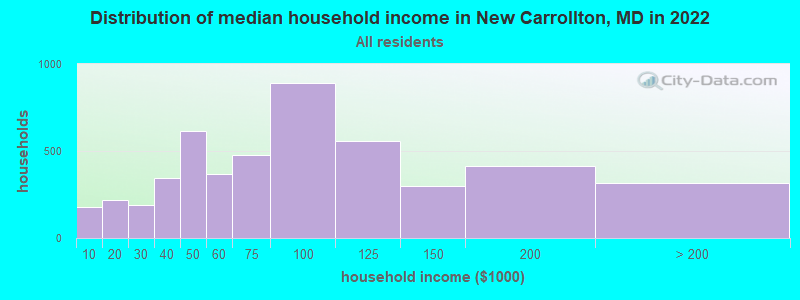
New Carrollton, MD household income distribution

- 176Less than $10,000
- 220$10,000 to $19,999
- 189$20,000 to $29,999
- 347$30,000 to $39,999
- 615$40,000 to $49,999
- 370$50,000 to $59,999
- 479$60,000 to $74,999
- 889$75,000 to $99,999
- 558$100,000 to $124,999
- 297$125,000 to $149,999
- 414$150,000 to $199,999
- 316$200,000 or more
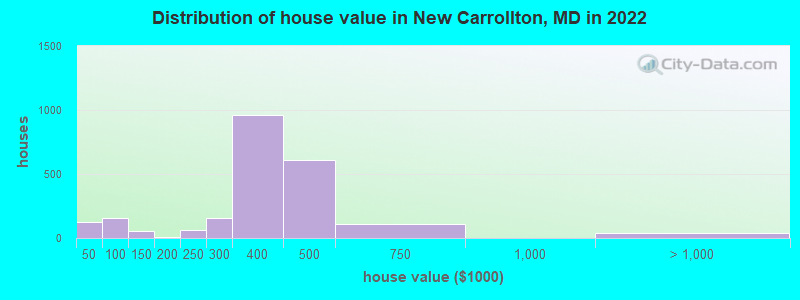
Home value of owner - occupied houses in 2022 in New Carrollton, MD
-
- 59Less than $10,000
- 2$20,000 to $24,999
- 14$25,000 to $29,999
- 16$30,000 to $34,999
- 28$40,000 to $49,999
- 13$50,000 to $59,999
- 114$90,000 to $99,999
- 55$100,000 to $124,999
- 8$175,000 to $199,999
- 60$200,000 to $249,999
- 160$250,000 to $299,999
- 961$300,000 to $399,999
- 605$400,000 to $499,999
- 113$500,000 to $749,999
- 20$1,000,000 to $1,499,999
- 16$2,000,000 or more
Rent paid by renters in 2022 in New Carrollton, MD
-
- 14$250 to $299
- 4$450 to $499
- 64$500 to $549
- 19$550 to $599
- 14$700 to $749
- 21$750 to $799
- 10$800 to $899
- 143$900 to $999
- 414$1,000 to $1,249
- 388$1,250 to $1,499
- 1,076$1,500 to $1,999
- 316$2,000 to $2,499
- 3$2,500 to $2,999
- 14No cash rent


Percentage of workers working in this county: 57.8%
Number of people working at home: 783 (12.2% of all workers)
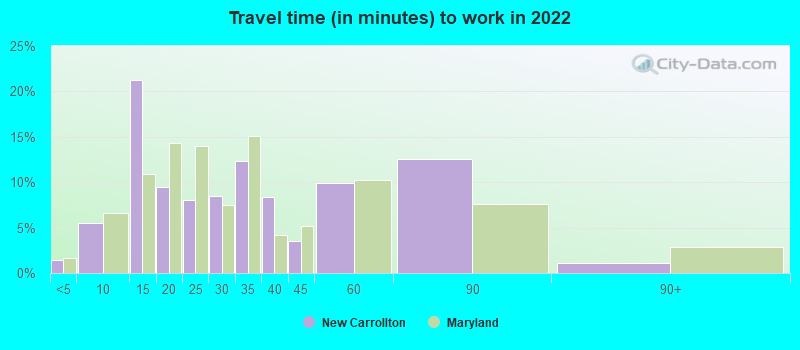
Travel time to work (commute)
- Less than 5 minutes: 35
- 5 to 9 minutes: 219
- 10 to 14 minutes: 696
- 15 to 19 minutes: 878
- 20 to 24 minutes: 406
- 25 to 29 minutes: 400
- 30 to 34 minutes: 1,023
- 35 to 39 minutes: 182
- 40 to 44 minutes: 320
- 45 to 59 minutes: 1,039
- 60 to 89 minutes: 236
- 90 or more minutes: 221
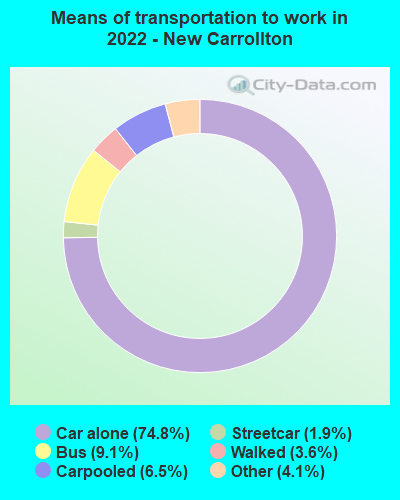
Means of transportation to work:
- Drove a car alone: 2,289 (59.9%)
- Carpooled: 181 (4.7%)
- Bus: 198 (5.2%)
- Subway or elevated rail: 39 (1.0%)
- Taxi: 161 (4.2%)
- Walked: 110 (2.9%)
- Worked at home: 783 (20.5%)

- Unemployment by race in 2022
- Unemployment rate for White non-Hispanic residents
- 0.3%Males
- 14.2%Females
- Unemployment rate for Black residents
- 15.4%Males
- 8.9%Females
- Unemployment rate for Asian residents
- 17.1%Females
- Unemployment rate for other race residents
- 0.6%Males
- 8.4%Females
- Unemployment rate for Hispanic or Latino residents
- 0.5%Males
- 5.7%Females

- Year of entry for the foreign-born population in New Carrollton, Maryland
- 2,6932010 or later
- 1,3242000 to 2009
- 8631990 to 1999
- 8031980 to 1989
- 4071970 to 1979
- 114Before 1970
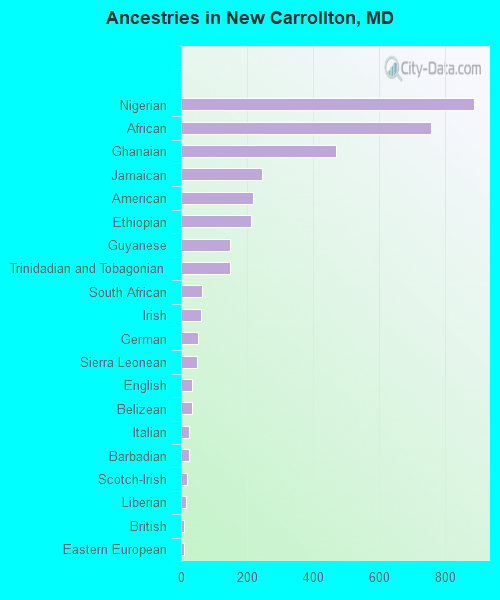
First ancestries reported:
- Nigerian: 888 (9.5%)
- African: 757 (8.1%)
- Ghanaian: 470 (5.0%)
- Jamaican: 245 (2.6%)
- American: 218 (2.3%)
- Ethiopian: 212 (2.3%)
- Guyanese: 149 (1.6%)
- Trinidadian and Tobagonian: 149 (1.6%)
- South African: 65 (0.7%)
- Irish: 61 (0.7%)
- German: 52 (0.6%)
- Sierra Leonean: 47 (0.5%)
- English: 32 (0.3%)
- Belizean: 32 (0.3%)
- Italian: 25 (0.3%)
- Barbadian: 25 (0.3%)
- Scotch-Irish: 17 (0.2%)
- Liberian: 16 (0.2%)
- British: 9 (0.10%)
- Eastern European: 9 (0.10%)
- Scandinavian: 8 (0.09%)
- Scottish: 8 (0.09%)
- Swedish: 7 (0.07%)
- Polish: 5 (0.05%)
- European: 3 (0.03%)
Most common places of birth for foreign-born residents (%):
| New Carrollton: | 22.0% (1,241) |
| Maryland: | 12.0% (115,412) |
| New Carrollton: | 19.1% (1,076) |
| Maryland: | 2.5% (23,969) |
| New Carrollton: | 13.5% (761) |
| Maryland: | 4.6% (44,825) |
| New Carrollton: | 6.5% (366) |
| Maryland: | 1.8% (17,774) |
| New Carrollton: | 5.3% (299) |
| Maryland: | 1.4% (13,947) |
| New Carrollton: | 4.4% (246) |
| Maryland: | 2.8% (27,444) |
| New Carrollton: | 3.4% (193) |
| Maryland: | 3.2% (30,870) |
| New Carrollton: | 3.4% (191) |
| Maryland: | 0.5% (4,689) |
| New Carrollton: | 3.3% (186) |
| Maryland: | 1.2% (11,481) |
| New Carrollton: | 2.7% (154) |
| Maryland: | 3.5% (34,065) |
| New Carrollton: | 2.3% (130) |
| Maryland: | 0.8% (8,109) |
| New Carrollton: | 2.2% (125) |
| Maryland: | 1.1% (10,233) |
| New Carrollton: | 2.1% (119) |
| Maryland: | 6.4% (61,725) |
| New Carrollton: | 1.6% (91) |
| Maryland: | 0.3% (3,203) |
Place of birth for U.S.-born residents:
- This state: 3,486
- Other state: 4,383
- Northeast: 603
- Midwest: 163
- South: 3,253
- West: 364
89.4% of New Carrollton residents lived in the same house 1 years ago.
Out of people who lived in different houses, 45.3% lived in this county.
Out of people who lived in different counties, 46.6% lived in Maryland.
| New Carrollton: | 89.4% |
| State average: | 88.5% |
Education attainment for males 25 years and older:
- No schooling: 95
- Nursery to 4th grade: 69
- 5th and 6th grade: 70
- 7th and 8th grade: 112
- 9th grade: 175
- 10th grade: 19
- 11th grade: 19
- 12th grade, no diploma: 113
- High school graduate (or equivalency): 1,287
- Less than 1 year of college: 154
- Some college more than 1 year, no degree: 555
- Associate degree: 390
- Bachelor's degree: 1,025
- Master's degree: 211
- Professional school degree: 66
- Doctorate degree: 52

Education attainment for females 25 years and older:
- No schooling: 131
- Nursery to 4th grade: 23
- 5th and 6th grade: 133
- 7th and 8th grade: 71
- 9th grade: 28
- 10th grade: 54
- 11th grade: 12
- 12th grade, no diploma: 129
- High school graduate (or equivalency): 1,485
- Less than 1 year of college: 317
- Some college more than 1 year, no degree: 799
- Associate degree: 298
- Bachelor's degree: 901
- Master's degree: 460
- Professional school degree: 10
- Doctorate degree: 12


Housing units in structures:
- One, detached: 2,291
- One, attached: 38
- Two: 104
- 3 or 4: 74
- 5 to 9: 707
- 10 to 19: 1,541
- 20 to 49: 89
- 50 or more: 103
- Mobile homes: 49
Housing units lacking complete kitchen facilities in 2022: 0.7%
House/condo owner moved in on average 20 years ago
Renter moved in on average 5 years ago

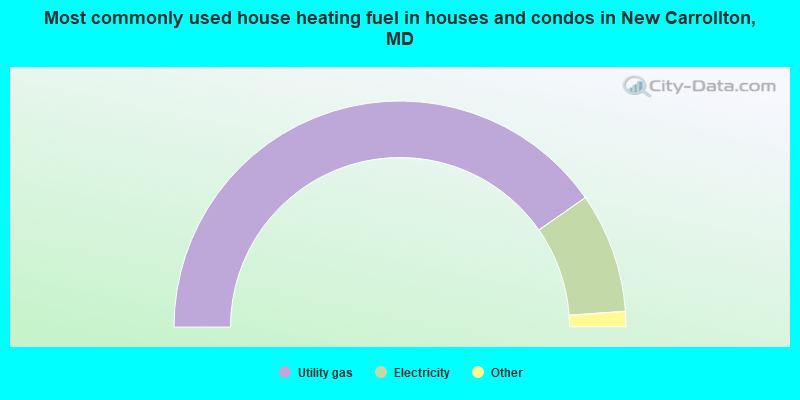
- 80.7%Utility gas
- 17.2%Electricity
- 1.1%Fuel oil, kerosene, etc.
- 1.0%Bottled, tank, or LP gas
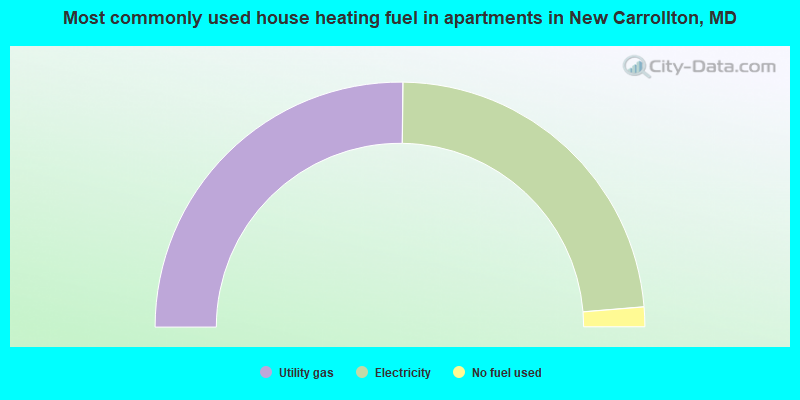
- 50.4%Utility gas
- 47.0%Electricity
- 2.6%No fuel used
Private vs. public school enrollment:
| Here: | 0.3% |
| Maryland: | 15.2% |
| Here: | 6.1% |
| Maryland: | 14.4% |
| Here: | 13.7% |
| Maryland: | 20.2% |


