New Brunswick, NJ (New Jersey) Houses and Residents
| New Brunswick: | $309,570 |
| New Jersey: | $428,900 |
Mean price in 2022:
Detached houses: $334,157
Here: $334,157 State: $537,591 Townhouses or other attached units: $263,821
Here: $263,821 State: $381,113 In 2-unit structures: $226,514
Here: $226,514 State: $444,476 In 3-to-4-unit structures: $328,534
Here: $328,534 State: $457,463 In 5-or-more-unit structures: $272,015
Here: $272,015 State: $368,745
Total population: 57,080 (Urban population: 48,573, Rural population: 0)
Houses: 17,022 (15,751 occupied: 3,208 owner occupied, 12,675 renter occupied)
| % of renters here: | 80% |
| State: | 35% |
Housing density: 3,257 houses/condos per square mile
Median price asked for vacant for-sale houses and condos in 2022: $238,054.
Median contract rent in 2022: $1,500 (lower quartile is $1,082, upper quartile is $1,902)
Median rent asked for vacant for-rent units in 2022: $2,567
Median gross rent in New Brunswick, NJ in 2022: $1,683
Housing units in New Brunswick with a mortgage: 2,025 (105 second mortgage, 23 home equity loan, 52 both second mortgage and home equity loan)
Houses without a mortgage: 28
Median household income for houses/condos with a mortgage: $109,034
Median household income for apartments without a mortgage: $60,543
Median monthly housing costs: $1,665
Compare current foreclosures in New Brunswick, NJ:
| Photo | Address | Area | Beds / Baths | Price | Details |
|---|---|---|---|---|---|

|
#1
Hazelhurst St
New Brunswick, NJ 08901
|
465 sq. feet
|
1 baths 1 beds |
$325,000
|
show details |

|
#2
Oliver Ave
New Brunswick, NJ 08901
|
1,800 sq. feet
|
- baths - beds |
show details | |

|
#3
Suydam St
New Brunswick, NJ 08901
|
- sq. feet
|
- baths - beds |
show details | |

|
#4
Pennington Rd
New Brunswick, NJ 08901
|
792 sq. feet
|
- baths - beds |
show details | |

|
#5
Remsen Ave
New Brunswick, NJ 08901
|
- sq. feet
|
- baths - beds |
show details | |

|
#6
Jersey Ave
New Brunswick, NJ 08901
|
- sq. feet
|
- baths - beds |
show details | |

|
#7
Epdas Rd
New Brunswick, NJ 08901
|
- sq. feet
|
- baths - beds |
show details | |

|
#8
Paul Robeson Blvd
New Brunswick, NJ 08901
|
1,092 sq. feet
|
- baths - beds |
show details | |

|
#9
Remsen Ave
New Brunswick, NJ 08901
|
880 sq. feet
|
- baths - beds |
show details | |

|
#10
Tunison Rd
New Brunswick, NJ 08901
|
1,296 sq. feet
|
- baths - beds |
show details |
| Photo | Address | Area | Beds / Baths | Price | Details |
|---|---|---|---|---|---|

|
#11
Commercial Ave
New Brunswick, NJ 08901
|
- sq. feet
|
- baths - beds |
show details | |

|
#12
Commercial Ave
New Brunswick, NJ 08901
|
1,092 sq. feet
|
- baths - beds |
show details | |

|
#13
Louis St
New Brunswick, NJ 08901
|
- sq. feet
|
- baths - beds |
show details | |

|
#14
George St
New Brunswick, NJ 08901
|
- sq. feet
|
- baths 2 beds |
show details | |

|
#15
Townsend St
New Brunswick, NJ 08901
|
- sq. feet
|
- baths - beds |
show details | |

|
#16
Brookside Ave
New Brunswick, NJ 08901
|
2,058 sq. feet
|
- baths - beds |
show details | |

|
#17
Seaman St
New Brunswick, NJ 08901
|
- sq. feet
|
- baths - beds |
show details | |

|
#18
Jersey Ave
New Brunswick, NJ 08901
|
- sq. feet
|
- baths - beds |
show details | |

|
#19
Manor Ct
New Brunswick, NJ 08901
|
- sq. feet
|
- baths - beds |
show details | |

|
#20
Remsen Ave
New Brunswick, NJ 08901
|
880 sq. feet
|
- baths - beds |
show details |
| Photo | Address | Area | Beds / Baths | Price | Details |
|---|---|---|---|---|---|

|
#21
Somerset St # 803
New Brunswick, NJ 08901
|
- sq. feet
|
- baths - beds |
show details | |

|
#22
Somerset St # 1207
New Brunswick, NJ 08901
|
- sq. feet
|
- baths - beds |
show details | |

|
#23
Sandford St
New Brunswick, NJ 08901
|
2,962 sq. feet
|
- baths - beds |
show details | |

|
#24
Stone St
New Brunswick, NJ 08901
|
- sq. feet
|
- baths - beds |
show details | |

|
#25
Baldwin St
New Brunswick, NJ 08901
|
1,102 sq. feet
|
- baths - beds |
show details | |

|
#26
High St
New Brunswick, NJ 08901
|
- sq. feet
|
- baths - beds |
show details | |

|
#27
Seaman St
New Brunswick, NJ 08901
|
1,216 sq. feet
|
- baths - beds |
show details | |

|
#28
Baldwin St
New Brunswick, NJ 08901
|
1,102 sq. feet
|
- baths - beds |
show details | |

|
#29
Union St Apt 3e
New Brunswick, NJ 08901
|
- sq. feet
|
- baths - beds |
show details | |

|
#30
Ward St
New Brunswick, NJ 08901
|
1,364 sq. feet
|
- baths - beds |
show details |
| Photo | Address | Area | Beds / Baths | Price | Details |
|---|---|---|---|---|---|

|
#31
Richmond St Apt 2074
New Brunswick, NJ 08901
|
- sq. feet
|
- baths - beds |
show details | |

|
#32
Edpas Rd
New Brunswick, NJ 08901
|
- sq. feet
|
- baths - beds |
show details | |

|
#33
Sandford St
New Brunswick, NJ 08901
|
- sq. feet
|
- baths - beds |
show details | |

|
#34
Columbus Pl
New Brunswick, NJ 08901
|
- sq. feet
|
- baths - beds |
show details | |

|
#35
Baldwin St
New Brunswick, NJ 08901
|
- sq. feet
|
- baths - beds |
show details | |

|
#36
Delafield St
New Brunswick, NJ 08901
|
- sq. feet
|
- baths - beds |
show details | |

|
#37
Howard St
New Brunswick, NJ 08901
|
- sq. feet
|
- baths - beds |
show details | |

|
#38
Townsend St
New Brunswick, NJ 08901
|
- sq. feet
|
- baths - beds |
show details | |

|
#39
Edpas Rd
New Brunswick, NJ 08901
|
- sq. feet
|
- baths - beds |
show details | |

|
#40
Renaissance Ln
New Brunswick, NJ 08901
|
- sq. feet
|
- baths - beds |
show details |
| Photo | Address | Area | Beds / Baths | Price | Details |
|---|---|---|---|---|---|

|
#41
Edpas Rd
New Brunswick, NJ 08901
|
- sq. feet
|
- baths - beds |
show details | |

|
#42
Edpas Rd
New Brunswick, NJ 08901
|
- sq. feet
|
- baths - beds |
show details | |

|
#43
Richmond St
New Brunswick, NJ 08901
|
- sq. feet
|
- baths - beds |
show details | |

|
#44
Paul Robeson Blvd
New Brunswick, NJ 08901
|
- sq. feet
|
- baths - beds |
show details | |

|
#45
Talmadge St
New Brunswick, NJ 08901
|
- sq. feet
|
- baths - beds |
show details | |

|
#46
Dewey Dr
New Brunswick, NJ 08901
|
- sq. feet
|
- baths - beds |
show details | |

|
#47
Delavan St
New Brunswick, NJ 08901
|
- sq. feet
|
- baths - beds |
show details | |

|
#48
Delavan Ct
New Brunswick, NJ 08901
|
- sq. feet
|
- baths - beds |
show details | |

|
#49
Cotter Dr
New Brunswick, NJ 08901
|
- sq. feet
|
- baths - beds |
show details | |

|
Check over 1 million property listings on Foreclosure.com!
|
browse all offers | |||


Median year apartment built: 1975
Household type by relationship:
Households: 55,800- Male householders: 7,493 (2,021 living alone), Female householders: 8,156 (2,136 living alone)
4,377 spouses (4,307 opposite-sex spouses), 2,313 unmarried partners, (2,225 opposite-sex unmarried partners), 14,642 children (13,937 natural, 240 adopted, 464 stepchildren), 1,470 grandchildren, 623 brothers or sisters, 611 parents, 0 foster children, 1,390 other relatives, 6,100 non-relatives
- In group quarters: 8,621
Size of family households: 2,381 2-persons, 2,023 3-persons, 1,893 4-persons, 1,136 5-persons, 885 6-persons, 426 7-or-more-persons.
Size of nonfamily households: 4,228 1-person, 2,155 2-persons, 395 3-persons, 207 4-persons, 86 5-persons, 80 6-persons, 197 7-or-more-persons.
4,240 married couples with children.
5,272 single-parent households (892 men, 4,380 women).
45.4% of residents of New Brunswick speak English at home.
46.9% of residents speak Spanish at home (45% speak English very well, 16% speak English well, 17% speak English not well, 23% don't speak English at all).
2.8% of residents speak other Indo-European language at home (74% speak English very well, 18% speak English well, 5% speak English not well, 2% don't speak English at all).
4.4% of residents speak Asian or Pacific Island language at home (70% speak English very well, 24% speak English well, 6% speak English not well).
1.6% of residents speak other language at home (67% speak English very well, 4% speak English well, 17% speak English not well, 13% don't speak English at all).
Foreign born population: 19,656 (35.2%)
(44.0% of them are naturalized citizens)
| Here: | 5.8 |
| State: | 6.8 |
| Here: | 3.6 |
| State: | 3.9 |

- Bedrooms in owner-occupied houses and condos in New Brunswick, New Jersey
- 14no bedroom
- 1321 bedroom
- 1,1982 bedrooms
- 1,2823 bedrooms
- 4214 bedrooms
- 1615+ bedrooms

- Bedrooms in renter-occupied apartments in New Brunswick, New Jersey
- 1,379no bedroom
- 3,8081 bedroom
- 4,9512 bedrooms
- 1,8023 bedrooms
- 4134 bedrooms
- 3225+ bedrooms

- Cars and other vehicles available in New Brunswick in owner-occupied houses/condos
- 114no vehicle
- 9391 vehicle
- 1,1102 vehicles
- 7783 vehicles
- 1564 vehicles
- 1125+ vehicles

- Cars and other vehicles available in New Brunswick in renter-occupied apartments
- 4,578no vehicle
- 4,6121 vehicle
- 2,5102 vehicles
- 4023 vehicles
- 1904 vehicles
- 3845+ vehicles

- Rooms in owner-occupied houses in New Brunswick, New Jersey
- 141 room
- 782 rooms
- 913 rooms
- 3944 rooms
- 8545 rooms
- 6386 rooms
- 4327 rooms
- 3208 rooms
- 3859+ rooms

- Rooms in renter-occupied apartments in New Brunswick, New Jersey
- 1,2711 room
- 1,1252 rooms
- 3,2473 rooms
- 3,4174 rooms
- 2,1055 rooms
- 7496 rooms
- 2567 rooms
- 2948 rooms
- 2119+ rooms


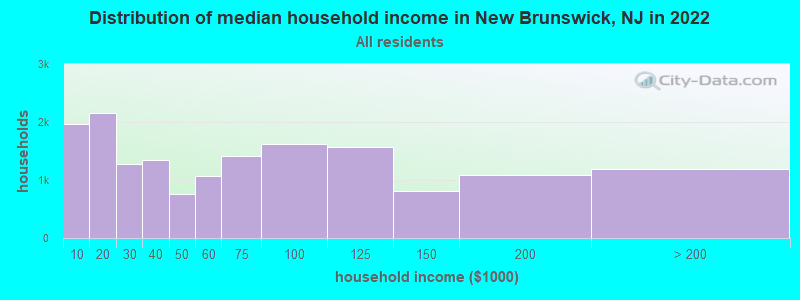
New Brunswick, NJ household income distribution

- 1,960Less than $10,000
- 2,155$10,000 to $19,999
- 1,273$20,000 to $29,999
- 1,350$30,000 to $39,999
- 758$40,000 to $49,999
- 1,062$50,000 to $59,999
- 1,414$60,000 to $74,999
- 1,613$75,000 to $99,999
- 1,563$100,000 to $124,999
- 816$125,000 to $149,999
- 1,079$150,000 to $199,999
- 1,188$200,000 or more
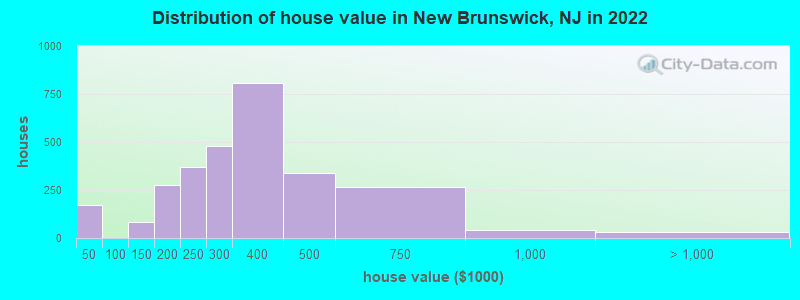
Home value of owner - occupied houses in 2022 in New Brunswick, NJ
-
- 114Less than $10,000
- 40$20,000 to $24,999
- 17$25,000 to $29,999
- 7$100,000 to $124,999
- 77$125,000 to $149,999
- 180$150,000 to $174,999
- 97$175,000 to $199,999
- 371$200,000 to $249,999
- 480$250,000 to $299,999
- 808$300,000 to $399,999
- 339$400,000 to $499,999
- 266$500,000 to $749,999
- 42$750,000 to $999,999
- 26$1,000,000 to $1,499,999
- 3$2,000,000 or more
Rent paid by renters in 2022 in New Brunswick, NJ
-
- 43Less than $100
- 95$100 to $149
- 123$150 to $199
- 192$200 to $249
- 45$250 to $299
- 362$300 to $349
- 118$350 to $399
- 43$400 to $449
- 194$450 to $499
- 12$500 to $549
- 321$550 to $599
- 135$600 to $649
- 10$650 to $699
- 391$700 to $749
- 140$750 to $799
- 122$800 to $899
- 583$900 to $999
- 1,603$1,000 to $1,249
- 1,955$1,250 to $1,499
- 3,732$1,500 to $1,999
- 1,028$2,000 to $2,499
- 423$2,500 to $2,999
- 232$3,000 to $3,499
- 968$3,500 or more
- 291No cash rent


Percentage of workers working in this county: 78.3%
Number of people working at home: 2,802 (11.2% of all workers)
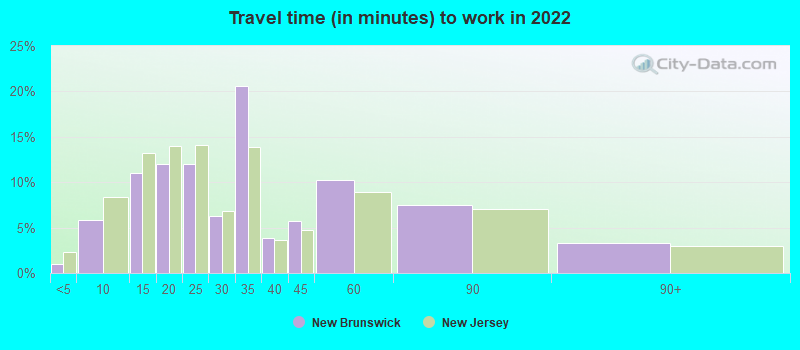
Travel time to work (commute)
- Less than 5 minutes: 478
- 5 to 9 minutes: 2,448
- 10 to 14 minutes: 3,662
- 15 to 19 minutes: 3,081
- 20 to 24 minutes: 2,813
- 25 to 29 minutes: 1,273
- 30 to 34 minutes: 4,463
- 35 to 39 minutes: 887
- 40 to 44 minutes: 648
- 45 to 59 minutes: 1,165
- 60 to 89 minutes: 1,079
- 90 or more minutes: 523
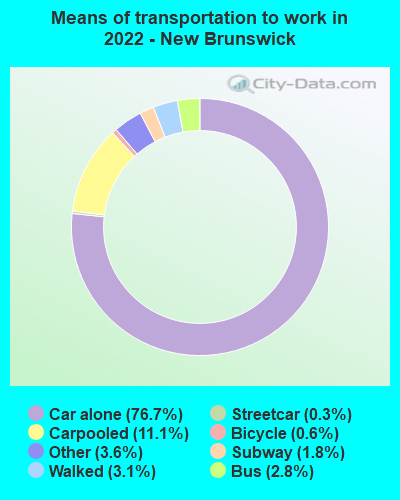
Means of transportation to work:
- Drove a car alone: 28,505 (67.5%)
- Carpooled: 4,862 (11.5%)
- Bus: 459 (1.1%)
- Subway or elevated rail: 148 (0.4%)
- Long-distance train or commuter rail: 569 (1.3%)
- Light rail, streetcar or trolley: 12 (0.0%)
- Taxi: 1,814 (4.3%)
- Bicycle: 256 (0.6%)
- Walked: 1,694 (4.0%)
- Worked at home: 2,802 (6.6%)

- Unemployment by race in 2022
- Unemployment rate for White non-Hispanic residents
- 2.6%Males
- 1.5%Females
- Unemployment rate for Black residents
- 20.9%Males
- 16.9%Females
- Unemployment rate for American Indian and Alaska Native residents
- 6.1%Females
- Unemployment rate for Asian residents
- 7.1%Males
- 1.4%Females
- Unemployment rate for other race residents
- 7.4%Males
- 4.9%Females
- Unemployment rate for two or more race residents
- 2.0%Males
- 6.1%Females
- Unemployment rate for Hispanic or Latino residents
- 4.5%Males
- 6.0%Females

- Year of entry for the foreign-born population in New Brunswick, New Jersey
- 6,9762010 or later
- 6,7602000 to 2009
- 3,5421990 to 1999
- 3,9441980 to 1989
- 8041970 to 1979
- 486Before 1970

First ancestries reported:
- American: 1,803 (5.8%)
- Italian: 509 (1.6%)
- Lebanese: 242 (0.8%)
- Hungarian: 232 (0.7%)
- Irish: 229 (0.7%)
- U.S. Virgin Islander: 214 (0.7%)
- Polish: 198 (0.6%)
- Jamaican: 176 (0.6%)
- English: 167 (0.5%)
- Russian: 152 (0.5%)
- Palestinian: 141 (0.5%)
- African: 140 (0.5%)
- German: 128 (0.4%)
- Ghanaian: 115 (0.4%)
- Brazilian: 92 (0.3%)
- Trinidadian and Tobagonian: 92 (0.3%)
- Portuguese: 83 (0.3%)
- Ukrainian: 65 (0.2%)
- Egyptian: 62 (0.2%)
- European: 61 (0.2%)
- Guyanese: 56 (0.2%)
- Iranian: 47 (0.2%)
- Barbadian: 43 (0.1%)
- Romanian: 36 (0.1%)
- Austrian: 28 (0.09%)
- Greek: 28 (0.09%)
- Haitian: 25 (0.08%)
- Danish: 24 (0.08%)
- Carpatho Rusyn: 22 (0.07%)
- Dutch: 22 (0.07%)
- Swedish: 22 (0.07%)
- British West Indian: 19 (0.06%)
- Albanian: 18 (0.06%)
- Czechoslovakian: 17 (0.05%)
- Israeli: 16 (0.05%)
- Turkish: 16 (0.05%)
- French Canadian: 14 (0.05%)
- Arab: 11 (0.04%)
- French: 10 (0.03%)
- Scottish: 10 (0.03%)
- Nigerian: 9 (0.03%)
- West Indian: 9 (0.03%)
- Eastern European: 7 (0.02%)
- Kenyan: 6 (0.02%)
- Lithuanian: 5 (0.02%)
- Syrian: 3 (0.01%)
Most common places of birth for foreign-born residents (%):
| New Brunswick: | 33.3% (6,364) |
| New Jersey: | 4.8% (102,527) |
| New Brunswick: | 24.5% (4,680) |
| New Jersey: | 9.7% (209,055) |
| New Brunswick: | 7.1% (1,365) |
| New Jersey: | 1.7% (37,335) |
| New Brunswick: | 5.3% (1,020) |
| New Jersey: | 3.7% (78,969) |
| New Brunswick: | 3.2% (612) |
| New Jersey: | 0.9% (18,317) |
| New Brunswick: | 2.6% (506) |
| New Jersey: | 12.8% (274,609) |
| New Brunswick: | 2.3% (444) |
| New Jersey: | 4.4% (95,275) |
| New Brunswick: | 2.3% (443) |
| New Jersey: | 2.2% (46,813) |
| New Brunswick: | 1.5% (289) |
| New Jersey: | 2.3% (48,885) |
Place of birth for U.S.-born residents:
- This state: 24,654
- Other state: 9,933
- Northeast: 5,403
- Midwest: 1,043
- South: 1,871
- West: 1,600
81.1% of New Brunswick residents lived in the same house 1 years ago.
Out of people who lived in different houses, 24.8% lived in this county.
Out of people who lived in different counties, 44.6% lived in New Jersey.
| New Brunswick: | 81.1% |
| State average: | 90.4% |
Education attainment for males 25 years and older:
- No schooling: 802
- Nursery to 4th grade: 875
- 5th and 6th grade: 1,139
- 7th and 8th grade: 523
- 9th grade: 378
- 10th grade: 224
- 11th grade: 132
- 12th grade, no diploma: 646
- High school graduate (or equivalency): 3,842
- Less than 1 year of college: 541
- Some college more than 1 year, no degree: 780
- Associate degree: 593
- Bachelor's degree: 1,845
- Master's degree: 874
- Professional school degree: 689
- Doctorate degree: 182

Education attainment for females 25 years and older:
- No schooling: 614
- Nursery to 4th grade: 549
- 5th and 6th grade: 688
- 7th and 8th grade: 548
- 9th grade: 259
- 10th grade: 326
- 11th grade: 328
- 12th grade, no diploma: 715
- High school graduate (or equivalency): 3,201
- Less than 1 year of college: 602
- Some college more than 1 year, no degree: 1,067
- Associate degree: 684
- Bachelor's degree: 1,703
- Master's degree: 844
- Professional school degree: 274
- Doctorate degree: 242


Housing units in structures:
- One, detached: 3,788
- One, attached: 1,215
- Two: 2,938
- 3 or 4: 1,632
- 5 to 9: 1,516
- 10 to 19: 1,650
- 20 to 49: 957
- 50 or more: 3,323
Housing units lacking complete kitchen facilities in 2022: 1.6%
House/condo owner moved in on average 16 years ago
Renter moved in on average 3 years ago


- 70.4%Utility gas
- 14.6%Electricity
- 8.3%Fuel oil, kerosene, etc.
- 4.8%Bottled, tank, or LP gas
- 1.7%No fuel used
- 0.2%Wood
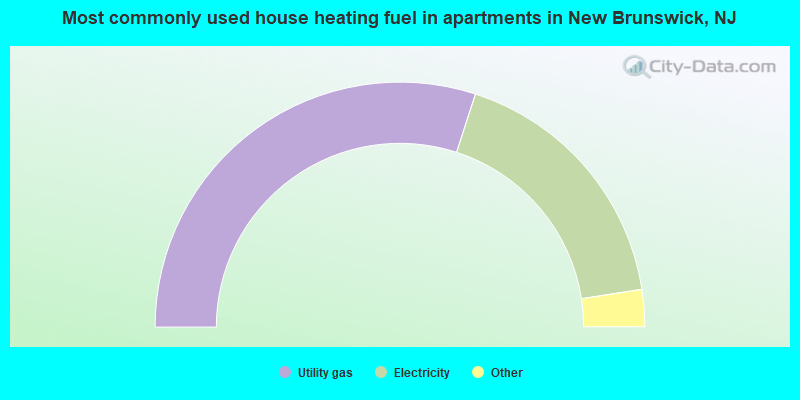
- 60.0%Utility gas
- 35.1%Electricity
- 1.5%Bottled, tank, or LP gas
- 1.4%No fuel used
- 1.4%Other fuel
- 0.5%Fuel oil, kerosene, etc.
Private vs. public school enrollment:
| Here: | 3.7% |
| New Jersey: | 12.3% |
| Here: | 2.1% |
| New Jersey: | 13.1% |
| Here: | 42.8% |
| New Jersey: | 33.2% |


