Housing density: 1,088 houses/condos per square mile
Median price asked for vacant for-sale houses and condos in 2022 in this county: $246,679.
Median contract rent in 2022: $1,352 (lower quartile is $1,013, upper quartile is $1,618)
Median rent asked for vacant for-rent units in 2022: $1,345
Median gross rent in Nether Providence Township, PA in 2022: $1,486
Housing units in Nether Providence Township with a mortgage: 2,787 (293 second mortgage, 510 home equity loan, 29 both second mortgage and home equity loan) Houses without a mortgage: 1,234
Compare current foreclosures near Nether Providence Township, PA:
In family households: 453,586 (91,569 male householders, 48,290 female householders)
99,383 spouses, 170,789 children (161,642 natural, 3,823 adopted, 5,324 stepchildren), 11,365 grandchildren, 5,918 brothers or sisters, 5,812 parents, foster children, 6,644 other relatives, 10,420 non-relatives
In nonfamily households: 82,338 (29,827 male householders (23,777 living alone)), 39,014 female householders (33,920 living alone)), 13,497 nonrelatives
In group quarters: 23,055 (7,828 institutionalized population)
94,926 married couples with children.
28,980 single-parent households (5,380 men, 23,600 women).
90.2% of residents of Nether Providence Township speak English at home.
1.4% of residents speak Spanish at home (81% speak English very well, 19% speak English well).
5.4% of residents speak other Indo-European language at home (71% speak English very well, 16% speak English well, 13% speak English not well).
1.8% of residents speak Asian or Pacific Island language at home (66% speak English very well, 28% speak English well, 6% speak English not well).
1.2% of residents speak other language at home (65% speak English very well, 24% speak English well, 12% speak English not well).
Foreign born population: 1,452 (10.3%)
(74.2% of them are naturalized citizens)
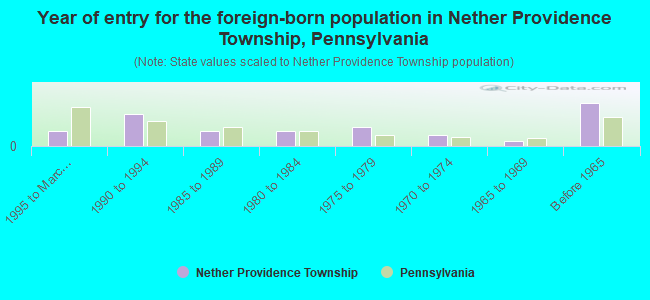
Year of entry for the foreign-born population in Nether Providence Township, Pennsylvania
891995 to March 2000
1891990 to 1994
911985 to 1989
891980 to 1984
1161975 to 1979
651970 to 1974
301965 to 1969
254Before 1965
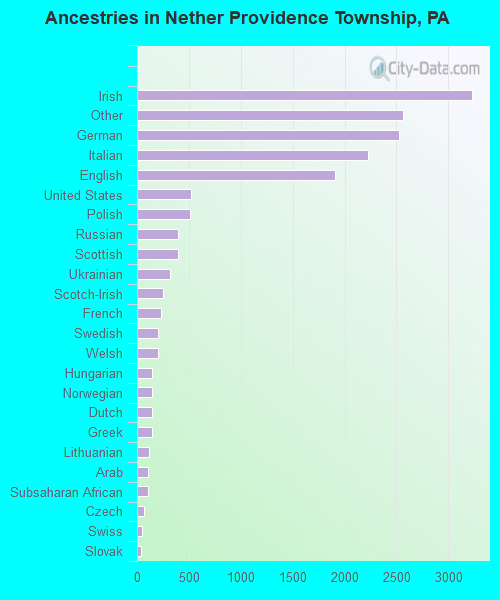
First ancestries reported:
Irish: 3,231 (19.4%)
Other: 2,564 (15.4%)
German: 2,525 (15.2%)
Italian: 2,228 (13.4%)
English: 1,908 (11.5%)
United States: 521 (3.1%)
Polish: 513 (3.1%)
Russian: 394 (2.4%)
Scottish: 393 (2.4%)
Ukrainian: 319 (1.9%)
Scotch-Irish: 247 (1.5%)
French: 228 (1.4%)
Swedish: 206 (1.2%)
Welsh: 201 (1.2%)
Hungarian: 149 (0.9%)
Norwegian: 146 (0.9%)
Dutch: 145 (0.9%)
Greek: 141 (0.8%)
Lithuanian: 120 (0.7%)
Arab: 107 (0.6%)
Subsaharan African: 106 (0.6%)
Czech: 68 (0.4%)
Swiss: 44 (0.3%)
Slovak: 37 (0.2%)
West Indian: 28 (0.2%)
French Canadian: 25 (0.2%)
Danish: 12 (0.07%)
Portuguese: 7 (0.04%)
Most common places of birth for foreign-born residents (%):
United Kingdom
Nether Providence Township:
9.0% (83)
Pennsylvania:
4.6% (23,171)
Philippines
Nether Providence Township:
8.0% (74)
Pennsylvania:
2.2% (11,411)
Germany
Nether Providence Township:
7.6% (70)
Pennsylvania:
5.1% (25,685)
Iran
Nether Providence Township:
5.3% (49)
Pennsylvania:
0.6% (3,034)
India
Nether Providence Township:
4.4% (41)
Pennsylvania:
7.4% (37,541)
Canada
Nether Providence Township:
3.8% (35)
Pennsylvania:
3.0% (15,200)
Other Western Europe
Nether Providence Township:
3.6% (33)
Pennsylvania:
0.4% (2,023)
China, excluding Hong Kong and Taiwan
Nether Providence Township:
3.1% (29)
Pennsylvania:
4.6% (23,478)
Hungary
Nether Providence Township:
3.0% (28)
Pennsylvania:
0.7% (3,762)
Ghana
Nether Providence Township:
3.0% (28)
Pennsylvania:
0.2% (1,160)
Russia
Nether Providence Township:
2.8% (26)
Pennsylvania:
2.7% (13,885)
Italy
Nether Providence Township:
2.7% (25)
Pennsylvania:
6.0% (30,559)
Israel
Nether Providence Township:
2.7% (25)
Pennsylvania:
0.5% (2,475)
Ukraine
Nether Providence Township:
2.6% (24)
Pennsylvania:
3.3% (16,897)
Other Eastern Europe
Nether Providence Township:
2.6% (24)
Pennsylvania:
1.7% (8,574)
Ecuador
Nether Providence Township:
2.5% (23)
Pennsylvania:
0.5% (2,562)
Ireland
Nether Providence Township:
2.3% (21)
Pennsylvania:
1.3% (6,687)
Thailand
Nether Providence Township:
2.1% (19)
Pennsylvania:
0.6% (2,828)
Pakistan
Nether Providence Township:
2.0% (18)
Pennsylvania:
0.8% (4,160)
Jamaica
Nether Providence Township:
1.8% (17)
Pennsylvania:
2.4% (12,390)
Poland
Nether Providence Township:
1.5% (14)
Pennsylvania:
2.3% (11,916)
Cambodia
Nether Providence Township:
1.5% (14)
Pennsylvania:
1.3% (6,656)
Place of birth for U.S.-born residents:
This state: 9,508
Other state: 2,936
Northeast: 1,323
Midwest: 553
South: 825
West: 235
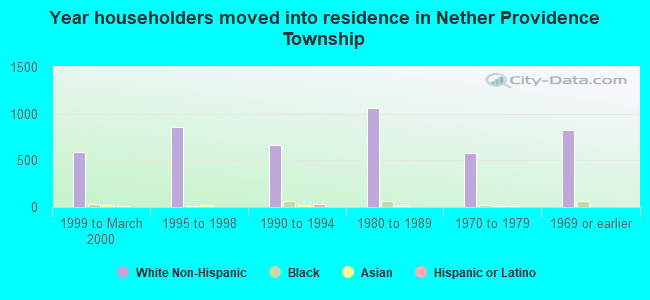
69% of Nether Providence Township residents lived in the same house 5 years ago. Out of people who lived in different houses, 57% lived in this county. Out of people who lived in different counties, 44% lived in Pennsylvania.
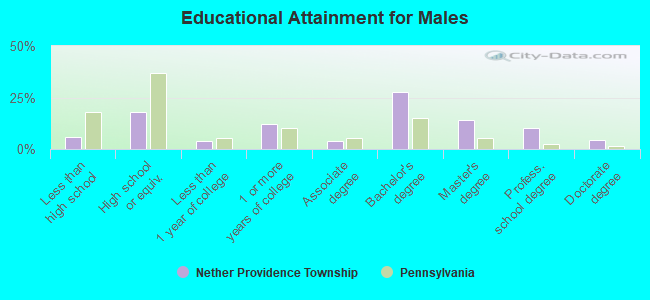
Education attainment for males 25 years and older:
No schooling: 16
Nursery to 4th grade: 8
5th and 6th grade: 22
7th and 8th grade: 65
9th grade: 23
10th grade: 15
11th grade: 52
12th grade, no diploma: 56
High school graduate (or equivalency): 760
Less than 1 year of college: 159
Some college more than 1 year, no degree: 509
Associate degree: 171
Bachelor's degree: 1,176
Master's degree: 602
Professional school degree: 444
Doctorate degree: 196
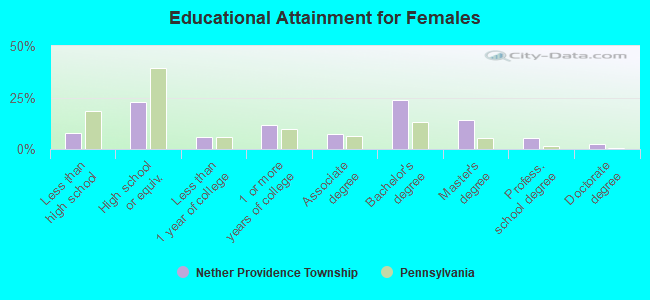
Education attainment for females 25 years and older:
No schooling: 23
Nursery to 4th grade: 0
5th and 6th grade: 20
7th and 8th grade: 74
9th grade: 38
10th grade: 61
11th grade: 44
12th grade, no diploma: 126
High school graduate (or equivalency): 1,156
Less than 1 year of college: 293
Some college more than 1 year, no degree: 586
Associate degree: 375
Bachelor's degree: 1,209
Master's degree: 714
Professional school degree: 281
Doctorate degree: 115
Housing units in structures:
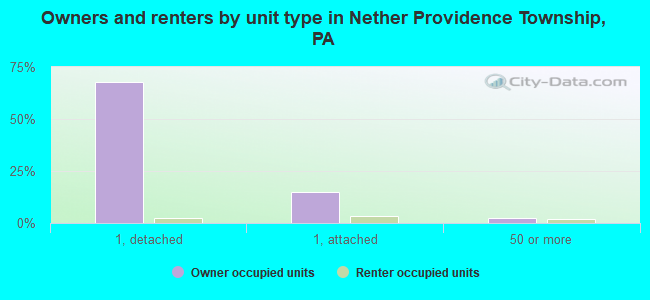
One, detached: 3,549
One, attached: 948
Two: 102
3 or 4: 48
5 to 9: 43
10 to 19: 115
20 to 49: 92
50 or more: 228
Housing units lacking complete plumbing facilities: 0.4%
Housing units lacking complete kitchen facilities: 0.4%