Morgantown, WV (West Virginia) Houses and Residents
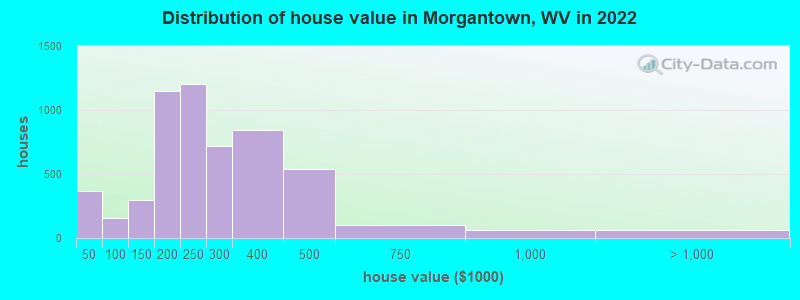
Estimated median house or condo value in 2022: $234,536 (it was $92,900 in 2000 )
Morgantown:
$234,536West Virginia:
$155,100
Lower value quartile - upper value quartile: $175,458 - $322,911Mean price in 2022: Detached houses: $271,724 Here:
$271,724State:
$206,655
In 2-unit structures: $252,407 Here:
$252,407State:
$127,101
In 5-or-more-unit structures: $225,019 Here:
$225,019State:
$177,533
Mobile homes: $29,101 Here:
$29,101State:
$63,963
Total population: 31,073 (Urban population: 27,132, Rural population: 29 (all nonfarm) )
Houses: 14,094 (12,128 occupied: 5,253 owner occupied, 6,933 renter occupied )
% of renters here:
57%State:
26%
Housing density: 1,438 houses/condos per square mile
Median price asked for vacant for-sale houses and condos in 2022: $179,701.
Median contract rent in 2022: $748 (lower quartile is $588, upper quartile is $907)
Median rent asked for vacant for-rent units in 2022: $1,519
Median gross rent in Morgantown, WV in 2022: $844
Housing units in Morgantown with a mortgage: 3,285 (396 second mortgage, 0 home equity loan, 361 both second mortgage and home equity loan )Houses without a mortgage: 101
Median household income for houses/condos with a mortgage: $94,345
Median household income for apartments without a mortgage: $63,108
Median monthly housing costs: $894
Data:
Median house or condo value ($)
Median house or condo value ($ change since 2000)
Median house or condo value ($) - White
Median house or condo value ($) - Black or African American
Median house or condo value ($) - Asian
Median house or condo value ($) - Hispanic or Latino
Median house or condo value ($) - American Indian and Alaska Native
Median house or condo value ($) - Multirace
Median house or condo value ($) - Other Race
Median price asked for mobile homes ($)
Household density (households per square mile)
Mean house or condo value by units in structure - 1, detached ($)
Mean house or condo value by units in structure - 1, attached ($)
Mean house or condo value by units in structure - 2 ($)
Mean house or condo value by units in structure by units in structure - 3 or 4 ($)
Mean house or condo value by units in structure - 5 or more ($)
Mean house or condo value by units in structure - Boat, RV, van, etc. ($)
Mean house or condo value by units in structure - Mobile home ($)
Median contract rent ($)
Median contract rent - Lower quartile ($)
Median contract rent - Upper quartile ($)
Median gross rent ($)
Urban houses (%)
Rural houses (%)
Houses occupied (%)
Houses occupied (% change since 2000)
Houses owner occupied (%)
Houses owner occupied (% change since 2000)
Houses renter occupied (%)
Houses renter occupied (% change since 2000)
Vacant housing units - For rent (%)
Vacant housing units - For rent (% change since 2000)
Vacant housing units - For sale only (%)
Vacant housing units - For sale only (% change since 2000)
Vacant housing units - Rented or sold, not occupied (%)
Vacant housing units - Rented or sold, not occupied (% change since 2000)
Vacant housing units - For seasonal, recreational, or occasional use (%)
Vacant housing units - For seasonal, recreational, or occasional use (% change since 2000)
Vacant housing units - For migrant workers (%)
Vacant housing units - For migrant workers (% change since 2000)
Vacant housing units - Other vacant (%)
Vacant housing units - Other vacant (% change since 2000)
Median monthly housing costs ($)
Median household income for houses/condos with a mortgage ($)
Median household income for houses/condos without a mortgage ($)
Median household income ($)
Median household income ($) - White
Median household income ($) - Black or African American
Median household income ($) - Asian
Median household income ($) - Hispanic or Latino
Median household income ($) - American Indian and Alaska Native
Median household income ($) - Multirace
Median household income ($) - Other Race
Mortgage status - with mortgage (%)
Mortgage status - with second mortgage (%)
Mortgage status - with home equity loan (%)
Mortgage status - with both second mortgage and home equity loan (%)
Mortgage status - without a mortgage (%)
Median year house/condo built
Median year apartment built
Household type by relationship - Male householder living alone (%)
Household type by relationship - Male householder not living alone (%)
Household type by relationship - Female householder living alone (%)
Household type by relationship - Female householder not living alone (%)
Household type by relationship - Opposite-Sex spouse (%)
Household type by relationship - Same-Sex spouse (%)
Household type by relationship - Opposite-Sex unmarried partner (%)
Household type by relationship - Same-Sex unmarried partner (%)
Household type by relationship - In group quarters (%)
Size of family households - 2-person household (%)
Size of family households - 3-person household (%)
Size of family households - 4-person household (%)
Size of family households - 5-person household (%)
Size of family households - 6-person household (%)
Size of family households - 7-or-more-person household (%)
Size of nonfamily households - 1-person household (%)
Size of nonfamily households - 2-person household (%)
Size of nonfamily households - 3-person household (%)
Size of nonfamily households - 4-person household (%)
Size of nonfamily households - 5-person household (%)
Size of nonfamily households - 6-person household (%)
Size of nonfamily households - 7-or-moreperson household (%)
Year house built - Built 2010 or later (%)
Year house built - Built 2000 to 2009 (%)
Year house built - Built 1990 to 1999 (%)
Year house built - Built 1980 to 1989 (%)
Year house built - Built 1970 to 1979 (%)
Year house built - Built 1960 to 1969 (%)
Year house built - Built 1950 to 1959 (%)
Year house built - Built 1940 to 1949 (%)
Year house built - Built 1939 or earlier (%)
Median number of rooms in houses and condos
Median number of rooms in apartments
Median number of bedrooms in owner occupied houses
Mean number of bedrooms in owner occupied houses
Median number of bedrooms in renter occupied houses
Mean number of bedrooms in renter occupied houses
Median number of vehichles in owner occupied houses
Mean number of vehichles in owner occupied houses
Median number of vehichles in renter occupied houses
Mean number of vehichles in renter occupied houses
Rooms in owner-occupied houses - 1 room (%)
Rooms in owner-occupied houses - 2 rooms (%)
Rooms in owner-occupied houses - 3 rooms (%)
Rooms in owner-occupied houses - 4 rooms (%)
Rooms in owner-occupied houses - 5 rooms (%)
Rooms in owner-occupied houses - 6 rooms (%)
Rooms in owner-occupied houses - 7 rooms (%)
Rooms in owner-occupied houses - 8 rooms (%)
Rooms in owner-occupied houses - 9+ rooms (%)
Rooms in renter-occupied houses - 1 room (%)
Rooms in renter-occupied houses - 2 rooms (%)
Rooms in renter-occupied houses - 3 rooms (%)
Rooms in renter-occupied houses - 4 rooms (%)
Rooms in renter-occupied houses - 5 rooms (%)
Rooms in renter-occupied houses - 6 rooms (%)
Rooms in renter-occupied houses - 7 rooms (%)
Rooms in renter-occupied houses - 8 rooms (%)
Rooms in renter-occupied houses - 9+ rooms (%)
Bedrooms in owner-occupied houses - no bedrooms (%)
Bedrooms in owner-occupied houses - 1 bedroom (%)
Bedrooms in owner-occupied houses - 2 bedrooms (%)
Bedrooms in owner-occupied houses - 3 bedrooms (%)
Bedrooms in owner-occupied houses - 4 bedrooms (%)
Bedrooms in owner-occupied houses - 5+ bedrooms (%)
Bedrooms in renter-occupied houses - no bedrooms (%)
Bedrooms in renter-occupied houses - 1 bedroom (%)
Bedrooms in renter-occupied houses - 2 bedrooms (%)
Bedrooms in renter-occupied houses - 3 bedrooms (%)
Bedrooms in renter-occupied houses - 4 bedrooms (%)
Bedrooms in renter-occupied houses - 5+ bedrooms (%)
Vehicles available in owner-occupied houses - no vehicle available (%)
Vehicles available in owner-occupied houses - 1 vehicle available(%)
Vehicles available in owner-occupied houses - 2 Vehicles available (%)
Vehicles available in owner-occupied houses - 3 Vehicles available (%)
Vehicles available in owner-occupied houses - 4 Vehicles available (%)
Vehicles available in owner-occupied houses - 5+ Vehicles available (%)
Vehicles available in renter-occupied houses - no vehicle available (%)
Vehicles available in renter-occupied houses - 1 vehicle available (%)
Vehicles available in renter-occupied houses - 2 Vehicles available (%)
Vehicles available in renter-occupied houses - 3 Vehicles available (%)
Vehicles available in renter-occupied houses - 4 Vehicles available (%)
Vehicles available in renter-occupied houses - 5+ Vehicles available (%)
Housing units in structures - 1, detached (%)
Housing units in structures - 1, attached (%)
Housing units in structures - 2 (%)
Housing units in structures - 3 or 4 (%)
Housing units in structures - 5 to 9 (%)
Housing units in structures - 10 to 19 (%)
Housing units in structures - 20 to 49 (%)
Housing units in structures - 50 or more (%)
Housing units in structures - Mobile home (%)
Housing units in structures - Boat, RV, van, etc. (%)
Housing units in structures - Owners - 1, detached (%)
Housing units in structures - Owners - 1, attached (%)
Housing units in structures - Owners - 2 (%)
Housing units in structures - Owners - 3 or 4 (%)
Housing units in structures - Owners - 5 to 9 (%)
Housing units in structures - Owners - 10 to 19 (%)
Housing units in structures - Owners - 20 to 49 (%)
Housing units in structures - Owners - 50 or more (%)
Housing units in structures - Owners - Mobile home (%)
Housing units in structures - Owners - Boat, RV, van, etc. (%)
Housing units in structures - Renters - 1, detached (%)
Housing units in structures - Renters - 1, attached (%)
Housing units in structures - Renters - 2 (%)
Housing units in structures - Renters - 3 or 4 (%)
Housing units in structures - Renters - 5 to 9 (%)
Housing units in structures - Renters - 10 to 19 (%)
Housing units in structures - Renters - 20 to 49 (%)
Housing units in structures - Renters - 50 or more (%)
Housing units in structures - Renters - Mobile home (%)
Housing units in structures - Renters - Boat, RV, van, etc. (%)
House/condo owner moved in on average (years ago)
Renter moved in on average (years ago)
Year householder moved into unit - Moved in 1999 to March 2000 (%)
Year householder moved into unit - Moved in 1999 to March 2000 (%) - White
Year householder moved into unit - Moved in 1999 to March 2000 (%) - Black or African American
Year householder moved into unit - Moved in 1999 to March 2000 (%) - Asian
Year householder moved into unit - Moved in 1999 to March 2000 (%) - Hispanic or Latino
Year householder moved into unit - Moved in 1999 to March 2000 (%) - American Indian and Alaska Native
Year householder moved into unit - Moved in 1999 to March 2000 (%) - Multirace
Year householder moved into unit - Moved in 1999 to March 2000 (%) - Other Race
Year householder moved into unit - Moved in 1995 to 1998 (%)
Year householder moved into unit - Moved in 1995 to 1998 (%) - White
Year householder moved into unit - Moved in 1995 to 1998 (%) - Black or African American
Year householder moved into unit - Moved in 1995 to 1998 (%) - Asian
Year householder moved into unit - Moved in 1995 to 1998 (%) - Hispanic or Latino
Year householder moved into unit - Moved in 1995 to 1998 (%) - American Indian and Alaska Native
Year householder moved into unit - Moved in 1995 to 1998 (%) - Multirace
Year householder moved into unit - Moved in 1995 to 1998 (%) - Other Race
Year householder moved into unit - Moved in 1990 to 1994 (%)
Year householder moved into unit - Moved in 1990 to 1994 (%) - White
Year householder moved into unit - Moved in 1990 to 1994 (%) - Black or African American
Year householder moved into unit - Moved in 1990 to 1994 (%) - Asian
Year householder moved into unit - Moved in 1990 to 1994 (%) - Hispanic or Latino
Year householder moved into unit - Moved in 1990 to 1994 (%) - American Indian and Alaska Native
Year householder moved into unit - Moved in 1990 to 1994 (%) - Multirace
Year householder moved into unit - Moved in 1990 to 1994 (%) - Other Race
Year householder moved into unit - Moved in 1980 to 1989 (%)
Year householder moved into unit - Moved in 1980 to 1989 (%) - White
Year householder moved into unit - Moved in 1980 to 1989 (%) - Black or African American
Year householder moved into unit - Moved in 1980 to 1989 (%) - Asian
Year householder moved into unit - Moved in 1980 to 1989 (%) - Hispanic or Latino
Year householder moved into unit - Moved in 1980 to 1989 (%) - American Indian and Alaska Native
Year householder moved into unit - Moved in 1980 to 1989 (%) - Multirace
Year householder moved into unit - Moved in 1980 to 1989 (%) - Other Race
Year householder moved into unit - Moved in 1970 to 1979 (%)
Year householder moved into unit - Moved in 1970 to 1979 (%) - White
Year householder moved into unit - Moved in 1970 to 1979 (%) - Black or African American
Year householder moved into unit - Moved in 1970 to 1979 (%) - Asian
Year householder moved into unit - Moved in 1970 to 1979 (%) - Hispanic or Latino
Year householder moved into unit - Moved in 1970 to 1979 (%) - American Indian and Alaska Native
Year householder moved into unit - Moved in 1970 to 1979 (%) - Multirace
Year householder moved into unit - Moved in 1970 to 1979 (%) - Other Race
Year householder moved into unit - Moved in 1969 or earlier (%)
Year householder moved into unit - Moved in 1969 or earlier (%) - White
Year householder moved into unit - Moved in 1969 or earlier (%) - Black or African American
Year householder moved into unit - Moved in 1969 or earlier (%) - Asian
Year householder moved into unit - Moved in 1969 or earlier (%) - Hispanic or Latino
Year householder moved into unit - Moved in 1969 or earlier (%) - American Indian and Alaska Native
Year householder moved into unit - Moved in 1969 or earlier (%) - Multirace
Year householder moved into unit - Moved in 1969 or earlier (%) - Other Race
Housing units lacking complete plumbing facilities (%)
Housing units lacking complete kitchen facilities (%)
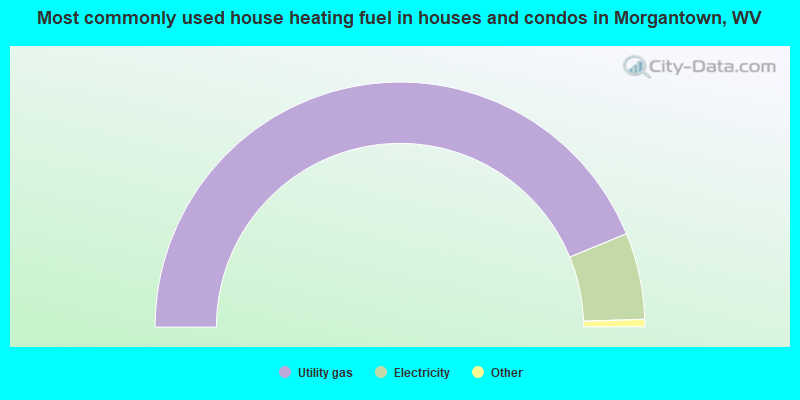
House heating fuel used in houses and condos - Utility gas (%)
House heating fuel used in houses and condos - Bottled, tank, or LP gas (%)
House heating fuel used in houses and condos - Electricity (%)
House heating fuel used in houses and condos - Fuel oil, kerosene, etc. (%)
House heating fuel used in houses and condos - Coal or coke (%)
House heating fuel used in houses and condos - Wood (%)
House heating fuel used in houses and condos - Solar energy (%)
House heating fuel used in houses and condos - Other fuel (%)
House heating fuel used in houses and condos - No fuel used (%)
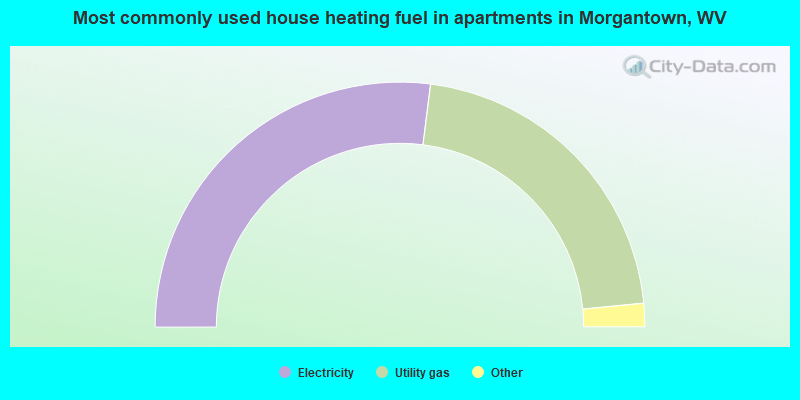
House heating fuel used in apartments - Utility gas (%)
House heating fuel used in apartments - Bottled, tank, or LP gas (%)
House heating fuel used in apartments - Electricity (%)
House heating fuel used in apartments - Fuel oil, kerosene, etc. (%)
House heating fuel used in apartments - Coal or coke (%)
House heating fuel used in apartments - Wood (%)
House heating fuel used in apartments - Solar energy (%)
House heating fuel used in apartments - Other fuel (%)
House heating fuel used in apartments - No fuel used (%)
Latest news about housing in Morgantown, WV collected exclusively by city-data.com from local newspapers, TV, and radio stations
Median year house/condo built: 1958Median year apartment built: 1970Household type by relationship:
Households: 30,471
Male householders: 6,590 (2,477 living alone ), Female householders: 5,544 (2,122 living alone )3,461 spouses (3,416 opposite-sex spouses ), 994 unmarried partners , (935 opposite-sex unmarried partners ), 3,972 children (3,772 natural , 34 adopted , 166 stepchildren ), 80 grandchildren , 562 brothers or sisters , 160 parents , 25 foster children , 197 other relatives , 3,742 non-relatives In group quarters: 5,138
Size of family households: 2,082 2-persons , 1,475 3-persons , 548 4-persons , 494 5-persons , 117 6-persons , 19 7-or-more-persons .
Size of nonfamily households: 5,289 1-person , 1,751 2-persons , 181 3-persons , 97 4-persons , 220 5-persons .
1,581 married couples with children. single-parent households (616 men , 582 women ).
91.6% of residents of Morgantown speak English at home. of residents speak Spanish at home (95% speak English very well , 5% speak English well ).of residents speak other Indo-European language at home (68% speak English very well , 32% speak English well ).of residents speak Asian or Pacific Island language at home (37% speak English very well , 58% speak English well , 5% speak English not well ).of residents speak other language at home (77% speak English very well , 23% speak English well ).
Foreign born population: 2,266 (7.4%)of them are naturalized citizens )
Median number of rooms in houses and condos:
Median number of rooms in apartments
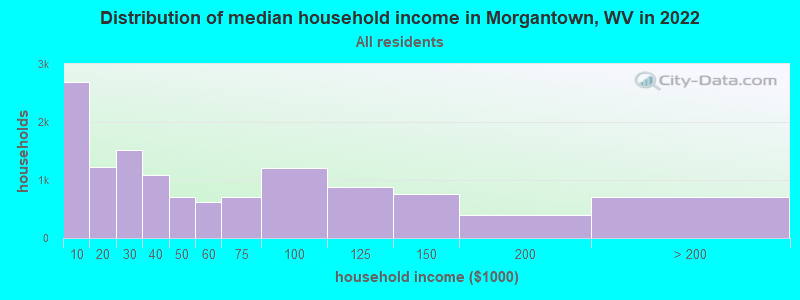
Morgantown, WV household income distribution 2,686 Less than $10,0001,222 $10,000 to $19,9991,514 $20,000 to $29,9991,093 $30,000 to $39,999715 $40,000 to $49,999626 $50,000 to $59,999707 $60,000 to $74,9991,215 $75,000 to $99,999874 $100,000 to $124,999759 $125,000 to $149,999396 $150,000 to $199,999704 $200,000 or more
Home value of owner - occupied houses in 2022 in Morgantown, WV 30 Less than $10,00055 $10,000 to $14,99934 $15,000 to $19,99992 $20,000 to $24,999122 $30,000 to $34,99931 $40,000 to $49,9996 $50,000 to $59,99911 $60,000 to $69,99923 $70,000 to $79,99935 $80,000 to $89,99950 $90,000 to $99,999127 $100,000 to $124,999172 $125,000 to $149,999886 $150,000 to $174,999265 $175,000 to $199,9991,205 $200,000 to $249,999715 $250,000 to $299,999843 $300,000 to $399,999540 $400,000 to $499,999102 $500,000 to $749,99966 $750,000 to $999,99916 $1,000,000 to $1,499,99921 $1,500,000 to $1,999,99928 $2,000,000 or moreRent paid by renters in 2022 in Morgantown, WV 17 $150 to $199127 $200 to $24910 $300 to $34952 $350 to $399183 $400 to $449150 $450 to $499315 $500 to $549817 $550 to $599875 $600 to $649535 $650 to $699336 $700 to $749664 $750 to $799676 $800 to $899874 $900 to $999575 $1,000 to $1,249300 $1,250 to $1,49986 $1,500 to $1,99972 $2,000 to $2,499153 $3,500 or more163 No cash rent
Percentage of workers working in this county: 91.0%Number of people working at home: 2,448 (17.3% of all workers )
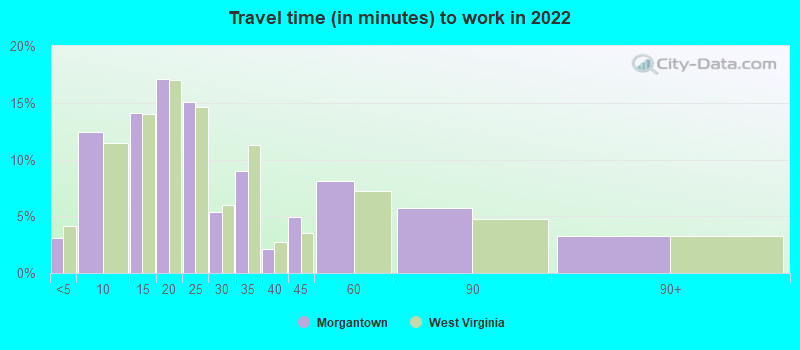
Travel time to work (commute)
Less than 5 minutes: 5365 to 9 minutes: 2,90410 to 14 minutes: 3,47215 to 19 minutes: 2,37220 to 24 minutes: 1,21725 to 29 minutes: 38030 to 34 minutes: 66535 to 39 minutes: 10340 to 44 minutes: 20945 to 59 minutes: 27060 to 89 minutes: 8390 or more minutes: 118
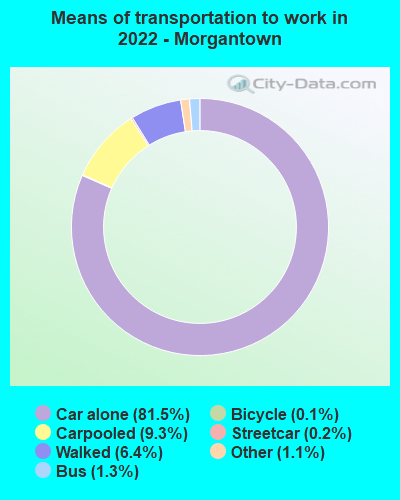
Means of transportation to work:
Drove a car alone: 23,812 (75.0%)Carpooled: 2,710 (8.5%)Bus : 357 (1.1%)Subway or elevated rail : 66 (0.2%)Light rail, streetcar or trolley : 8 (0.0%)Taxi: 364 (1.1%)Bicycle: 16 (0.1%)Walked: 1,751 (5.5%)Worked at home: 2,448 (7.7%)
Unemployment by race in 2022
Unemployment rate for White non-Hispanic residents 9.8% Males6.9% FemalesUnemployment rate for Black residents 12.2% MalesUnemployment rate for two or more race residents 14.5% MalesUnemployment rate for Hispanic or Latino residents 4.4% Females
Year of entry for the foreign-born population in Morgantown, West Virginia
1,310 2010 or later 583 2000 to 2009 155 1990 to 1999 153 1980 to 1989 58 1970 to 1979 178 Before 1970
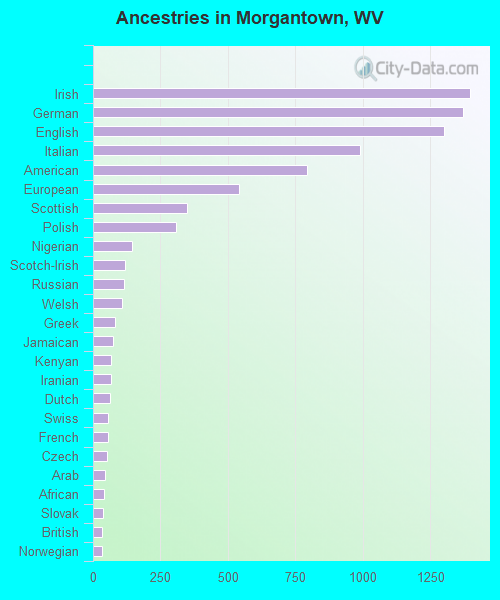
First ancestries reported:
Irish: 1,398 (12.4%)
German: 1,372 (12.2%)
English: 1,300 (11.6%)
Italian: 988 (8.8%)
American: 794 (7.1%)
European: 541 (4.8%)
Scottish: 350 (3.1%)
Polish: 306 (2.7%)
Nigerian: 146 (1.3%)
Scotch-Irish: 119 (1.1%)
Russian: 115 (1.0%)
Welsh: 107 (1.0%)
Greek: 80 (0.7%)
Jamaican: 74 (0.7%)
Kenyan: 66 (0.6%)
Iranian: 65 (0.6%)
Dutch: 62 (0.6%)
Swiss: 56 (0.5%)
French: 55 (0.5%)
Czech: 51 (0.5%)
Arab: 45 (0.4%)
African: 40 (0.4%)
Slovak: 38 (0.3%)
British: 35 (0.3%)
Norwegian: 33 (0.3%)
Swedish: 33 (0.3%)
Danish: 31 (0.3%)
Yugoslavian: 30 (0.3%)
Haitian: 29 (0.3%)
Belgian: 24 (0.2%)
Lithuanian: 22 (0.2%)
Palestinian: 22 (0.2%)
Eastern European: 21 (0.2%)
Scandinavian: 16 (0.1%)
Serbian: 16 (0.1%)
Ukrainian: 15 (0.1%)
French Canadian: 13 (0.1%)
Canadian: 13 (0.1%)
Portuguese: 12 (0.1%)
Syrian: 12 (0.1%)
Egyptian: 8 (0.07%)
Slavic: 7 (0.06%)
Jordanian: 4 (0.04%) Most common places of birth for foreign-born residents (%): Kuwait Morgantown:
20.8% (413)West Virginia:
2.0% (571)
Vietnam Morgantown:
10.0% (199)West Virginia:
3.0% (877)
Germany Morgantown:
6.9% (138)West Virginia:
5.5% (1,585)
Nigeria Morgantown:
6.7% (134)West Virginia:
2.4% (705)
Honduras Morgantown:
6.1% (121)West Virginia:
1.3% (381)
Philippines Morgantown:
5.4% (107)West Virginia:
6.2% (1,798)
India Morgantown:
5.2% (103)West Virginia:
7.2% (2,098)
China, excluding Hong Kong and Taiwan Morgantown:
4.5% (89)West Virginia:
5.8% (1,673)
El Salvador Morgantown:
4.5% (89)West Virginia:
2.5% (737)
Iran Morgantown:
3.2% (64)West Virginia:
0.7% (196)
Kenya Morgantown:
3.0% (60)West Virginia:
0.2% (63)
South Africa Morgantown:
2.3% (45)West Virginia:
0.5% (145)
United Arab Emirates Morgantown:
2.2% (44)West Virginia:
0.2% (49)
Russia Morgantown:
2.1% (41)West Virginia:
0.9% (250)
Saudi Arabia Morgantown:
2.0% (40)West Virginia:
1.2% (335)
Colombia Morgantown:
2.0% (39)West Virginia:
0.8% (235)
Taiwan Morgantown:
1.9% (38)West Virginia:
0.7% (202)
Japan Morgantown:
1.6% (32)West Virginia:
2.2% (642)
Nepal Morgantown:
1.6% (31)West Virginia:
0.7% (195)
Place of birth for U.S.-born residents:
This state: 13,470Other state: 14,739Northeast: 4,550Midwest: 3,113South: 5,951West: 1,152 61.0% of Morgantown residents lived in the same house 1 years ago.
Out of people who lived in different houses, 22.2% lived in this county.
Out of people who lived in different counties, 32.8% lived in West Virginia.
Morgantown:
61.0%State average:
89.6%
Education attainment for males 25 years and older:
No schooling: 10Nursery to 4th grade: 05th and 6th grade: 1007th and 8th grade: 09th grade: 1110th grade: 2811th grade: 11812th grade, no diploma: 40High school graduate (or equivalency): 1,547Less than 1 year of college: 288Some college more than 1 year, no degree: 920Associate degree: 275Bachelor's degree: 1,886Master's degree: 1,320Professional school degree: 307Doctorate degree: 636
Education attainment for females 25 years and older:
No schooling: 26Nursery to 4th grade: 95th and 6th grade: 1277th and 8th grade: 89th grade: 010th grade: 5411th grade: 3412th grade, no diploma: 144High school graduate (or equivalency): 1,185Less than 1 year of college: 236Some college more than 1 year, no degree: 231Associate degree: 409Bachelor's degree: 1,897Master's degree: 1,528Professional school degree: 319Doctorate degree: 565
Housing units in structures:
One, detached: 6,425One, attached: 358Two: 1,3473 or 4: 1,7255 to 9: 1,11710 to 19: 73620 to 49: 89050 or more: 1,233Mobile homes: 257Median worth of mobile homes: $19,103
Housing units lacking complete plumbing facilities in 2022: 1.8%Housing units lacking complete kitchen facilities in 2022: 2.0%House/condo owner moved in on average 12 years ago
Renter moved in on average 1 years ago
Private vs. public school enrollment:
Students in private schools in grades 1 to 8 (elementary and middle school): 120 Here:
9.8%West Virginia:
12.2%
Students in private schools in grades 9 to 12 (high school): 140 Here:
28.2%West Virginia:
8.8%
Students in private undergraduate colleges: 318 Here:
3.1%West Virginia:
17.3%