Jump to a detailed profile or search site with Google Custom Search

Montgomery Village, MD (Maryland) Houses and Residents

Estimated median house or condo value in 2022: $369,922 (it was $139,500 in 2000)
Montgomery Village:

$369,922
Maryland:

$398,100
Lower value quartile - upper value quartile: $273,087 - $473,974

Mean price in 2022:

Detached houses: $524,247
Here:

$524,247
State:

$526,819

Townhouses or other attached units: $334,241
Here:

$334,241
State:

$328,305

In 3-to-4-unit structures: $159,933
Here:

$159,933
State:

$295,378

In 5-or-more-unit structures: $222,009
Here:

$222,009
State:

$350,378

Total population: 32,032 (All urban)

Houses: 12,845 (12,228 occupied: 8,241 owner occupied, 4,079 renter occupied)

% of renters here:

33%
State:

32%

Housing density: 1,983 houses/condos per square mile

Median price asked for vacant for-sale houses and condos in 2022: $341,198.

Median contract rent in 2022: $1,612 (lower quartile is $1,331, upper quartile is $1,840)


Median rent asked for vacant for-rent units in 2022: $1,525


Median gross rent in Montgomery Village, MD in 2022: $1,716

Housing units in Montgomery Village with a mortgage: 6,528 (599 second mortgage, 54 home equity loan, 340 both second mortgage and home equity loan)
Houses without a mortgage: 115

Median household income for houses/condos with a mortgage: $120,752

Median household income for apartments without a mortgage: $84,115

Median monthly housing costs: $1,744

Compare current foreclosures in Montgomery Village, MD:

Check out more offers in Montgomery Village, MD.
Powered by Foreclosure.com

Settings
X
Data:
Loading data...
Based on 2000-2022 data
Loading data...

123
Hide US histogram

Montgomery Village, Maryland Age and Sex of Residents
Median year house/condo built: 1981

Median year apartment built: 1985

Household type by relationship:

Households: 34,603
  • Male householders: 6,165 (1,189 living alone), Female householders: 5,916 (1,871 living alone)
  • 5,855 spouses (5,795 opposite-sex spouses), 755 unmarried partners, (743 opposite-sex unmarried partners), 10,331 children (9,577 natural, 147 adopted, 607 stepchildren), 1,226 grandchildren, 671 brothers or sisters, 1,265 parents, 0 foster children, 953 other relatives, 1,269 non-relatives
  • In group quarters: 192

Size of family households: 2,610 2-persons, 2,233 3-persons, 1,797 4-persons, 1,047 5-persons, 346 6-persons, 141 7-or-more-persons.

Size of nonfamily households: 3,495 1-person, 490 2-persons, 150 3-persons, 12 4-persons.

4,957 married couples with children.
1,709 single-parent households (717 men, 992 women).

46.7% of residents of Montgomery Village speak English at home.
30.9% of residents speak Spanish at home (50% speak English very well, 22% speak English well, 21% speak English not well, 6% don't speak English at all).
10.1% of residents speak other Indo-European language at home (63% speak English very well, 32% speak English well, 4% speak English not well, 1% don't speak English at all).
6.7% of residents speak Asian or Pacific Island language at home (52% speak English very well, 20% speak English well, 25% speak English not well, 3% don't speak English at all).
5.1% of residents speak other language at home (66% speak English very well, 24% speak English well, 9% speak English not well).

Foreign born population: 12,197 (35.2%)
(53.4% of them are naturalized citizens)

Median number of rooms in houses and condos:
Here:

6.7
State:

7.3

Median number of rooms in apartments
Here:

4.2
State:

4.2

Owner-occupied Renter-occupied
Bedrooms in owner-occupied houses and condos in Montgomery Village, Maryland
  • Bedrooms in owner-occupied houses and condos in Montgomery Village, Maryland
  • 45no bedroom
  • 2311 bedroom
  • 8592 bedrooms
  • 3,9913 bedrooms
  • 2,3564 bedrooms
  • 7605+ bedrooms
Bedrooms in renter-occupied apartments in Montgomery Village, Maryland
  • Bedrooms in renter-occupied apartments in Montgomery Village, Maryland
  • 127no bedroom
  • 1,0561 bedroom
  • 1,6862 bedrooms
  • 8513 bedrooms
  • 3404 bedrooms
  • 195+ bedrooms
Owner-occupied Renter-occupied
Cars and other vehicles available in Montgomery Village in owner-occupied houses/condos
  • Cars and other vehicles available in Montgomery Village in owner-occupied houses/condos
  • 99no vehicle
  • 2,6501 vehicle
  • 3,6782 vehicles
  • 1,2093 vehicles
  • 5024 vehicles
  • 1065+ vehicles
Cars and other vehicles available in Montgomery Village in renter-occupied apartments
  • Cars and other vehicles available in Montgomery Village in renter-occupied apartments
  • 661no vehicle
  • 1,9411 vehicle
  • 9952 vehicles
  • 3883 vehicles
  • 534 vehicles
  • 425+ vehicles
Owner-occupied Renter-occupied
Rooms in owner-occupied houses in Montgomery Village, Maryland
  • Rooms in owner-occupied houses in Montgomery Village, Maryland
  • 371 room
  • 602 rooms
  • 2253 rooms
  • 6604 rooms
  • 1,3705 rooms
  • 1,5106 rooms
  • 9947 rooms
  • 1,2828 rooms
  • 2,1039+ rooms
Rooms in renter-occupied apartments in Montgomery Village, Maryland
  • Rooms in renter-occupied apartments in Montgomery Village, Maryland
  • 751 room
  • 2862 rooms
  • 8233 rooms
  • 1,2024 rooms
  • 7285 rooms
  • 5836 rooms
  • 1437 rooms
  • 1008 rooms
  • 1399+ rooms
Year house built
Median 2022 house/condo value by year built
Median house/condo value by year householder moved into unit
Breakdown of mean house values by ages of householders
Owners and renters by unit type in Montgomery Village, MD
  • Montgomery Village, MD household income distribution

  • Distribution of median household income in Montgomery Village, MD in 2022
  • 514Less than $10,000
  • 687$10,000 to $19,999
  • 457$20,000 to $29,999
  • 819$30,000 to $39,999
  • 879$40,000 to $49,999
  • 769$50,000 to $59,999
  • 1,178$60,000 to $74,999
  • 1,749$75,000 to $99,999
  • 1,315$100,000 to $124,999
  • 984$125,000 to $149,999
  • 1,153$150,000 to $199,999
  • 1,973$200,000 or more
  • Home value of owner - occupied houses in 2022 in Montgomery Village, MD

  • Distribution of house value in Montgomery Village, MD in 2022
  • 107Less than $10,000
  • 16$10,000 to $14,999
  • 21$20,000 to $24,999
  • 69$25,000 to $29,999
  • 88$30,000 to $34,999
  • 27$35,000 to $39,999
  • 3$50,000 to $59,999
  • 13$60,000 to $69,999
  • 8$90,000 to $99,999
  • 138$100,000 to $124,999
  • 83$125,000 to $149,999
  • 234$150,000 to $174,999
  • 149$175,000 to $199,999
  • 619$200,000 to $249,999
  • 1,160$250,000 to $299,999
  • 2,205$300,000 to $399,999
  • 1,207$400,000 to $499,999
  • 1,532$500,000 to $749,999
  • 85$750,000 to $999,999
  • 20$1,000,000 to $1,499,999
  • 19$2,000,000 or more
  • Rent paid by renters in 2022 in Montgomery Village, MD

  • Distribution of rent paid by renters in Montgomery Village, MD in 2022
  • 6Less than $100
  • 10$250 to $299
  • 93$300 to $349
  • 26$550 to $599
  • 149$700 to $749
  • 45$800 to $899
  • 30$900 to $999
  • 206$1,000 to $1,249
  • 971$1,250 to $1,499
  • 1,972$1,500 to $1,999
  • 532$2,000 to $2,499
  • 48$2,500 to $2,999
  • 50$3,000 to $3,499
  • 23$3,500 or more
  • 33No cash rent
Time Leaving Home To Go To Work in 2022

Percentage of workers working in this county: 84.2%
Number of people working at home: 2,976 (16.8% of all workers)

Travel time (in minutes) to work in 2022

Travel time to work (commute)

  • Less than 5 minutes: 197
  • 5 to 9 minutes: 822
  • 10 to 14 minutes: 1,437
  • 15 to 19 minutes: 2,129
  • 20 to 24 minutes: 1,792
  • 25 to 29 minutes: 935
  • 30 to 34 minutes: 1,850
  • 35 to 39 minutes: 518
  • 40 to 44 minutes: 645
  • 45 to 59 minutes: 1,415
  • 60 to 89 minutes: 1,788
  • 90 or more minutes: 554
Means of transportation to work in 2022 - Montgomery Village

Means of transportation to work:

  • Drove a car alone: 3,018 (47.0%)
  • Carpooled: 324 (5.0%)
  • Bus: 243 (3.8%)
  • Subway or elevated rail: 22 (0.3%)
  • Taxi: 34 (0.5%)
  • Bicycle: 14 (0.2%)
  • Walked: 83 (1.3%)
  • Worked at home: 2,976 (46.3%)
Class of Workers in 2022
  • Unemployment by race in 2022
  • Unemployment rate for White non-Hispanic residents
  • 8.1%Males
  • 1.9%Females
  • Unemployment rate for Black residents
  • 6.2%Males
  • 8.9%Females
  • Unemployment rate for Asian residents
  • 2.7%Males
  • 3.1%Females
  • Unemployment rate for other race residents
  • 2.1%Males
  • 4.0%Females
  • Unemployment rate for two or more race residents
  • 1.3%Males
  • 3.9%Females
  • Unemployment rate for Hispanic or Latino residents
  • 2.8%Males
  • 10.1%Females
Year of entry for the foreign-born population in Montgomery Village, Maryland
  • Year of entry for the foreign-born population in Montgomery Village, Maryland
  • 3,5992010 or later
  • 3,8102000 to 2009
  • 2,4061990 to 1999
  • 2,9891980 to 1989
  • 1,3461970 to 1979
  • 929Before 1970
Ancestries in Montgomery Village, MD

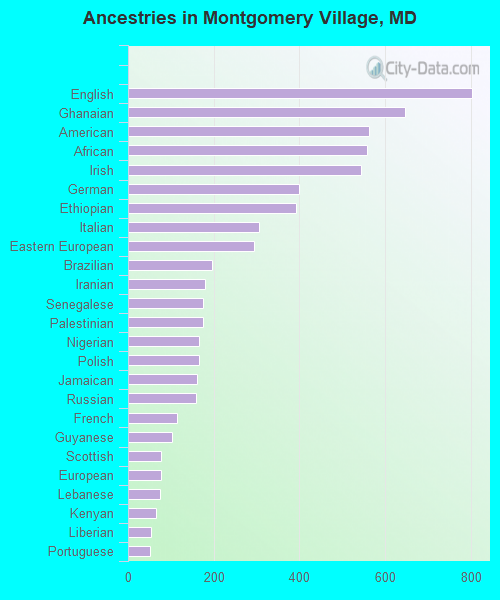
First ancestries reported:

  • English: 802 (3.5%)
  • Ghanaian: 647 (2.8%)
  • American: 563 (2.5%)
  • African: 557 (2.4%)
  • Irish: 544 (2.4%)
  • German: 398 (1.7%)
  • Ethiopian: 392 (1.7%)
  • Italian: 306 (1.3%)
  • Eastern European: 294 (1.3%)
  • Brazilian: 195 (0.8%)
  • Iranian: 179 (0.8%)
  • Senegalese: 175 (0.8%)
  • Palestinian: 174 (0.8%)
  • Nigerian: 165 (0.7%)
  • Polish: 165 (0.7%)
  • Jamaican: 160 (0.7%)
  • Russian: 158 (0.7%)
  • French: 114 (0.5%)
  • Guyanese: 103 (0.4%)
  • Scottish: 77 (0.3%)
  • European: 76 (0.3%)
  • Lebanese: 74 (0.3%)
  • Kenyan: 65 (0.3%)
  • Liberian: 54 (0.2%)
  • Portuguese: 51 (0.2%)
  • Romanian: 49 (0.2%)
  • Arab: 47 (0.2%)
  • Ukrainian: 43 (0.2%)
  • Greek: 42 (0.2%)
  • Bulgarian: 41 (0.2%)
  • South African: 40 (0.2%)
  • Turkish: 35 (0.2%)
  • Haitian: 31 (0.1%)
  • West Indian: 31 (0.1%)
  • Dutch: 24 (0.1%)
  • Scotch-Irish: 24 (0.1%)
  • Trinidadian and Tobagonian: 19 (0.08%)
  • Lithuanian: 18 (0.08%)
  • Armenian: 17 (0.07%)
  • Czech: 15 (0.07%)
  • Swedish: 15 (0.07%)
  • Egyptian: 14 (0.06%)
  • Hungarian: 10 (0.04%)
  • Ugandan: 10 (0.04%)
  • Bermudan: 9 (0.04%)
  • Czechoslovakian: 6 (0.03%)
  • Canadian: 6 (0.03%)
  • British West Indian: 6 (0.03%)
  • Israeli: 4 (0.02%)
  • French Canadian: 3 (0.01%)
  • Croatian: 3 (0.01%)
  • Moroccan: 2 (0.01%)

Most common places of birth for foreign-born residents (%):

El Salvador
Montgomery Village:

17.4% (2,124)
Maryland:

12.0% (115,412)

Honduras
Montgomery Village:

12.4% (1,512)
Maryland:

2.5% (24,026)

India
Montgomery Village:

6.9% (838)
Maryland:

6.4% (61,725)

Philippines
Montgomery Village:

4.9% (596)
Maryland:

3.8% (36,698)

Guatemala
Montgomery Village:

4.1% (499)
Maryland:

4.4% (42,350)

Nicaragua
Montgomery Village:

3.5% (421)
Maryland:

0.6% (5,899)

Mexico
Montgomery Village:

3.1% (378)
Maryland:

3.5% (34,065)

Indonesia
Montgomery Village:

3.0% (371)
Maryland:

0.3% (2,631)

Peru
Montgomery Village:

2.6% (322)
Maryland:

1.8% (17,161)

Cameroon
Montgomery Village:

2.3% (282)
Maryland:

2.5% (23,969)

Ghana
Montgomery Village:

2.2% (271)
Maryland:

1.8% (17,774)

Bangladesh
Montgomery Village:

2.1% (261)
Maryland:

0.7% (7,124)

China, excluding Hong Kong and Taiwan
Montgomery Village:

2.0% (245)
Maryland:

4.6% (44,742)

Ethiopia
Montgomery Village:

2.0% (240)
Maryland:

3.2% (30,870)

Bolivia
Montgomery Village:

1.9% (236)
Maryland:

0.7% (7,000)

Brazil
Montgomery Village:

1.8% (217)
Maryland:

1.2% (11,980)

Venezuela
Montgomery Village:

1.5% (189)
Maryland:

0.5% (4,901)

Nigeria
Montgomery Village:

1.5% (187)
Maryland:

4.6% (44,825)

Ecuador
Montgomery Village:

1.5% (187)
Maryland:

0.6% (6,211)

Nepal
Montgomery Village:

1.5% (185)
Maryland:

1.1% (10,205)

Place of birth for U.S.-born residents:

  • This state: 11,137
  • Other state: 10,778
  • Northeast: 4,297
  • Midwest: 1,286
  • South: 4,436
  • West: 576

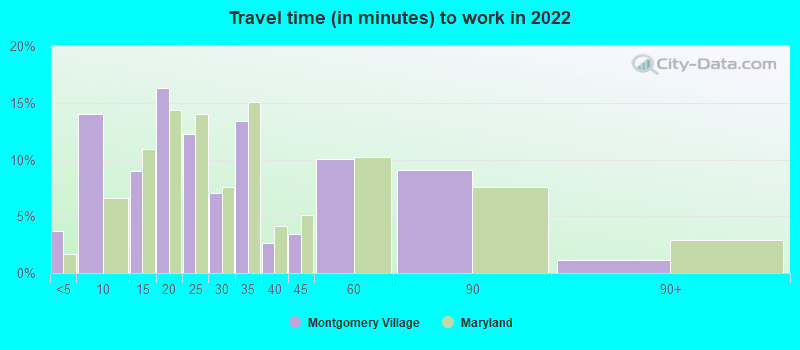
89.9% of Montgomery Village residents lived in the same house 1 years ago.
   Out of people who lived in different houses, 39.4% lived in this county.
   Out of people who lived in different counties, 40.7% lived in Maryland.


Montgomery Village:

89.9%
State average:

88.5%

Education attainment for males 25 years and older:

  • No schooling: 514
  • Nursery to 4th grade: 34
  • 5th and 6th grade: 341
  • 7th and 8th grade: 41
  • 9th grade: 36
  • 10th grade: 51
  • 11th grade: 64
  • 12th grade, no diploma: 192
  • High school graduate (or equivalency): 2,265
  • Less than 1 year of college: 647
  • Some college more than 1 year, no degree: 1,493
  • Associate degree: 856
  • Bachelor's degree: 2,824
  • Master's degree: 1,503
  • Professional school degree: 286
  • Doctorate degree: 397
Educational Attainment for Males

Education attainment for females 25 years and older:

  • No schooling: 506
  • Nursery to 4th grade: 212
  • 5th and 6th grade: 157
  • 7th and 8th grade: 62
  • 9th grade: 71
  • 10th grade: 51
  • 11th grade: 97
  • 12th grade, no diploma: 353
  • High school graduate (or equivalency): 2,789
  • Less than 1 year of college: 549
  • Some college more than 1 year, no degree: 1,132
  • Associate degree: 793
  • Bachelor's degree: 2,713
  • Master's degree: 1,813
  • Professional school degree: 419
  • Doctorate degree: 271
Educational Attainment for Females
Montgomery Village marital status for males
Montgomery Village marital status for females

Housing units in structures:

  • One, detached: 2,802
  • One, attached: 6,539
  • Two: 19
  • 3 or 4: 226
  • 5 to 9: 726
  • 10 to 19: 1,509
  • 20 to 49: 262
  • 50 or more: 723
  • Mobile homes: 35
Housing units lacking complete plumbing facilities in 2022: 0.7%

Housing units lacking complete kitchen facilities in 2022: 0.4%

House/condo owner moved in on average 10 years ago

Renter moved in on average 4 years ago

Year householders moved into residence in Montgomery Village
Houses and condos Apartments
Most commonly used house heating fuel in houses and condos in Montgomery Village, MD
  • 70.8%Electricity
  • 23.8%Utility gas
  • 2.6%Fuel oil, kerosene, etc.
  • 1.6%Bottled, tank, or LP gas
  • 1.1%No fuel used
  • 0.2%Solar energy
Most commonly used house heating fuel in apartments in Montgomery Village, MD
  • 69.8%Electricity
  • 26.6%Utility gas
  • 1.3%No fuel used
  • 1.2%Bottled, tank, or LP gas
  • 0.6%Other fuel
  • 0.4%Fuel oil, kerosene, etc.

Private vs. public school enrollment:

Students in private schools in grades 1 to 8 (elementary and middle school): 241
Here:

8.3%
Maryland:

15.2%

Students in private schools in grades 9 to 12 (high school): 130
Here:

7.0%
Maryland:

14.4%

Students in private undergraduate colleges: 166
Here:

10.4%
Maryland:

20.2%
School Enrollment by Level of School for Male Students
School Enrollment by Level of School for Female Students
Age and Sex of Sensory-Disabled Noninstitutionalized Residents
Age and Sex of Physically-Disabled Noninstitutionalized Residents
Age and Sex of Mentally-Disabled Noninstitutionalized Residents
Age and Sex of Self-Care Disabled Noninstitutionalized Residents
Age and Sex of Go-Outside-Home Disabled Noninstitutionalized Residents
Age and Sex of Noninstitutionalized Residents with Employment Disability