Montclair, CA (California) Houses and Residents
Estimated median house or condo value in 2022: $558,640 (it was $132,100 in 2000 )
Montclair:
$558,640California:
$715,900
Lower value quartile - upper value quartile: $427,496 - $694,822Mean price in 2022: Detached houses: $558,560 Here:
$558,560State:
$988,808
Townhouses or other attached units: $701,253 Here:
$701,253State:
$838,546
In 2-unit structures: $544,650 Here:
$544,650State:
$1,138,100
In 3-to-4-unit structures: $403,488 Here:
$403,488State:
$824,253
In 5-or-more-unit structures: $350,498 Here:
$350,498State:
$730,996
Mobile homes: $111,388 Here:
$111,388State:
$184,506
Occupied boats, RVs, vans, etc.: $89,746 Here:
$89,746State:
$204,957
Total population: 38,465 (Urban population: 33,119, Rural population: 0)
Houses: 10,485 (10,261 occupied: 5,622 owner occupied, 4,733 renter occupied )
% of renters here:
46%State:
44%
Housing density: 2,057 houses/condos per square mile
Median price asked for vacant for-sale houses and condos in 2022: $1,025,275.
Median contract rent in 2022: $1,634 (lower quartile is $1,207, upper quartile is $1,982)
Median rent asked for vacant for-rent units in 2022: $1,755
Median gross rent in Montclair, CA in 2022: $1,783
Housing units in Montclair with a mortgage: 3,818 (290 second mortgage, 5 home equity loan, 210 both second mortgage and home equity loan )Houses without a mortgage: 34
Median household income for houses/condos with a mortgage: $104,944
Median household income for apartments without a mortgage: $70,290
Median monthly housing costs: $1,664
Data:
Median house or condo value ($)
Median house or condo value ($ change since 2000)
Median house or condo value ($) - White
Median house or condo value ($) - Black or African American
Median house or condo value ($) - Asian
Median house or condo value ($) - Hispanic or Latino
Median house or condo value ($) - American Indian and Alaska Native
Median house or condo value ($) - Multirace
Median house or condo value ($) - Other Race
Median price asked for mobile homes ($)
Household density (households per square mile)
Mean house or condo value by units in structure - 1, detached ($)
Mean house or condo value by units in structure - 1, attached ($)
Mean house or condo value by units in structure - 2 ($)
Mean house or condo value by units in structure by units in structure - 3 or 4 ($)
Mean house or condo value by units in structure - 5 or more ($)
Mean house or condo value by units in structure - Boat, RV, van, etc. ($)
Mean house or condo value by units in structure - Mobile home ($)
Median contract rent ($)
Median contract rent - Lower quartile ($)
Median contract rent - Upper quartile ($)
Median gross rent ($)
Urban houses (%)
Rural houses (%)
Houses occupied (%)
Houses occupied (% change since 2000)
Houses owner occupied (%)
Houses owner occupied (% change since 2000)
Houses renter occupied (%)
Houses renter occupied (% change since 2000)
Vacant housing units - For rent (%)
Vacant housing units - For rent (% change since 2000)
Vacant housing units - For sale only (%)
Vacant housing units - For sale only (% change since 2000)
Vacant housing units - Rented or sold, not occupied (%)
Vacant housing units - Rented or sold, not occupied (% change since 2000)
Vacant housing units - For seasonal, recreational, or occasional use (%)
Vacant housing units - For seasonal, recreational, or occasional use (% change since 2000)
Vacant housing units - For migrant workers (%)
Vacant housing units - For migrant workers (% change since 2000)
Vacant housing units - Other vacant (%)
Vacant housing units - Other vacant (% change since 2000)
Median monthly housing costs ($)
Median household income for houses/condos with a mortgage ($)
Median household income for houses/condos without a mortgage ($)
Median household income ($)
Median household income ($) - White
Median household income ($) - Black or African American
Median household income ($) - Asian
Median household income ($) - Hispanic or Latino
Median household income ($) - American Indian and Alaska Native
Median household income ($) - Multirace
Median household income ($) - Other Race
Mortgage status - with mortgage (%)
Mortgage status - with second mortgage (%)
Mortgage status - with home equity loan (%)
Mortgage status - with both second mortgage and home equity loan (%)
Mortgage status - without a mortgage (%)
Median year house/condo built
Median year apartment built
Household type by relationship - Male householder living alone (%)
Household type by relationship - Male householder not living alone (%)
Household type by relationship - Female householder living alone (%)
Household type by relationship - Female householder not living alone (%)
Household type by relationship - Opposite-Sex spouse (%)
Household type by relationship - Same-Sex spouse (%)
Household type by relationship - Opposite-Sex unmarried partner (%)
Household type by relationship - Same-Sex unmarried partner (%)
Household type by relationship - In group quarters (%)
Size of family households - 2-person household (%)
Size of family households - 3-person household (%)
Size of family households - 4-person household (%)
Size of family households - 5-person household (%)
Size of family households - 6-person household (%)
Size of family households - 7-or-more-person household (%)
Size of nonfamily households - 1-person household (%)
Size of nonfamily households - 2-person household (%)
Size of nonfamily households - 3-person household (%)
Size of nonfamily households - 4-person household (%)
Size of nonfamily households - 5-person household (%)
Size of nonfamily households - 6-person household (%)
Size of nonfamily households - 7-or-moreperson household (%)
Year house built - Built 2010 or later (%)
Year house built - Built 2000 to 2009 (%)
Year house built - Built 1990 to 1999 (%)
Year house built - Built 1980 to 1989 (%)
Year house built - Built 1970 to 1979 (%)
Year house built - Built 1960 to 1969 (%)
Year house built - Built 1950 to 1959 (%)
Year house built - Built 1940 to 1949 (%)
Year house built - Built 1939 or earlier (%)
Median number of rooms in houses and condos
Median number of rooms in apartments
Median number of bedrooms in owner occupied houses
Mean number of bedrooms in owner occupied houses
Median number of bedrooms in renter occupied houses
Mean number of bedrooms in renter occupied houses
Median number of vehichles in owner occupied houses
Mean number of vehichles in owner occupied houses
Median number of vehichles in renter occupied houses
Mean number of vehichles in renter occupied houses
Rooms in owner-occupied houses - 1 room (%)
Rooms in owner-occupied houses - 2 rooms (%)
Rooms in owner-occupied houses - 3 rooms (%)
Rooms in owner-occupied houses - 4 rooms (%)
Rooms in owner-occupied houses - 5 rooms (%)
Rooms in owner-occupied houses - 6 rooms (%)
Rooms in owner-occupied houses - 7 rooms (%)
Rooms in owner-occupied houses - 8 rooms (%)
Rooms in owner-occupied houses - 9+ rooms (%)
Rooms in renter-occupied houses - 1 room (%)
Rooms in renter-occupied houses - 2 rooms (%)
Rooms in renter-occupied houses - 3 rooms (%)
Rooms in renter-occupied houses - 4 rooms (%)
Rooms in renter-occupied houses - 5 rooms (%)
Rooms in renter-occupied houses - 6 rooms (%)
Rooms in renter-occupied houses - 7 rooms (%)
Rooms in renter-occupied houses - 8 rooms (%)
Rooms in renter-occupied houses - 9+ rooms (%)
Bedrooms in owner-occupied houses - no bedrooms (%)
Bedrooms in owner-occupied houses - 1 bedroom (%)
Bedrooms in owner-occupied houses - 2 bedrooms (%)
Bedrooms in owner-occupied houses - 3 bedrooms (%)
Bedrooms in owner-occupied houses - 4 bedrooms (%)
Bedrooms in owner-occupied houses - 5+ bedrooms (%)
Bedrooms in renter-occupied houses - no bedrooms (%)
Bedrooms in renter-occupied houses - 1 bedroom (%)
Bedrooms in renter-occupied houses - 2 bedrooms (%)
Bedrooms in renter-occupied houses - 3 bedrooms (%)
Bedrooms in renter-occupied houses - 4 bedrooms (%)
Bedrooms in renter-occupied houses - 5+ bedrooms (%)
Vehicles available in owner-occupied houses - no vehicle available (%)
Vehicles available in owner-occupied houses - 1 vehicle available(%)
Vehicles available in owner-occupied houses - 2 Vehicles available (%)
Vehicles available in owner-occupied houses - 3 Vehicles available (%)
Vehicles available in owner-occupied houses - 4 Vehicles available (%)
Vehicles available in owner-occupied houses - 5+ Vehicles available (%)
Vehicles available in renter-occupied houses - no vehicle available (%)
Vehicles available in renter-occupied houses - 1 vehicle available (%)
Vehicles available in renter-occupied houses - 2 Vehicles available (%)
Vehicles available in renter-occupied houses - 3 Vehicles available (%)
Vehicles available in renter-occupied houses - 4 Vehicles available (%)
Vehicles available in renter-occupied houses - 5+ Vehicles available (%)
Housing units in structures - 1, detached (%)
Housing units in structures - 1, attached (%)
Housing units in structures - 2 (%)
Housing units in structures - 3 or 4 (%)
Housing units in structures - 5 to 9 (%)
Housing units in structures - 10 to 19 (%)
Housing units in structures - 20 to 49 (%)
Housing units in structures - 50 or more (%)
Housing units in structures - Mobile home (%)
Housing units in structures - Boat, RV, van, etc. (%)
Housing units in structures - Owners - 1, detached (%)
Housing units in structures - Owners - 1, attached (%)
Housing units in structures - Owners - 2 (%)
Housing units in structures - Owners - 3 or 4 (%)
Housing units in structures - Owners - 5 to 9 (%)
Housing units in structures - Owners - 10 to 19 (%)
Housing units in structures - Owners - 20 to 49 (%)
Housing units in structures - Owners - 50 or more (%)
Housing units in structures - Owners - Mobile home (%)
Housing units in structures - Owners - Boat, RV, van, etc. (%)
Housing units in structures - Renters - 1, detached (%)
Housing units in structures - Renters - 1, attached (%)
Housing units in structures - Renters - 2 (%)
Housing units in structures - Renters - 3 or 4 (%)
Housing units in structures - Renters - 5 to 9 (%)
Housing units in structures - Renters - 10 to 19 (%)
Housing units in structures - Renters - 20 to 49 (%)
Housing units in structures - Renters - 50 or more (%)
Housing units in structures - Renters - Mobile home (%)
Housing units in structures - Renters - Boat, RV, van, etc. (%)
House/condo owner moved in on average (years ago)
Renter moved in on average (years ago)
Year householder moved into unit - Moved in 1999 to March 2000 (%)
Year householder moved into unit - Moved in 1999 to March 2000 (%) - White
Year householder moved into unit - Moved in 1999 to March 2000 (%) - Black or African American
Year householder moved into unit - Moved in 1999 to March 2000 (%) - Asian
Year householder moved into unit - Moved in 1999 to March 2000 (%) - Hispanic or Latino
Year householder moved into unit - Moved in 1999 to March 2000 (%) - American Indian and Alaska Native
Year householder moved into unit - Moved in 1999 to March 2000 (%) - Multirace
Year householder moved into unit - Moved in 1999 to March 2000 (%) - Other Race
Year householder moved into unit - Moved in 1995 to 1998 (%)
Year householder moved into unit - Moved in 1995 to 1998 (%) - White
Year householder moved into unit - Moved in 1995 to 1998 (%) - Black or African American
Year householder moved into unit - Moved in 1995 to 1998 (%) - Asian
Year householder moved into unit - Moved in 1995 to 1998 (%) - Hispanic or Latino
Year householder moved into unit - Moved in 1995 to 1998 (%) - American Indian and Alaska Native
Year householder moved into unit - Moved in 1995 to 1998 (%) - Multirace
Year householder moved into unit - Moved in 1995 to 1998 (%) - Other Race
Year householder moved into unit - Moved in 1990 to 1994 (%)
Year householder moved into unit - Moved in 1990 to 1994 (%) - White
Year householder moved into unit - Moved in 1990 to 1994 (%) - Black or African American
Year householder moved into unit - Moved in 1990 to 1994 (%) - Asian
Year householder moved into unit - Moved in 1990 to 1994 (%) - Hispanic or Latino
Year householder moved into unit - Moved in 1990 to 1994 (%) - American Indian and Alaska Native
Year householder moved into unit - Moved in 1990 to 1994 (%) - Multirace
Year householder moved into unit - Moved in 1990 to 1994 (%) - Other Race
Year householder moved into unit - Moved in 1980 to 1989 (%)
Year householder moved into unit - Moved in 1980 to 1989 (%) - White
Year householder moved into unit - Moved in 1980 to 1989 (%) - Black or African American
Year householder moved into unit - Moved in 1980 to 1989 (%) - Asian
Year householder moved into unit - Moved in 1980 to 1989 (%) - Hispanic or Latino
Year householder moved into unit - Moved in 1980 to 1989 (%) - American Indian and Alaska Native
Year householder moved into unit - Moved in 1980 to 1989 (%) - Multirace
Year householder moved into unit - Moved in 1980 to 1989 (%) - Other Race
Year householder moved into unit - Moved in 1970 to 1979 (%)
Year householder moved into unit - Moved in 1970 to 1979 (%) - White
Year householder moved into unit - Moved in 1970 to 1979 (%) - Black or African American
Year householder moved into unit - Moved in 1970 to 1979 (%) - Asian
Year householder moved into unit - Moved in 1970 to 1979 (%) - Hispanic or Latino
Year householder moved into unit - Moved in 1970 to 1979 (%) - American Indian and Alaska Native
Year householder moved into unit - Moved in 1970 to 1979 (%) - Multirace
Year householder moved into unit - Moved in 1970 to 1979 (%) - Other Race
Year householder moved into unit - Moved in 1969 or earlier (%)
Year householder moved into unit - Moved in 1969 or earlier (%) - White
Year householder moved into unit - Moved in 1969 or earlier (%) - Black or African American
Year householder moved into unit - Moved in 1969 or earlier (%) - Asian
Year householder moved into unit - Moved in 1969 or earlier (%) - Hispanic or Latino
Year householder moved into unit - Moved in 1969 or earlier (%) - American Indian and Alaska Native
Year householder moved into unit - Moved in 1969 or earlier (%) - Multirace
Year householder moved into unit - Moved in 1969 or earlier (%) - Other Race
Housing units lacking complete plumbing facilities (%)
Housing units lacking complete kitchen facilities (%)
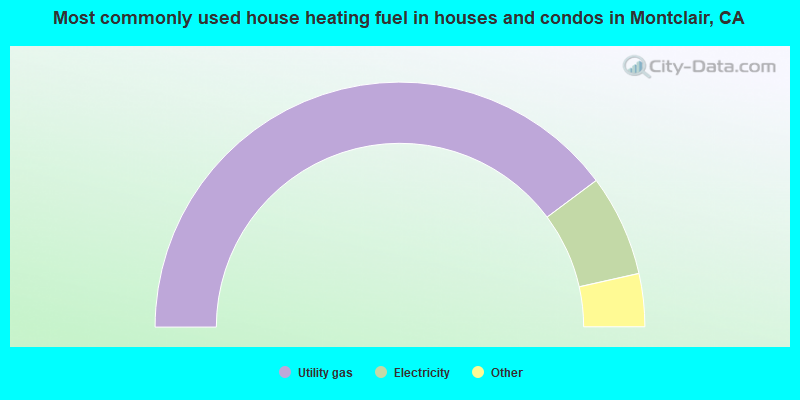
House heating fuel used in houses and condos - Utility gas (%)
House heating fuel used in houses and condos - Bottled, tank, or LP gas (%)
House heating fuel used in houses and condos - Electricity (%)
House heating fuel used in houses and condos - Fuel oil, kerosene, etc. (%)
House heating fuel used in houses and condos - Coal or coke (%)
House heating fuel used in houses and condos - Wood (%)
House heating fuel used in houses and condos - Solar energy (%)
House heating fuel used in houses and condos - Other fuel (%)
House heating fuel used in houses and condos - No fuel used (%)
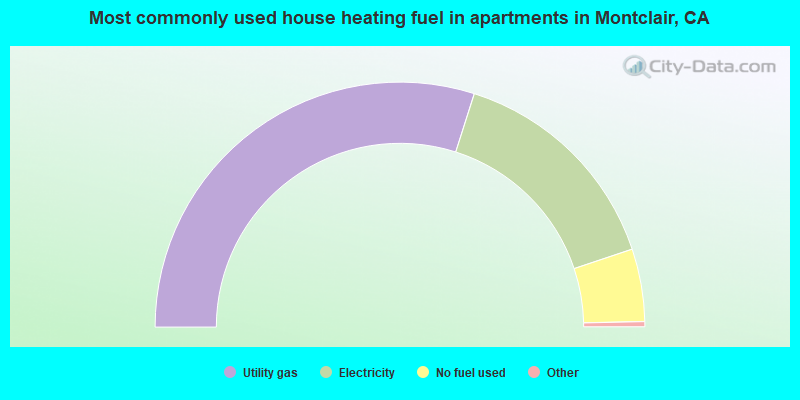
House heating fuel used in apartments - Utility gas (%)
House heating fuel used in apartments - Bottled, tank, or LP gas (%)
House heating fuel used in apartments - Electricity (%)
House heating fuel used in apartments - Fuel oil, kerosene, etc. (%)
House heating fuel used in apartments - Coal or coke (%)
House heating fuel used in apartments - Wood (%)
House heating fuel used in apartments - Solar energy (%)
House heating fuel used in apartments - Other fuel (%)
House heating fuel used in apartments - No fuel used (%)
Latest news about housing in Montclair, CA collected exclusively by city-data.com from local newspapers, TV, and radio stations
Median year house/condo built: 1965Median year apartment built: 1975Household type by relationship:
Households: 38,069
Male householders: 4,303 (745 living alone ), Female householders: 5,894 (816 living alone )5,067 spouses (5,040 opposite-sex spouses ), 683 unmarried partners , (644 opposite-sex unmarried partners ), 14,970 children (13,971 natural , 316 adopted , 682 stepchildren ), 1,538 grandchildren , 923 brothers or sisters , 1,451 parents , 64 foster children , 1,775 other relatives , 1,014 non-relatives In group quarters: 383
Size of family households: 2,061 2-persons , 1,742 3-persons , 1,644 4-persons , 1,383 5-persons , 1,038 6-persons , 572 7-or-more-persons .
Size of nonfamily households: 1,546 1-person , 248 2-persons , 37 3-persons , 11 4-persons , 35 5-persons .
4,718 married couples with children. single-parent households (836 men , 2,070 women ).
38.1% of residents of Montclair speak English at home. of residents speak Spanish at home (63% speak English very well , 17% speak English well , 13% speak English not well , 7% don't speak English at all ).of residents speak other Indo-European language at home (80% speak English very well , 17% speak English well , 3% speak English not well ).of residents speak Asian or Pacific Island language at home (45% speak English very well , 24% speak English well , 22% speak English not well , 9% don't speak English at all ).of residents speak other language at home (66% speak English very well , 19% speak English well , 14% speak English not well , 2% don't speak English at all ).
Foreign born population: 12,483 (32.8%)of them are naturalized citizens )
Median number of rooms in houses and condos:
Median number of rooms in apartments
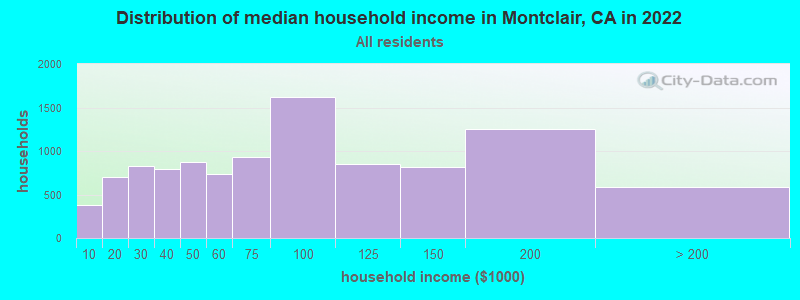
Montclair, CA household income distribution 381 Less than $10,000697 $10,000 to $19,999828 $20,000 to $29,999790 $30,000 to $39,999873 $40,000 to $49,999734 $50,000 to $59,999929 $60,000 to $74,9991,624 $75,000 to $99,999855 $100,000 to $124,999821 $125,000 to $149,9991,254 $150,000 to $199,999587 $200,000 or more
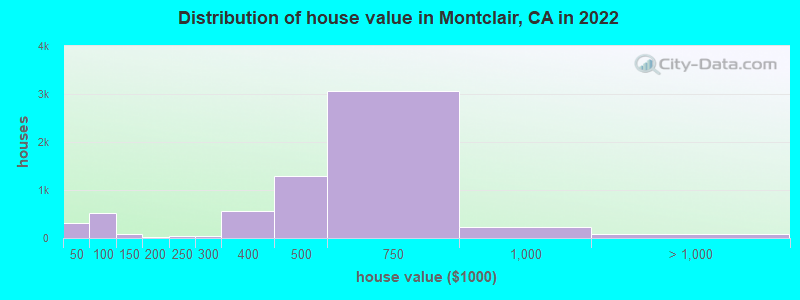
Home value of owner - occupied houses in 2022 in Montclair, CA 123 Less than $10,00053 $10,000 to $14,9994 $15,000 to $19,99920 $20,000 to $24,999105 $40,000 to $49,999143 $50,000 to $59,99982 $60,000 to $69,99976 $70,000 to $79,99979 $80,000 to $89,99927 $90,000 to $99,99984 $100,000 to $124,9995 $125,000 to $149,99929 $175,000 to $199,99935 $200,000 to $249,99949 $250,000 to $299,999565 $300,000 to $399,9991,297 $400,000 to $499,9993,064 $500,000 to $749,999222 $750,000 to $999,99914 $1,000,000 to $1,499,99964 $2,000,000 or moreRent paid by renters in 2022 in Montclair, CA 26 Less than $10063 $250 to $2996 $300 to $34930 $350 to $39914 $400 to $44919 $450 to $49965 $500 to $54911 $600 to $64912 $650 to $69961 $700 to $74942 $750 to $799340 $800 to $899212 $900 to $999250 $1,000 to $1,249714 $1,250 to $1,4991,692 $1,500 to $1,999776 $2,000 to $2,499153 $2,500 to $2,99939 $3,000 to $3,49986 No cash rent
Percentage of workers working in this county: 58.4%Number of people working at home: 1,124 (6.5% of all workers )
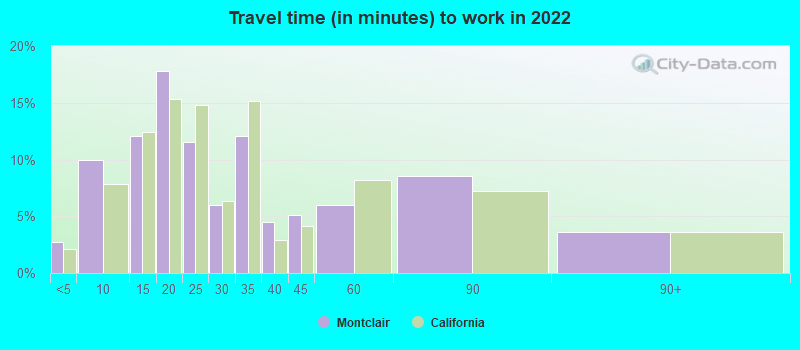
Travel time to work (commute)
Less than 5 minutes: 1145 to 9 minutes: 1,18610 to 14 minutes: 1,38915 to 19 minutes: 2,66920 to 24 minutes: 2,75525 to 29 minutes: 81030 to 34 minutes: 1,98735 to 39 minutes: 58440 to 44 minutes: 80945 to 59 minutes: 1,03860 to 89 minutes: 1,85590 or more minutes: 723
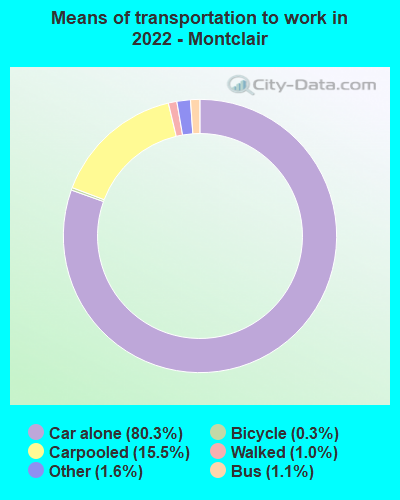
Means of transportation to work:
Drove a car alone: 11,630 (73.2%)Carpooled: 2,412 (15.2%)Bus : 165 (1.0%)Long-distance train or commuter rail : 6 (0.0%)Taxi: 271 (1.7%)Bicycle: 37 (0.2%)Walked: 159 (1.0%)Worked at home: 1,124 (7.1%)
Unemployment by race in 2022
Unemployment rate for White non-Hispanic residents 8.3% Males8.9% FemalesUnemployment rate for Black residents 3.1% FemalesUnemployment rate for American Indian and Alaska Native residents 1.5% MalesUnemployment rate for Asian residents 4.8% Males4.1% FemalesUnemployment rate for other race residents 2.6% Males6.4% FemalesUnemployment rate for two or more race residents 10.8% Males3.9% FemalesUnemployment rate for Hispanic or Latino residents 5.8% Males4.7% Females
Year of entry for the foreign-born population in Montclair, California
2,351 2010 or later 2,220 2000 to 2009 3,241 1990 to 1999 3,766 1980 to 1989 2,114 1970 to 1979 938 Before 1970
First ancestries reported:
English: 296 (1.2%)
American: 245 (1.0%)
German: 164 (0.7%)
Italian: 119 (0.5%)
Irish: 112 (0.5%)
European: 86 (0.4%)
Nigerian: 75 (0.3%)
Egyptian: 67 (0.3%)
Kenyan: 58 (0.2%)
Lebanese: 53 (0.2%)
Canadian: 31 (0.1%)
French: 30 (0.1%)
Jordanian: 21 (0.09%)
Scottish: 17 (0.07%)
Welsh: 15 (0.06%)
Norwegian: 13 (0.05%)
Guyanese: 12 (0.05%)
Belgian: 11 (0.04%)
Iranian: 11 (0.04%)
Romanian: 10 (0.04%)
African: 9 (0.04%)
Ukrainian: 9 (0.04%)
Armenian: 8 (0.03%)
Finnish: 7 (0.03%)
Luxembourger: 7 (0.03%)
Polish: 7 (0.03%)
Scotch-Irish: 7 (0.03%)
Swedish: 6 (0.02%) Most common places of birth for foreign-born residents (%): Mexico Montclair:
52.7% (6,411)California:
37.2% (3,881,193)
Vietnam Montclair:
10.7% (1,295)California:
4.9% (512,335)
Philippines Montclair:
5.7% (688)California:
7.8% (818,297)
El Salvador Montclair:
5.1% (625)California:
4.2% (440,287)
Honduras Montclair:
5.0% (611)California:
0.6% (66,590)
Nicaragua Montclair:
3.9% (475)California:
0.6% (58,161)
China, excluding Hong Kong and Taiwan Montclair:
3.4% (417)California:
6.6% (684,672)
Guatemala Montclair:
1.9% (229)California:
2.8% (290,436)
Place of birth for U.S.-born residents:
This state: 22,907Other state: 2,459Northeast: 506Midwest: 798South: 709West: 455 93.6% of Montclair residents lived in the same house 1 years ago.
Out of people who lived in different houses, 33.9% lived in this county.
Out of people who lived in different counties, 86.2% lived in California.
Montclair:
93.6%State average:
88.9%
Education attainment for males 25 years and older:
No schooling: 862Nursery to 4th grade: 2175th and 6th grade: 4907th and 8th grade: 1059th grade: 25310th grade: 16611th grade: 20612th grade, no diploma: 588High school graduate (or equivalency): 3,341Less than 1 year of college: 996Some college more than 1 year, no degree: 1,761Associate degree: 631Bachelor's degree: 1,326Master's degree: 427Professional school degree: 62Doctorate degree: 140
Education attainment for females 25 years and older:
No schooling: 1,257Nursery to 4th grade: 2365th and 6th grade: 6487th and 8th grade: 1739th grade: 17510th grade: 15411th grade: 23912th grade, no diploma: 634High school graduate (or equivalency): 3,110Less than 1 year of college: 860Some college more than 1 year, no degree: 1,426Associate degree: 1,044Bachelor's degree: 1,760Master's degree: 773Professional school degree: 149Doctorate degree: 77
Housing units in structures:
One, detached: 5,898One, attached: 659Two: 2573 or 4: 7845 to 9: 43410 to 19: 64120 to 49: 39950 or more: 605Mobile homes: 781Boats, RVs, vans, etc.: 23Median worth of mobile homes: $76,218
Housing units lacking complete plumbing facilities in 2022: 0.5%Housing units lacking complete kitchen facilities in 2022: 1.7%House/condo owner moved in on average 15 years ago
Renter moved in on average 5 years ago
Private vs. public school enrollment:
Students in private schools in grades 1 to 8 (elementary and middle school): 73 Here:
1.8%California:
10.5%
Students in private schools in grades 9 to 12 (high school): 46 Students in private undergraduate colleges: 621 Here:
19.3%California:
15.9%