Metuchen, NJ (New Jersey) Houses and Residents
| Metuchen: | $573,634 |
| New Jersey: | $428,900 |
Mean price in 2022:
Detached houses: $610,904
Here: $610,904 State: $537,591 Townhouses or other attached units: $344,567
Here: $344,567 State: $381,113 In 2-unit structures: $823,641
Here: $823,641 State: $444,476 In 3-to-4-unit structures: $352,224
Here: $352,224 State: $457,463 In 5-or-more-unit structures: $332,335
Here: $332,335 State: $368,745
Total population: 13,826 (Urban population: 12,840, Rural population: 0)
Houses: 5,592 (5,385 occupied: 4,067 owner occupied, 1,364 renter occupied)
| % of renters here: | 25% |
| State: | 35% |
Housing density: 2,040 houses/condos per square mile
Median price asked for vacant for-sale houses and condos in 2022: $1,061,552.
Median contract rent in 2022: $1,762 (lower quartile is $1,243, upper quartile is over $2,000)
Median rent asked for vacant for-rent units in 2022: $2,396
Median gross rent in Metuchen, NJ in 2022: $1,855
Housing units in Metuchen with a mortgage: 2,726 (247 second mortgage, 14 home equity loan, 212 both second mortgage and home equity loan)
Houses without a mortgage: 30
Median household income for houses/condos with a mortgage: $181,283
Median household income for apartments without a mortgage: $139,918
Median monthly housing costs: $2,270
Compare current foreclosures in Metuchen, NJ:
| Photo | Address | Area | Beds / Baths | Price | Details |
|---|---|---|---|---|---|

|
#1
Redfield Vlg Apt D1
Metuchen, NJ 08840
|
- sq. feet
|
- baths - beds |
show details | |

|
#2
Franklin School Way
Metuchen, NJ 08840
|
1,771 sq. feet
|
- baths - beds |
show details | |

|
#3
Liberty St Ste 3-C
Metuchen, NJ 08840
|
- sq. feet
|
- baths - beds |
show details | |

|
#4
Prospect St
Metuchen, NJ 08840
|
- sq. feet
|
- baths - beds |
show details | |

|
#5
Lafayette Rd, Apt 3d
Metuchen, NJ 08840
|
- sq. feet
|
- baths - beds |
show details | |

|
#6
Grove Ave
Metuchen, NJ 08840
|
1,171 sq. feet
|
- baths - beds |
show details | |

|
#7
Lafayette Rd, Apt 2f
Metuchen, NJ 08840
|
- sq. feet
|
- baths - beds |
show details | |

|
#8
Main St # 4
Metuchen, NJ 08840
|
- sq. feet
|
- baths - beds |
show details | |

|
#9
Blair Ave
Metuchen, NJ 08840
|
- sq. feet
|
- baths - beds |
show details | |

|
#10
Liberty St Ste 3d
Metuchen, NJ 08840
|
- sq. feet
|
- baths - beds |
show details |
| Photo | Address | Area | Beds / Baths | Price | Details |
|---|---|---|---|---|---|

|
#11
Durham Ave
Metuchen, NJ 08840
|
- sq. feet
|
- baths - beds |
show details | |

|
#12
Sharon Ct
Metuchen, NJ 08840
|
- sq. feet
|
- baths - beds |
show details | |

|
#13
Robins Pl
Metuchen, NJ 08840
|
- sq. feet
|
- baths - beds |
show details | |

|
#14
Mcguire St
Metuchen, NJ 08840
|
- sq. feet
|
- baths - beds |
show details | |

|
#15
Bridge St
Metuchen, NJ 08840
|
- sq. feet
|
- baths - beds |
show details | |

|
#16
Carson Ave
Metuchen, NJ 08840
|
- sq. feet
|
- baths - beds |
show details | |

|
#17
Grove Ave
Metuchen, NJ 08840
|
- sq. feet
|
- baths - beds |
show details | |

|
#18
Main St # 6
Metuchen, NJ 08840
|
- sq. feet
|
- baths - beds |
show details | |

|
#19
Main St # 5
Metuchen, NJ 08840
|
- sq. feet
|
- baths - beds |
show details | |

|
#20
Main St # 3
Metuchen, NJ 08840
|
- sq. feet
|
- baths - beds |
show details |
| Photo | Address | Area | Beds / Baths | Price | Details |
|---|---|---|---|---|---|

|
#21
Main St # 1
Metuchen, NJ 08840
|
- sq. feet
|
- baths - beds |
show details | |

|
#22
Mercer St
Metuchen, NJ 08840
|
- sq. feet
|
- baths - beds |
show details | |

|
#23
James Pl
Metuchen, NJ 08840
|
- sq. feet
|
- baths - beds |
show details | |

|
#24
Newman St
Metuchen, NJ 08840
|
- sq. feet
|
- baths - beds |
show details | |

|
#25
Plainfield Ave
Metuchen, NJ 08840
|
- sq. feet
|
- baths - beds |
show details | |

|
#26
Park Pl
Metuchen, NJ 08840
|
- sq. feet
|
- baths - beds |
show details | |

|
#27
Ford Ave
Metuchen, NJ 08840
|
- sq. feet
|
- baths - beds |
show details | |

|
#28
High St
Metuchen, NJ 08840
|
- sq. feet
|
- baths - beds |
show details | |

|
#29
High St # 406-C
Metuchen, NJ 08840
|
- sq. feet
|
- baths - beds |
show details | |

|
#30
Wall St
Metuchen, NJ 08840
|
- sq. feet
|
- baths - beds |
show details |
| Photo | Address | Area | Beds / Baths | Price | Details |
|---|---|---|---|---|---|

|
#31
Main St # 2
Metuchen, NJ 08840
|
- sq. feet
|
- baths - beds |
show details | |

|
Check over 1 million property listings on Foreclosure.com!
|
browse all offers | |||

Latest news about housing in Metuchen, NJ collected exclusively by city-data.com from local newspapers, TV, and radio stations


Median year apartment built: 1976
Household type by relationship:
Households: 14,980- Male householders: 2,652 (339 living alone), Female householders: 2,697 (822 living alone)
3,303 spouses (3,285 opposite-sex spouses), 273 unmarried partners, (267 opposite-sex unmarried partners), 5,328 children (4,970 natural, 151 adopted, 207 stepchildren), 172 grandchildren, 93 brothers or sisters, 254 parents, 0 foster children, 110 other relatives, 86 non-relatives
- In group quarters: 7
Size of family households: 1,373 2-persons, 931 3-persons, 1,197 4-persons, 240 5-persons, 123 6-persons, 57 7-or-more-persons.
Size of nonfamily households: 1,181 1-person, 340 2-persons.
3,236 married couples with children.
486 single-parent households (74 men, 412 women).
77.7% of residents of Metuchen speak English at home.
4.0% of residents speak Spanish at home (67% speak English very well, 17% speak English well, 9% speak English not well, 7% don't speak English at all).
10.7% of residents speak other Indo-European language at home (73% speak English very well, 18% speak English well, 6% speak English not well, 3% don't speak English at all).
6.7% of residents speak Asian or Pacific Island language at home (68% speak English very well, 22% speak English well, 3% speak English not well, 8% don't speak English at all).
0.7% of residents speak other language at home (94% speak English very well, 6% speak English not well).
Foreign born population: 2,523 (16.8%)
(69.1% of them are naturalized citizens)
| Here: | 7.1 |
| State: | 6.8 |
| Here: | 3.5 |
| State: | 3.9 |

- Bedrooms in owner-occupied houses and condos in Metuchen, New Jersey
- 7no bedroom
- 551 bedroom
- 4912 bedrooms
- 1,8223 bedrooms
- 1,3854 bedrooms
- 3075+ bedrooms

- Bedrooms in renter-occupied apartments in Metuchen, New Jersey
- 36no bedroom
- 7301 bedroom
- 4032 bedrooms
- 1403 bedrooms
- 404 bedrooms
- 165+ bedrooms

- Cars and other vehicles available in Metuchen in owner-occupied houses/condos
- 56no vehicle
- 1,1801 vehicle
- 2,1102 vehicles
- 5813 vehicles
- 1084 vehicles
- 325+ vehicles

- Cars and other vehicles available in Metuchen in renter-occupied apartments
- 211no vehicle
- 7841 vehicle
- 3352 vehicles
- 153 vehicles
- 184 vehicles
- 05+ vehicles

- Rooms in owner-occupied houses in Metuchen, New Jersey
- 71 room
- 02 rooms
- 163 rooms
- 1684 rooms
- 5355 rooms
- 7146 rooms
- 9677 rooms
- 8118 rooms
- 8509+ rooms

- Rooms in renter-occupied apartments in Metuchen, New Jersey
- 231 room
- 2222 rooms
- 4143 rooms
- 2454 rooms
- 2085 rooms
- 1076 rooms
- 327 rooms
- 388 rooms
- 769+ rooms


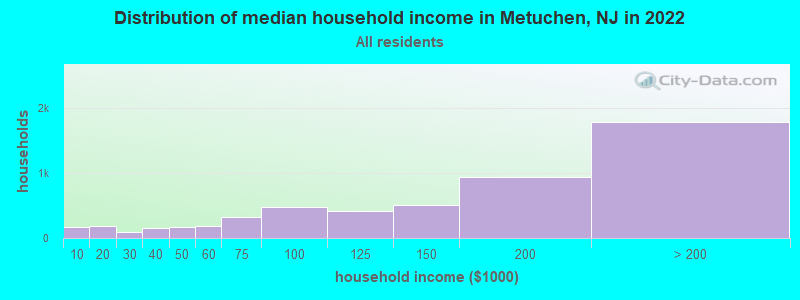
Metuchen, NJ household income distribution

- 173Less than $10,000
- 190$10,000 to $19,999
- 95$20,000 to $29,999
- 158$30,000 to $39,999
- 167$40,000 to $49,999
- 182$50,000 to $59,999
- 316$60,000 to $74,999
- 474$75,000 to $99,999
- 410$100,000 to $124,999
- 511$125,000 to $149,999
- 933$150,000 to $199,999
- 1,781$200,000 or more
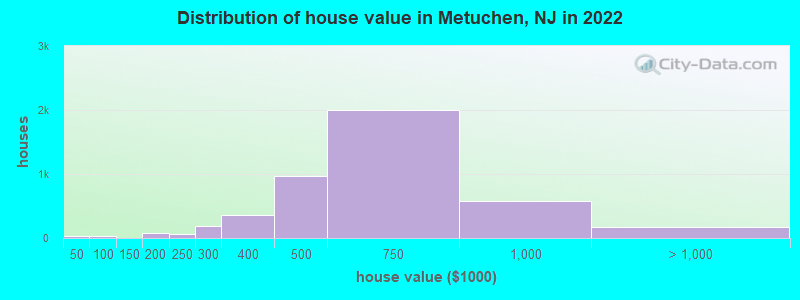
Home value of owner - occupied houses in 2022 in Metuchen, NJ
-
- 7Less than $10,000
- 6$20,000 to $24,999
- 13$40,000 to $49,999
- 5$50,000 to $59,999
- 8$70,000 to $79,999
- 2$80,000 to $89,999
- 4$125,000 to $149,999
- 72$150,000 to $174,999
- 11$175,000 to $199,999
- 68$200,000 to $249,999
- 180$250,000 to $299,999
- 364$300,000 to $399,999
- 975$400,000 to $499,999
- 1,996$500,000 to $749,999
- 573$750,000 to $999,999
- 151$1,000,000 to $1,499,999
- 18$2,000,000 or more
Rent paid by renters in 2022 in Metuchen, NJ
-
- 36Less than $100
- 15$200 to $249
- 26$250 to $299
- 19$300 to $349
- 9$350 to $399
- 27$400 to $449
- 17$650 to $699
- 22$900 to $999
- 80$1,000 to $1,249
- 162$1,250 to $1,499
- 334$1,500 to $1,999
- 213$2,000 to $2,499
- 123$2,500 to $2,999
- 58$3,000 to $3,499
- 31$3,500 or more
- 41No cash rent


Percentage of workers working in this county: 59.1%
Number of people working at home: 1,926 (24.8% of all workers)
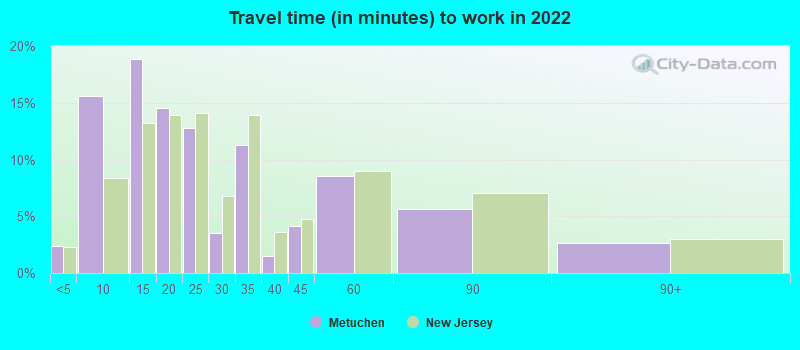
Travel time to work (commute)
- Less than 5 minutes: 198
- 5 to 9 minutes: 353
- 10 to 14 minutes: 675
- 15 to 19 minutes: 751
- 20 to 24 minutes: 548
- 25 to 29 minutes: 437
- 30 to 34 minutes: 508
- 35 to 39 minutes: 65
- 40 to 44 minutes: 288
- 45 to 59 minutes: 497
- 60 to 89 minutes: 1,088
- 90 or more minutes: 360
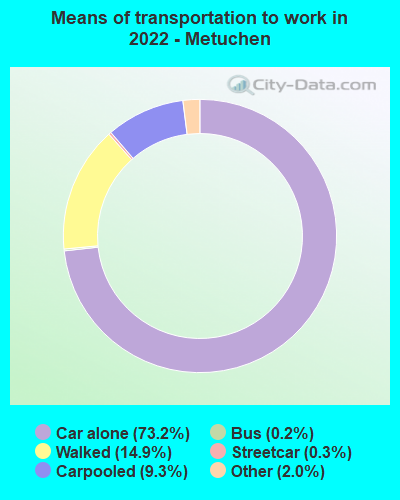
Means of transportation to work:
- Drove a car alone: 4,846 (55.6%)
- Carpooled: 730 (8.4%)
- Bus: 5 (0.1%)
- Subway or elevated rail: 23 (0.3%)
- Long-distance train or commuter rail: 2 (0.0%)
- Taxi: 180 (2.1%)
- Walked: 1,462 (16.8%)
- Worked at home: 1,926 (22.1%)

- Unemployment by race in 2022
- Unemployment rate for White non-Hispanic residents
- 4.6%Males
- 2.3%Females
- Unemployment rate for Black residents
- 15.7%Males
- Unemployment rate for Asian residents
- 3.4%Males
- 2.4%Females
- Unemployment rate for other race residents
- 3.4%Females
- Unemployment rate for two or more race residents
- 1.8%Females
- Unemployment rate for Hispanic or Latino residents
- 5.7%Females

- Year of entry for the foreign-born population in Metuchen, New Jersey
- 6182010 or later
- 6042000 to 2009
- 6771990 to 1999
- 3711980 to 1989
- 3361970 to 1979
- 368Before 1970
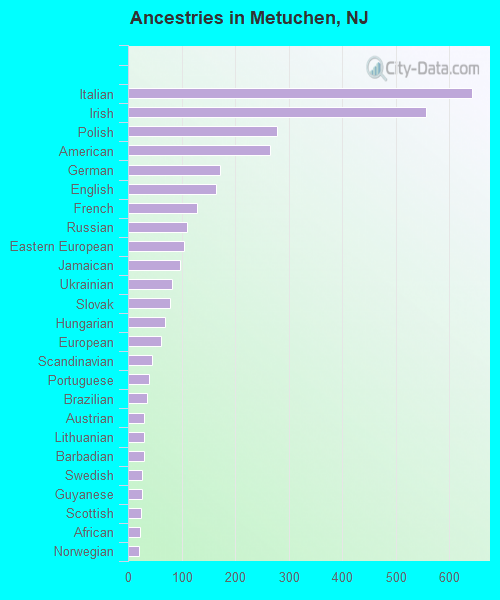
First ancestries reported:
- Italian: 642 (10.0%)
- Irish: 557 (8.6%)
- Polish: 279 (4.3%)
- American: 265 (4.1%)
- German: 171 (2.7%)
- English: 164 (2.5%)
- French: 128 (2.0%)
- Russian: 111 (1.7%)
- Eastern European: 104 (1.6%)
- Jamaican: 98 (1.5%)
- Ukrainian: 83 (1.3%)
- Slovak: 79 (1.2%)
- Hungarian: 70 (1.1%)
- European: 62 (1.0%)
- Scandinavian: 44 (0.7%)
- Portuguese: 40 (0.6%)
- Brazilian: 35 (0.5%)
- Austrian: 29 (0.5%)
- Lithuanian: 29 (0.5%)
- Barbadian: 29 (0.5%)
- Swedish: 27 (0.4%)
- Guyanese: 26 (0.4%)
- Scottish: 25 (0.4%)
- African: 22 (0.3%)
- Norwegian: 20 (0.3%)
- Kenyan: 18 (0.3%)
- Slavic: 13 (0.2%)
- Iranian: 10 (0.2%)
- Czech: 10 (0.2%)
- French Canadian: 10 (0.2%)
- Danish: 9 (0.1%)
- Finnish: 8 (0.1%)
- Greek: 7 (0.1%)
- Ghanaian: 7 (0.1%)
- Serbian: 6 (0.09%)
- Yugoslavian: 6 (0.09%)
- British: 3 (0.05%)
- Lebanese: 3 (0.05%)
- Trinidadian and Tobagonian: 2 (0.03%)
Most common places of birth for foreign-born residents (%):
| Metuchen: | 31.0% (762) |
| New Jersey: | 12.8% (274,609) |
| Metuchen: | 13.0% (319) |
| New Jersey: | 3.7% (78,969) |
| Metuchen: | 4.5% (110) |
| New Jersey: | 3.3% (70,512) |
| Metuchen: | 4.3% (106) |
| New Jersey: | 1.1% (22,760) |
| Metuchen: | 3.4% (84) |
| New Jersey: | 2.3% (48,811) |
| Metuchen: | 2.8% (68) |
| New Jersey: | 2.2% (47,365) |
| Metuchen: | 2.6% (64) |
| New Jersey: | 1.5% (33,198) |
| Metuchen: | 2.6% (63) |
| New Jersey: | 4.0% (85,934) |
| Metuchen: | 2.2% (55) |
| New Jersey: | 0.7% (14,405) |
| Metuchen: | 2.2% (54) |
| New Jersey: | 0.4% (7,791) |
| Metuchen: | 2.1% (52) |
| New Jersey: | 1.3% (27,580) |
| Metuchen: | 1.8% (43) |
| New Jersey: | 4.2% (90,817) |
| Metuchen: | 1.7% (42) |
| New Jersey: | 0.7% (15,548) |
Place of birth for U.S.-born residents:
- This state: 7,948
- Other state: 4,246
- Northeast: 3,108
- Midwest: 543
- South: 393
- West: 243
90.1% of Metuchen residents lived in the same house 1 years ago.
Out of people who lived in different houses, 27.6% lived in this county.
Out of people who lived in different counties, 47.9% lived in New Jersey.
| Metuchen: | 90.1% |
| State average: | 90.4% |
Education attainment for males 25 years and older:
- No schooling: 59
- Nursery to 4th grade: 0
- 5th and 6th grade: 0
- 7th and 8th grade: 5
- 9th grade: 28
- 10th grade: 32
- 11th grade: 11
- 12th grade, no diploma: 74
- High school graduate (or equivalency): 558
- Less than 1 year of college: 225
- Some college more than 1 year, no degree: 412
- Associate degree: 388
- Bachelor's degree: 1,457
- Master's degree: 1,007
- Professional school degree: 239
- Doctorate degree: 225

Education attainment for females 25 years and older:
- No schooling: 39
- Nursery to 4th grade: 12
- 5th and 6th grade: 4
- 7th and 8th grade: 78
- 9th grade: 22
- 10th grade: 9
- 11th grade: 19
- 12th grade, no diploma: 29
- High school graduate (or equivalency): 705
- Less than 1 year of college: 199
- Some college more than 1 year, no degree: 399
- Associate degree: 462
- Bachelor's degree: 1,931
- Master's degree: 1,286
- Professional school degree: 292
- Doctorate degree: 176


Housing units in structures:
- One, detached: 3,695
- One, attached: 612
- Two: 171
- 3 or 4: 259
- 5 to 9: 148
- 10 to 19: 167
- 20 to 49: 104
- 50 or more: 433
House/condo owner moved in on average 16 years ago
Renter moved in on average 3 years ago

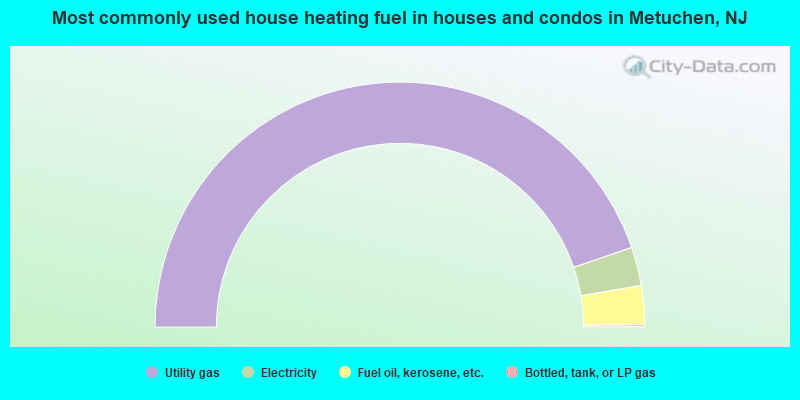
- 89.4%Utility gas
- 5.1%Electricity
- 5.1%Fuel oil, kerosene, etc.
- 0.3%Bottled, tank, or LP gas
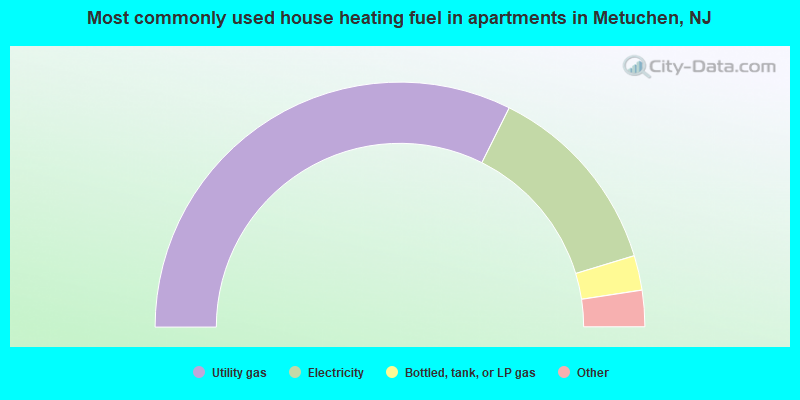
- 64.8%Utility gas
- 25.9%Electricity
- 4.6%Bottled, tank, or LP gas
- 2.4%Other fuel
- 2.3%Fuel oil, kerosene, etc.
Private vs. public school enrollment:
| Here: | 13.6% |
| New Jersey: | 12.3% |
| Here: | 20.8% |
| New Jersey: | 13.1% |
| Here: | 29.9% |
| New Jersey: | 33.2% |


