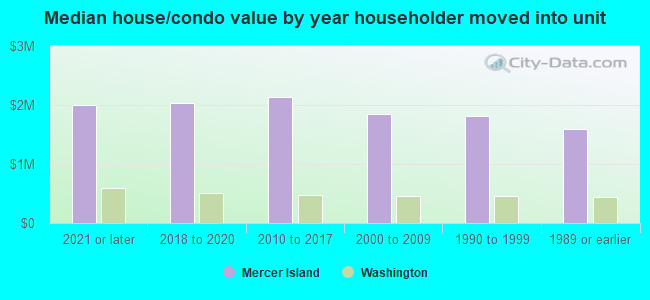
Mercer Island, WA (Washington) Houses and Residents
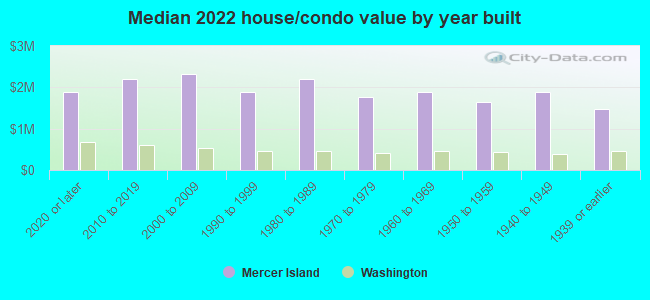
| Mercer Island: | $1,906,238 |
| Washington: | $569,500 |
Total population: 24,326 (Urban population: 22,036, Rural population: 0)
Houses: 10,858 (10,102 occupied: 6,857 owner occupied, 3,231 renter occupied)
| % of renters here: | 32% |
| State: | 36% |
Housing density: 1,701 houses/condos per square mile
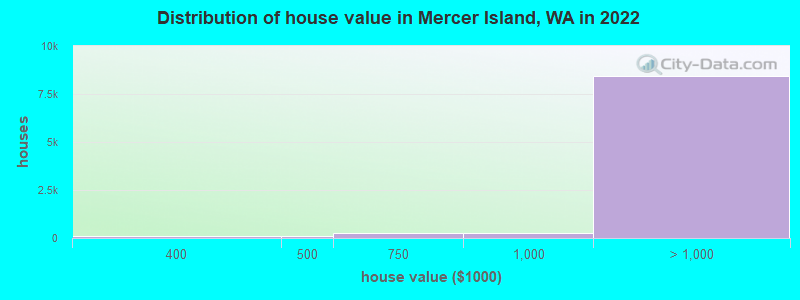
Median price asked for vacant for-sale houses and condos in 2022: $3,998,983.
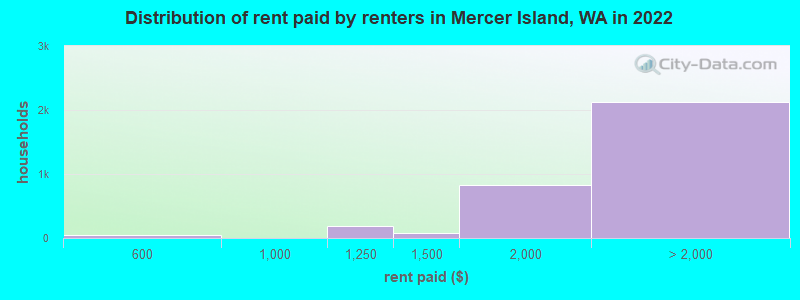
Median contract rent in 2022: over $2,000 (lower quartile is $1,760, upper quartile is over $2,000)
Median rent asked for vacant for-rent units in 2022: $3,203
Median gross rent in Mercer Island, WA in 2022: over $2,000
Housing units in Mercer Island with a mortgage: 4,149 (617 second mortgage, 0 home equity loan, 602 both second mortgage and home equity loan)
Houses without a mortgage: 135
Median household income for houses/condos with a mortgage: $262,073
Median household income for apartments without a mortgage: $178,098
Median monthly housing costs: $2,734
Compare current foreclosures near Mercer Island, WA:
| Photo | Address | Area | Beds / Baths | Price | Details |
|---|---|---|---|---|---|

|
#1
SE 40th St
Mercer Island, WA 98040
|
2,130 sq. feet
|
2 baths 2 beds |
show details | |

|
#2
W Mercer Way
Mercer Island, WA 98040
|
2,300 sq. feet
|
2 baths 3 beds |
show details | |

|
#3
SE 55th Pl
Mercer Island, WA 98040
|
2,490 sq. feet
|
2 baths 3 beds |
show details | |

|
#4
81st Pl SE Unit D101
Mercer Island, WA 98040
|
- sq. feet
|
- baths - beds |
show details | |

|
#5
76th Ave SE Apt 208
Mercer Island, WA 98040
|
- sq. feet
|
- baths - beds |
show details | |

|
#6
SE 28th St Apt 308
Mercer Island, WA 98040
|
- sq. feet
|
- baths - beds |
show details | |

|
#7
1st Ave S # 806
Seattle, WA 98104
|
806 sq. feet
|
1 baths 1 beds |
show details | |

|
#8
57th Ave S Unit B104
Seattle, WA 98178
|
572 sq. feet
|
1 baths 1 beds |
show details | |

|
#9
42nd Ave S Apt 101
Kent, WA 98032
|
995 sq. feet
|
2 baths 2 beds |
show details | |

|
#10
226th Pl NE
Sammamish, WA 98074
|
1,650 sq. feet
|
2 baths 3 beds |
show details |
| Photo | Address | Area | Beds / Baths | Price | Details |
|---|---|---|---|---|---|

|
#11
Puget Blvd SW
Seattle, WA 98106
|
1,820 sq. feet
|
1 baths 3 beds |
show details | |

|
#12
230th Way SE
Sammamish, WA 98075
|
3,036 sq. feet
|
3 baths 4 beds |
show details | |

|
#13
Lake Alice Rd SE
Fall City, WA 98024
|
1,750 sq. feet
|
2 baths 3 beds |
show details | |

|
#14
S 249th St
Kent, WA 98032
|
1,120 sq. feet
|
1 baths 3 beds |
show details | |

|
#15
S 182nd St
Seattle, WA 98188
|
1,168 sq. feet
|
2 baths 3 beds |
show details | |

|
#16
S 158th St Apt B8
Seattle, WA 98188
|
- sq. feet
|
1 baths 2 beds |
show details | |

|
#17
Wildwood Blvd SW
Issaquah, WA 98027
|
1,590 sq. feet
|
2 baths 3 beds |
show details | |

|
#18
67th Pl W
Mountlake Terrace, WA 98043
|
2,194 sq. feet
|
2 baths 5 beds |
show details | |

|
#19
NE 13th Pl
Renton, WA 98059
|
3,190 sq. feet
|
2 baths 3 beds |
show details | |

|
#20
SE 14th St
Sammamish, WA 98075
|
3,520 sq. feet
|
3 baths 6 beds |
show details |
| Photo | Address | Area | Beds / Baths | Price | Details |
|---|---|---|---|---|---|

|
#21
NE 5th St
Renton, WA 98056
|
1,930 sq. feet
|
2 baths 3 beds |
show details | |

|
#22
3rd Ave W
Seattle, WA 98119
|
1,410 sq. feet
|
1 baths 3 beds |
show details | |

|
#23
NW 59th St
Seattle, WA 98107
|
1,110 sq. feet
|
1 baths 3 beds |
show details | |

|
#24
47th Pl S
Auburn, WA 98001
|
970 sq. feet
|
1 baths 3 beds |
show details | |

|
#25
58th Pl S
Auburn, WA 98001
|
1,410 sq. feet
|
2 baths 3 beds |
show details | |

|
#26
SE 47th Pl
Issaquah, WA 98029
|
2,610 sq. feet
|
2 baths 3 beds |
show details | |

|
#27
Yukon Harbor Rd SE
Port Orchard, WA 98366
|
3,163 sq. feet
|
1 baths 3 beds |
show details | |

|
#28
S Sunnycrest Rd
Seattle, WA 98178
|
1,500 sq. feet
|
1 baths 3 beds |
show details | |

|
#29
S 124th St
Seattle, WA 98178
|
1,100 sq. feet
|
1 baths 2 beds |
show details | |

|
#30
16th Ave S
Seattle, WA 98168
|
1,800 sq. feet
|
1 baths 4 beds |
show details |
| Photo | Address | Area | Beds / Baths | Price | Details |
|---|---|---|---|---|---|

|
#31
39th Ave W
Seattle, WA 98199
|
2,800 sq. feet
|
2 baths 3 beds |
show details | |

|
#32
51st Ave NE
Seattle, WA 98115
|
2,450 sq. feet
|
2 baths 4 beds |
show details | |

|
#33
126th Pl SE
Renton, WA 98056
|
2,450 sq. feet
|
2 baths 4 beds |
show details | |

|
#34
116th Ave NE
Kirkland, WA 98033
|
1,260 sq. feet
|
2 baths 3 beds |
show details | |

|
#35
20th Ave SE
Bothell, WA 98021
|
1,552 sq. feet
|
2 baths 3 beds |
show details | |

|
#36
77th Ave S
Seattle, WA 98178
|
3,090 sq. feet
|
4 baths 6 beds |
show details | |

|
#37
SW 148th St
Seattle, WA 98166
|
1,030 sq. feet
|
1 baths 3 beds |
show details | |

|
#38
119th Ave SE
Kent, WA 98030
|
2,760 sq. feet
|
2 baths 4 beds |
show details | |

|
#39
SE 5th St
Sammamish, WA 98074
|
3,180 sq. feet
|
2 baths 4 beds |
show details | |

|
#40
19th Ave S
Seattle, WA 98168
|
2,420 sq. feet
|
2 baths 2 beds |
show details |
| Photo | Address | Area | Beds / Baths | Price | Details |
|---|---|---|---|---|---|

|
#41
S 36th Pl
Renton, WA 98055
|
- sq. feet
|
2 baths 4 beds |
show details | |

|
#42
269th Ave SE
Maple Valley, WA 98038
|
2,660 sq. feet
|
2 baths 3 beds |
show details | |

|
#43
113th Ave SE
Renton, WA 98055
|
1,960 sq. feet
|
2 baths 3 beds |
show details | |

|
#44
SW 109th St
Seattle, WA 98146
|
2,410 sq. feet
|
1 baths 4 beds |
show details | |

|
#45
S 170th St
Seattle, WA 98188
|
2,650 sq. feet
|
2 baths 5 beds |
show details | |

|
#46
42nd Ct NE
Auburn, WA 98002
|
1,584 sq. feet
|
2 baths 3 beds |
show details | |

|
#47
SW 100th St
Seattle, WA 98146
|
2,130 sq. feet
|
1 baths 5 beds |
show details | |

|
#48
2nd Ave NW
Seattle, WA 98177
|
1,660 sq. feet
|
2 baths 3 beds |
show details | |

|
#49
S 239th St
Kent, WA 98032
|
2,210 sq. feet
|
1 baths 4 beds |
show details | |

|
Check over 1 million property listings on Foreclosure.com!
|
browse all offers | |||


Median year apartment built: 1982
Household type by relationship:
Households: 25,604- Male householders: 4,920 (648 living alone), Female householders: 4,914 (1,668 living alone)
6,391 spouses (6,303 opposite-sex spouses), 399 unmarried partners, (367 opposite-sex unmarried partners), 7,462 children (7,091 natural, 207 adopted, 163 stepchildren), 62 grandchildren, 54 brothers or sisters, 625 parents, 0 foster children, 115 other relatives, 508 non-relatives
- In group quarters: 148
Size of family households: 3,000 2-persons, 1,397 3-persons, 1,760 4-persons, 642 5-persons, 76 6-persons, 27 7-or-more-persons.
Size of nonfamily households: 2,491 1-person, 536 2-persons, 30 3-persons.
4,989 married couples with children.
580 single-parent households (190 men, 390 women).
74.3% of residents of Mercer Island speak English at home.
2.6% of residents speak Spanish at home (86% speak English very well, 3% speak English well, 6% speak English not well, 6% don't speak English at all).
7.7% of residents speak other Indo-European language at home (84% speak English very well, 10% speak English well, 5% speak English not well, 2% don't speak English at all).
15.0% of residents speak Asian or Pacific Island language at home (59% speak English very well, 22% speak English well, 16% speak English not well, 4% don't speak English at all).
0.6% of residents speak other language at home (88% speak English very well, 12% speak English well).
Foreign born population: 6,560 (25.6%)
(61.3% of them are naturalized citizens)
| Here: | 8.2 |
| State: | 6.5 |
| Here: | 3.6 |
| State: | 3.9 |
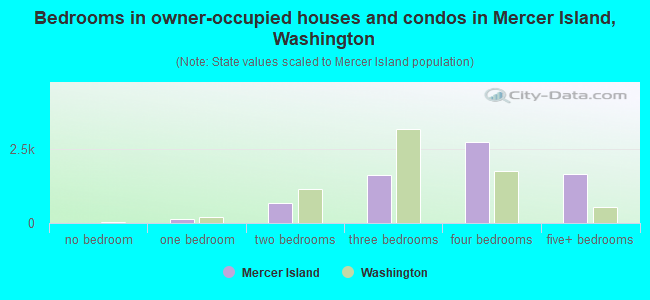
- Bedrooms in owner-occupied houses and condos in Mercer Island, Washington
- 14no bedroom
- 1511 bedroom
- 6862 bedrooms
- 1,6333 bedrooms
- 2,7314 bedrooms
- 1,6435+ bedrooms
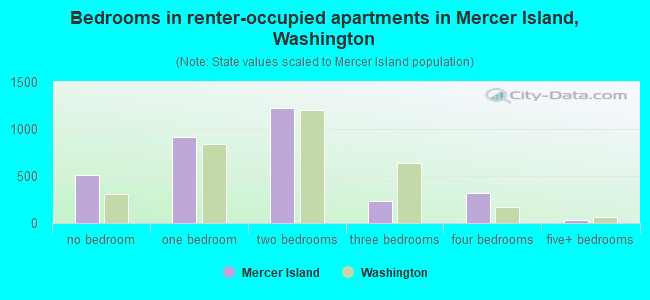
- Bedrooms in renter-occupied apartments in Mercer Island, Washington
- 508no bedroom
- 9161 bedroom
- 1,2192 bedrooms
- 2373 bedrooms
- 3164 bedrooms
- 355+ bedrooms
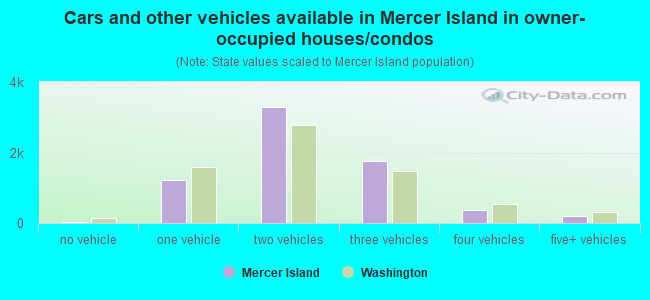
- Cars and other vehicles available in Mercer Island in owner-occupied houses/condos
- 24no vehicle
- 1,2201 vehicle
- 3,2782 vehicles
- 1,7633 vehicles
- 3814 vehicles
- 1935+ vehicles
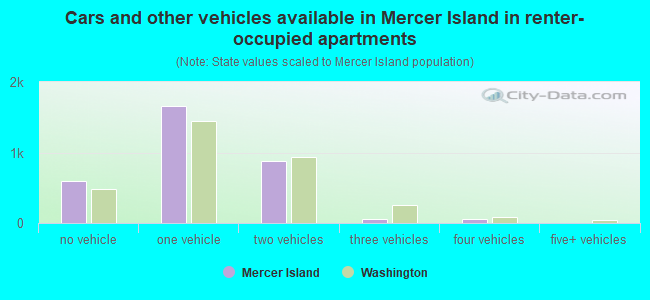
- Cars and other vehicles available in Mercer Island in renter-occupied apartments
- 592no vehicle
- 1,6561 vehicle
- 8782 vehicles
- 553 vehicles
- 514 vehicles
- 05+ vehicles
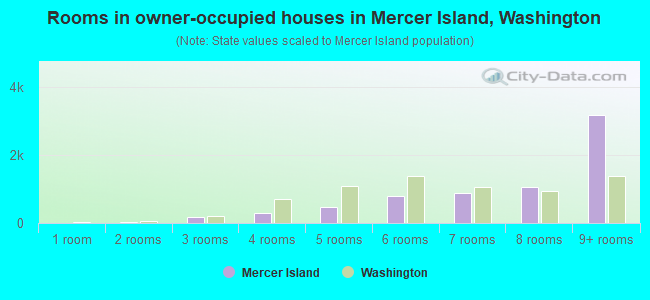
- Rooms in owner-occupied houses in Mercer Island, Washington
- 01 room
- 252 rooms
- 1863 rooms
- 3034 rooms
- 4585 rooms
- 7866 rooms
- 8817 rooms
- 1,0458 rooms
- 3,1759+ rooms
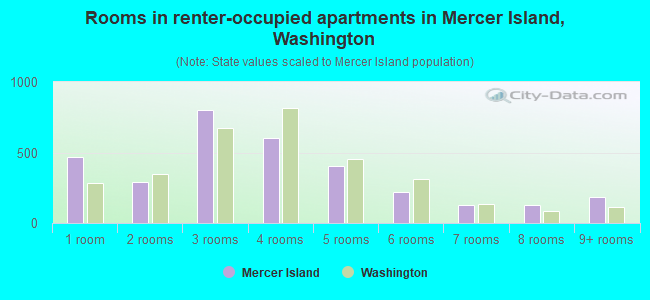
- Rooms in renter-occupied apartments in Mercer Island, Washington
- 4671 room
- 2892 rooms
- 8023 rooms
- 6054 rooms
- 4045 rooms
- 2216 rooms
- 1287 rooms
- 1318 rooms
- 1849+ rooms
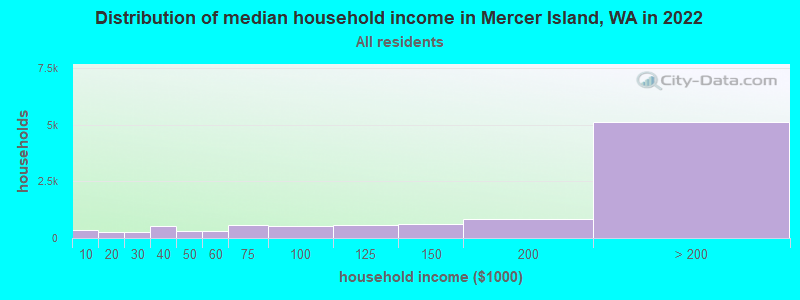
Mercer Island, WA household income distribution

- 356Less than $10,000
- 250$10,000 to $19,999
- 243$20,000 to $29,999
- 510$30,000 to $39,999
- 292$40,000 to $49,999
- 315$50,000 to $59,999
- 567$60,000 to $74,999
- 539$75,000 to $99,999
- 587$100,000 to $124,999
- 619$125,000 to $149,999
- 828$150,000 to $199,999
- 5,121$200,000 or more
Home value of owner - occupied houses in 2022 in Mercer Island, WA
-
- 66Less than $10,000
- 23$100,000 to $124,999
- 51$125,000 to $149,999
- 4$175,000 to $199,999
- 27$200,000 to $249,999
- 9$250,000 to $299,999
- 87$300,000 to $399,999
- 99$400,000 to $499,999
- 256$500,000 to $749,999
- 264$750,000 to $999,999
- 1,788$1,000,000 to $1,499,999
- 2,364$1,500,000 to $1,999,999
- 4,295$2,000,000 or more
Rent paid by renters in 2022 in Mercer Island, WA
-
- 12$300 to $349
- 46$500 to $549
- 183$1,000 to $1,249
- 83$1,250 to $1,499
- 834$1,500 to $1,999
- 814$2,000 to $2,499
- 351$2,500 to $2,999
- 319$3,000 to $3,499
- 504$3,500 or more
- 138No cash rent
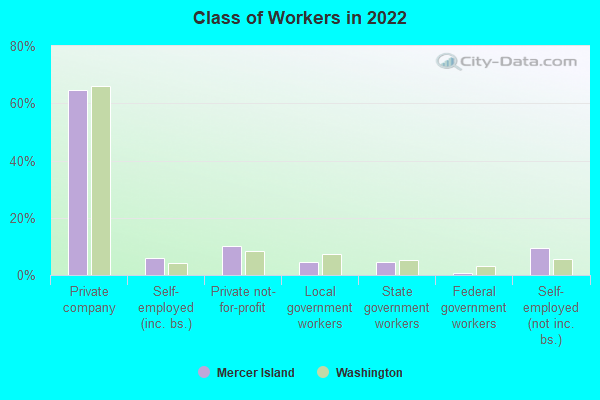
Percentage of workers working in this county: 98.1%
Number of people working at home: 4,863 (40.9% of all workers)
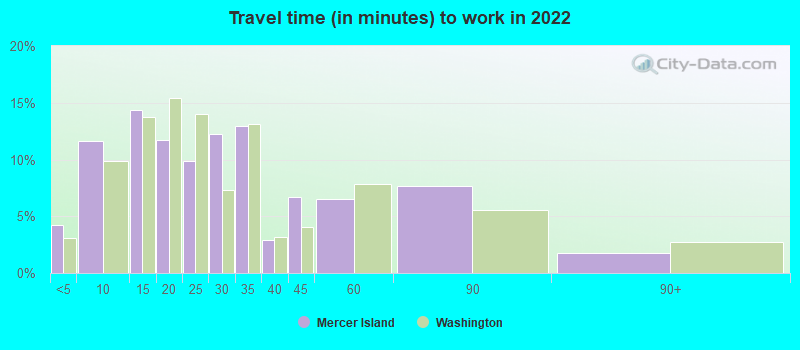
Travel time to work (commute)
- Less than 5 minutes: 222
- 5 to 9 minutes: 614
- 10 to 14 minutes: 606
- 15 to 19 minutes: 818
- 20 to 24 minutes: 1,446
- 25 to 29 minutes: 642
- 30 to 34 minutes: 1,606
- 35 to 39 minutes: 371
- 40 to 44 minutes: 329
- 45 to 59 minutes: 554
- 60 to 89 minutes: 173
- 90 or more minutes: 113
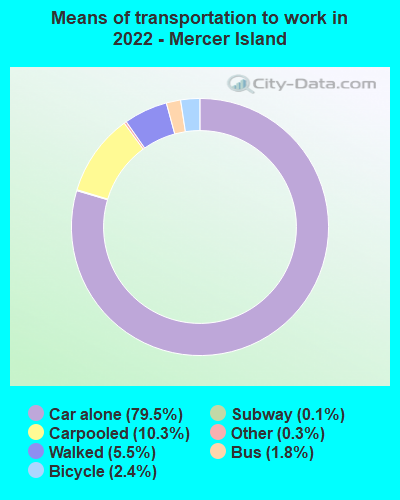
Means of transportation to work:
- Drove a car alone: 4,542 (47.7%)
- Carpooled: 562 (5.9%)
- Bus: 63 (0.7%)
- Long-distance train or commuter rail: 3 (0.0%)
- Taxi: 17 (0.2%)
- Bicycle: 127 (1.3%)
- Walked: 279 (2.9%)
- Worked at home: 4,863 (51.1%)
- Unemployment by race in 2022
- Unemployment rate for White non-Hispanic residents
- 2.2%Males
- 2.1%Females
- Unemployment rate for Black residents
- 21.3%Females
- Unemployment rate for Asian residents
- 1.8%Males
- 0.3%Females
- Unemployment rate for two or more race residents
- 4.4%Females
- Unemployment rate for Hispanic or Latino residents
- 2.7%Males
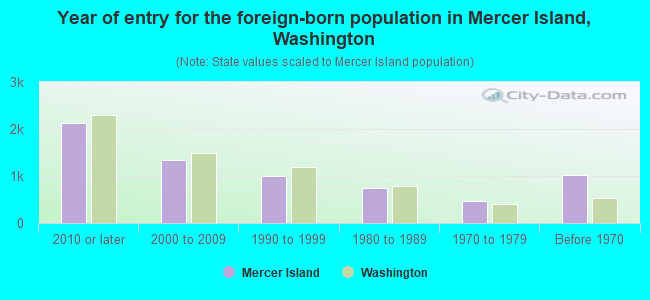
- Year of entry for the foreign-born population in Mercer Island, Washington
- 2,1302010 or later
- 1,3432000 to 2009
- 9991990 to 1999
- 7391980 to 1989
- 4691970 to 1979
- 1,022Before 1970
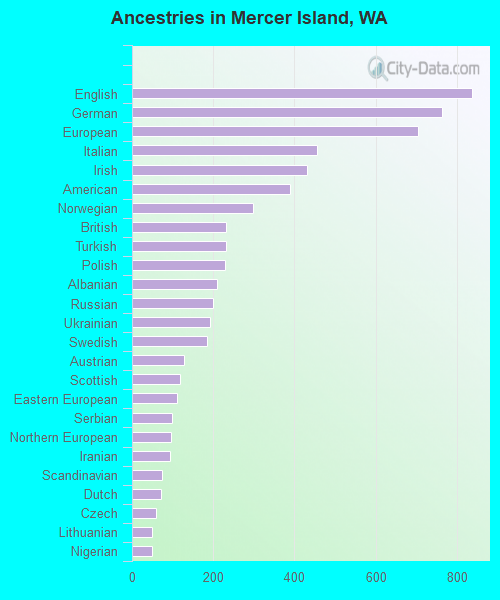
First ancestries reported:
- English: 837 (6.2%)
- German: 762 (5.6%)
- European: 704 (5.2%)
- Italian: 456 (3.4%)
- Irish: 432 (3.2%)
- American: 388 (2.9%)
- Norwegian: 297 (2.2%)
- British: 232 (1.7%)
- Turkish: 232 (1.7%)
- Polish: 229 (1.7%)
- Albanian: 210 (1.5%)
- Russian: 200 (1.5%)
- Ukrainian: 192 (1.4%)
- Swedish: 184 (1.4%)
- Austrian: 129 (0.9%)
- Scottish: 117 (0.9%)
- Eastern European: 110 (0.8%)
- Serbian: 99 (0.7%)
- Northern European: 97 (0.7%)
- Iranian: 94 (0.7%)
- Scandinavian: 75 (0.6%)
- Dutch: 72 (0.5%)
- Czech: 60 (0.4%)
- Lithuanian: 49 (0.4%)
- Nigerian: 49 (0.4%)
- French: 47 (0.3%)
- Scotch-Irish: 42 (0.3%)
- Romanian: 35 (0.3%)
- Canadian: 28 (0.2%)
- Belgian: 26 (0.2%)
- Yugoslavian: 26 (0.2%)
- Brazilian: 25 (0.2%)
- Danish: 24 (0.2%)
- Hungarian: 23 (0.2%)
- Greek: 23 (0.2%)
- Guyanese: 22 (0.2%)
- African: 21 (0.2%)
- French Canadian: 17 (0.1%)
- Finnish: 14 (0.1%)
- Swiss: 13 (0.10%)
- Armenian: 13 (0.10%)
- Egyptian: 11 (0.08%)
- Slovak: 11 (0.08%)
- Portuguese: 11 (0.08%)
- Israeli: 9 (0.07%)
- Welsh: 8 (0.06%)
- Kenyan: 6 (0.04%)
- Slavic: 5 (0.04%)
- Pennsylvania German: 4 (0.03%)
- Senegalese: 4 (0.03%)
- Estonian: 4 (0.03%)
- South African: 2 (0.01%)
Most common places of birth for foreign-born residents (%):
| Mercer Island: | 28.6% (1,876) |
| Washington: | 7.4% (84,470) |
| Mercer Island: | 8.7% (569) |
| Washington: | 8.9% (101,353) |
| Mercer Island: | 7.0% (462) |
| Washington: | 4.3% (48,886) |
| Mercer Island: | 5.3% (347) |
| Washington: | 4.1% (47,238) |
| Mercer Island: | 5.1% (337) |
| Washington: | 0.8% (8,785) |
| Mercer Island: | 4.6% (301) |
| Washington: | 1.5% (16,607) |
| Mercer Island: | 3.1% (205) |
| Washington: | 0.8% (9,359) |
| Mercer Island: | 2.9% (193) |
| Washington: | 0.3% (3,673) |
| Mercer Island: | 2.6% (172) |
| Washington: | 1.0% (10,943) |
| Mercer Island: | 2.4% (160) |
| Washington: | 21.1% (241,655) |
| Mercer Island: | 2.2% (142) |
| Washington: | 3.1% (35,872) |
| Mercer Island: | 1.9% (123) |
| Washington: | 0.2% (2,284) |
| Mercer Island: | 1.8% (116) |
| Washington: | 0.2% (2,506) |
| Mercer Island: | 1.7% (114) |
| Washington: | 0.9% (9,937) |
| Mercer Island: | 1.7% (112) |
| Washington: | 5.4% (62,003) |
| Mercer Island: | 1.6% (106) |
| Washington: | 0.3% (2,970) |
| Mercer Island: | 1.6% (104) |
| Washington: | 1.9% (21,540) |
Place of birth for U.S.-born residents:
- This state: 8,574
- Other state: 9,824
- Northeast: 2,079
- Midwest: 2,769
- South: 1,710
- West: 3,288
85.9% of Mercer Island residents lived in the same house 1 years ago.
Out of people who lived in different houses, 38.2% lived in this county.
Out of people who lived in different counties, 16.0% lived in Washington.
| Mercer Island: | 85.9% |
| State average: | 85.2% |
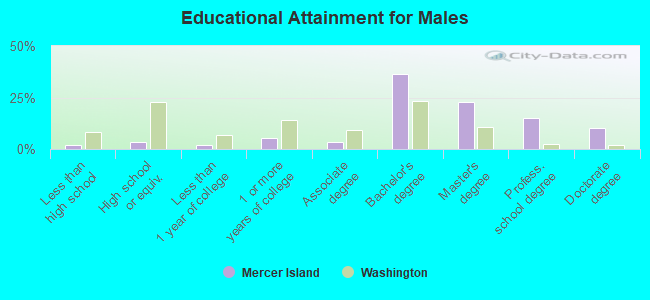
Education attainment for males 25 years and older:
- No schooling: 40
- Nursery to 4th grade: 27
- 5th and 6th grade: 22
- 7th and 8th grade: 0
- 9th grade: 17
- 10th grade: 16
- 11th grade: 8
- 12th grade, no diploma: 49
- High school graduate (or equivalency): 286
- Less than 1 year of college: 153
- Some college more than 1 year, no degree: 468
- Associate degree: 288
- Bachelor's degree: 3,201
- Master's degree: 1,994
- Professional school degree: 1,310
- Doctorate degree: 897
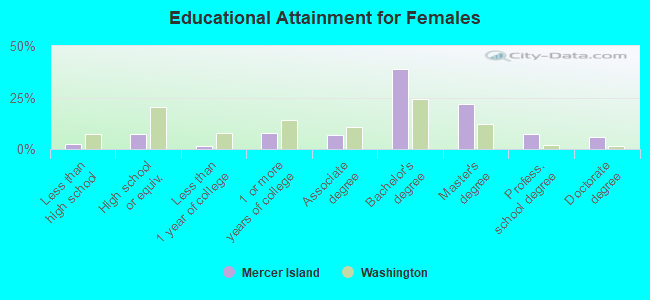
Education attainment for females 25 years and older:
- No schooling: 154
- Nursery to 4th grade: 29
- 5th and 6th grade: 18
- 7th and 8th grade: 3
- 9th grade: 0
- 10th grade: 0
- 11th grade: 8
- 12th grade, no diploma: 31
- High school graduate (or equivalency): 710
- Less than 1 year of college: 166
- Some college more than 1 year, no degree: 759
- Associate degree: 679
- Bachelor's degree: 3,831
- Master's degree: 2,154
- Professional school degree: 721
- Doctorate degree: 595


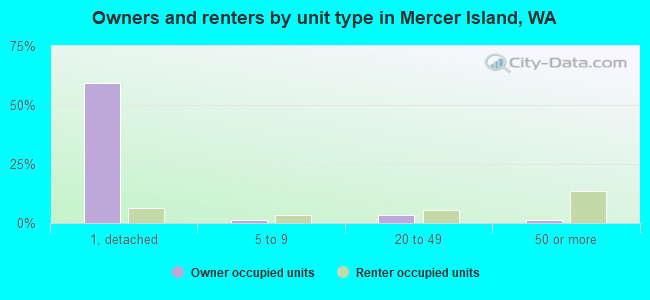
Housing units in structures:
- One, detached: 7,140
- One, attached: 68
- Two: 25
- 3 or 4: 86
- 5 to 9: 512
- 10 to 19: 413
- 20 to 49: 951
- 50 or more: 1,603
- Mobile homes: 56
Housing units lacking complete kitchen facilities in 2022: 1.9%
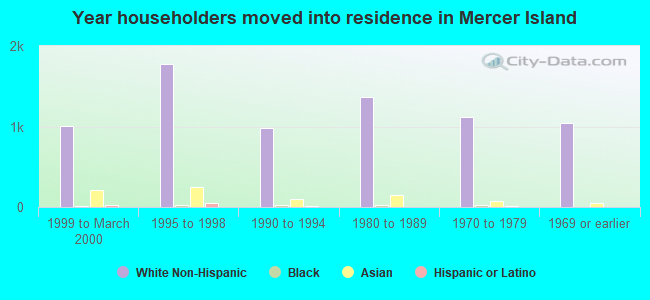
House/condo owner moved in on average 10 years ago
Renter moved in on average 3 years ago
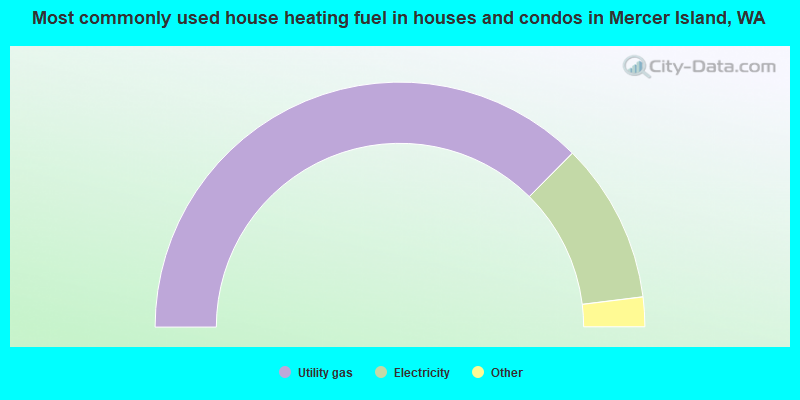
- 74.9%Utility gas
- 21.2%Electricity
- 1.7%Fuel oil, kerosene, etc.
- 1.5%Bottled, tank, or LP gas
- 0.3%Wood
- 0.2%Solar energy
- 0.1%No fuel used
- 0.1%Other fuel
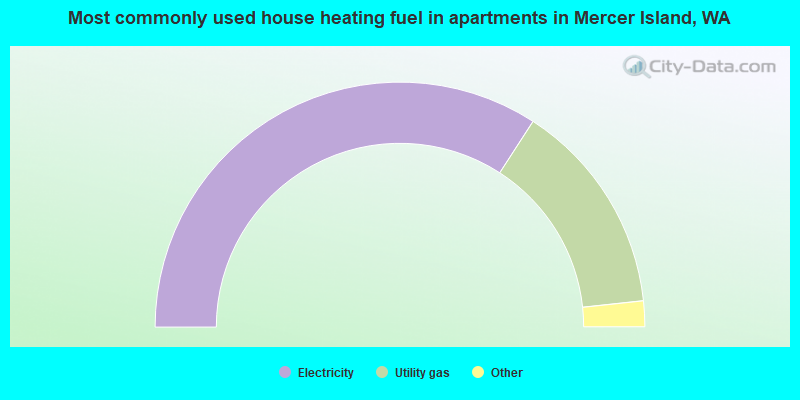
- 68.3%Electricity
- 28.3%Utility gas
- 1.8%No fuel used
- 0.8%Bottled, tank, or LP gas
- 0.7%Other fuel
- 0.2%Fuel oil, kerosene, etc.
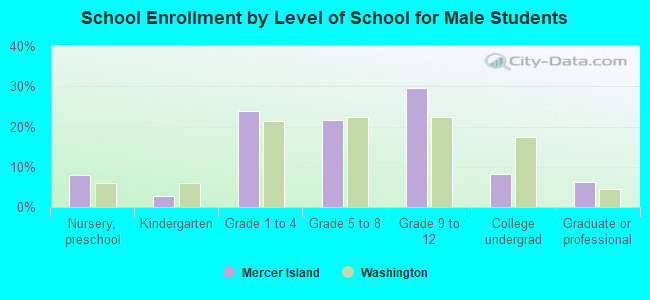
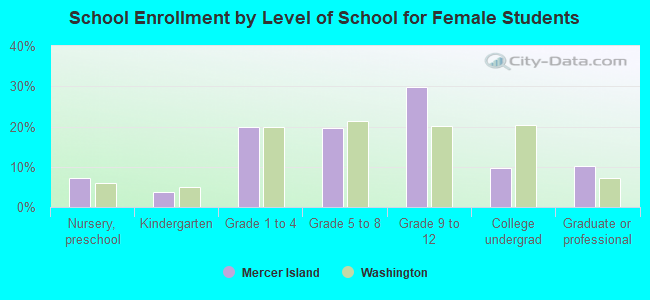
Private vs. public school enrollment:
| Here: | 13.7% |
| Washington: | 12.4% |
| Here: | 11.9% |
| Washington: | 9.2% |
| Here: | 21.7% |
| Washington: | 16.5% |