Matawan, NJ (New Jersey) Houses and Residents
| Matawan: | $452,954 |
| New Jersey: | $428,900 |
Mean price in 2022:
Detached houses: $608,276
Here: $608,276 State: $537,591 Townhouses or other attached units: $518,861
Here: $518,861 State: $381,113 In 5-or-more-unit structures: $388,325
Here: $388,325 State: $368,745
Total population: 8,718 (All urban)
Houses: 3,910 (3,795 occupied: 2,402 owner occupied, 1,458 renter occupied)
| % of renters here: | 38% |
| State: | 35% |
Housing density: 1,715 houses/condos per square mile
Median price asked for vacant for-sale houses and condos in 2022 in this county: $430,351.
Median contract rent in 2022: $1,624 (lower quartile is $1,304, upper quartile is $1,953)
Median rent asked for vacant for-rent units in 2022: $2,229
Median gross rent in Matawan, NJ in 2022: $1,734
Housing units in Matawan with a mortgage: 1,671 (249 second mortgage, 0 home equity loan, 221 both second mortgage and home equity loan)
Houses without a mortgage: 21
Median household income for houses/condos with a mortgage: $151,749
Median household income for apartments without a mortgage: $117,937
Median monthly housing costs: $1,940
Compare current foreclosures in Matawan, NJ:
| Photo | Address | Area | Beds / Baths | Price | Details |
|---|---|---|---|---|---|

|
#1
Main St
Matawan, NJ 07747
|
- sq. feet
|
- baths - beds |
show details | |

|
#2
Wilson Ave
Matawan, NJ 07747
|
1,464 sq. feet
|
- baths - beds |
show details | |

|
#3
Montana Ct
Matawan, NJ 07747
|
7,901 sq. feet
|
- baths - beds |
show details | |

|
#4
Navajo Dr
Matawan, NJ 07747
|
1,851 sq. feet
|
- baths - beds |
show details | |

|
#5
Broad St
Matawan, NJ 07747
|
1,400 sq. feet
|
- baths - beds |
show details | |

|
#6
Broad St
Matawan, NJ 07747
|
- sq. feet
|
- baths - beds |
show details | |

|
#7
Oxford Ln
Matawan, NJ 07747
|
2,304 sq. feet
|
- baths - beds |
show details | |

|
#8
Lorenzo Ct
Matawan, NJ 07747
|
1,284 sq. feet
|
- baths - beds |
show details | |

|
#9
N Concourse
Matawan, NJ 07747
|
- sq. feet
|
- baths - beds |
show details | |

|
#10
Pemberton Dr
Matawan, NJ 07747
|
2,277 sq. feet
|
- baths - beds |
show details |
| Photo | Address | Area | Beds / Baths | Price | Details |
|---|---|---|---|---|---|

|
#11
Lloyd Rd
Matawan, NJ 07747
|
2,272 sq. feet
|
- baths - beds |
show details | |

|
#12
Lloyd Rd
Matawan, NJ 07747
|
2,272 sq. feet
|
- baths - beds |
show details | |

|
#13
Mathiasen Pl
Matawan, NJ 07747
|
1,216 sq. feet
|
- baths - beds |
show details | |

|
#14
Cross Rd Apt 35
Matawan, NJ 07747
|
- sq. feet
|
- baths - beds |
show details | |

|
#15
Lexington Cir
Matawan, NJ 07747
|
2,017 sq. feet
|
- baths - beds |
show details | |

|
#16
Wilson Ave
Matawan, NJ 07747
|
1,464 sq. feet
|
- baths - beds |
show details | |

|
#17
Lloyd Rd
Matawan, NJ 07747
|
- sq. feet
|
- baths - beds |
show details | |

|
#18
Euclid Ave
Matawan, NJ 07747
|
1,152 sq. feet
|
- baths - beds |
show details | |

|
#19
Church St
Matawan, NJ 07747
|
1,929 sq. feet
|
- baths - beds |
show details | |

|
#20
Sutton Dr Apt O12
Matawan, NJ 07747
|
- sq. feet
|
- baths - beds |
show details |
| Photo | Address | Area | Beds / Baths | Price | Details |
|---|---|---|---|---|---|

|
#21
Tara Dr
Matawan, NJ 07747
|
7,901 sq. feet
|
- baths - beds |
show details | |

|
#22
Freneau Ave
Matawan, NJ 07747
|
13,713 sq. feet
|
- baths - beds |
show details | |

|
#23
State Route 34
Matawan, NJ 07747
|
- sq. feet
|
- baths - beds |
show details | |

|
#24
Atlantic Ave
Matawan, NJ 07747
|
- sq. feet
|
- baths - beds |
show details | |

|
#25
Sloan Ct
Matawan, NJ 07747
|
- sq. feet
|
- baths - beds |
show details | |

|
#26
Freneau Ave
Matawan, NJ 07747
|
1,486 sq. feet
|
- baths - beds |
show details | |

|
#27
Harding Blvd
Matawan, NJ 07747
|
1,221 sq. feet
|
- baths - beds |
show details | |

|
#28
Iowa Ct
Matawan, NJ 07747
|
7,901 sq. feet
|
- baths - beds |
show details | |

|
#29
Church St
Matawan, NJ 07747
|
1,338 sq. feet
|
- baths - beds |
show details | |

|
#30
Crescent Pl
Matawan, NJ 07747
|
3,103 sq. feet
|
- baths - beds |
show details |
| Photo | Address | Area | Beds / Baths | Price | Details |
|---|---|---|---|---|---|

|
#31
Line Rd
Matawan, NJ 07747
|
3,038 sq. feet
|
- baths - beds |
show details | |

|
#32
Montana Ct # 4
Matawan, NJ 07747
|
7,901 sq. feet
|
- baths - beds |
show details | |

|
#33
Bramble Ln
Matawan, NJ 07747
|
1,635 sq. feet
|
- baths - beds |
show details | |

|
#34
Winchester Ct
Matawan, NJ 07747
|
2,364 sq. feet
|
- baths - beds |
show details | |

|
#35
Mill Rd
Matawan, NJ 07747
|
3,192 sq. feet
|
- baths - beds |
show details | |

|
#36
Russell Ct
Matawan, NJ 07747
|
1,835 sq. feet
|
- baths - beds |
show details | |

|
#37
Central Ave
Matawan, NJ 07747
|
- sq. feet
|
- baths - beds |
show details | |

|
#38
Gaston St
Matawan, NJ 07747
|
704 sq. feet
|
- baths - beds |
show details | |

|
#39
Heywood Ct
Matawan, NJ 07747
|
1,412 sq. feet
|
- baths - beds |
show details | |

|
#40
Sasha Ct
Matawan, NJ 07747
|
3,525 sq. feet
|
- baths - beds |
show details |
| Photo | Address | Area | Beds / Baths | Price | Details |
|---|---|---|---|---|---|

|
#41
Iowa Ct
Matawan, NJ 07747
|
7,901 sq. feet
|
- baths - beds |
show details | |

|
#42
Central Ave
Matawan, NJ 07747
|
- sq. feet
|
- baths - beds |
show details | |

|
#43
Ravine Dr Apt 26a
Matawan, NJ 07747
|
- sq. feet
|
- baths - beds |
show details | |

|
#44
Lenny Ct
Matawan, NJ 07747
|
1,284 sq. feet
|
- baths - beds |
show details | |

|
#45
Winchester Ct
Matawan, NJ 07747
|
2,364 sq. feet
|
- baths - beds |
show details | |

|
#46
Johnson Ave
Matawan, NJ 07747
|
1,994 sq. feet
|
- baths - beds |
show details | |

|
#47
Lloyd Rd
Matawan, NJ 07747
|
1,497 sq. feet
|
- baths - beds |
show details | |

|
#48
Ravine Dr
Matawan, NJ 07747
|
1,218 sq. feet
|
- baths - beds |
show details | |

|
#49
Cypress Ln
Matawan, NJ 07747
|
2,295 sq. feet
|
- baths - beds |
show details | |

|
Check over 1 million property listings on Foreclosure.com!
|
browse all offers | |||

Latest news about housing in Matawan, NJ collected exclusively by city-data.com from local newspapers, TV, and radio stations

 | Trying to buy a house in Matawan/East Brunswick...anyone selling? (20 replies) |
| Matawan Apartments (2 replies) |
| Real estate-Covid 19-Early numbers (81 replies) |
| 07747: Matawan vs Aberdeen vs Old Bridge part: Does it matter? (1 reply) |
| Seeking info about Matawan NJ (2 replies) |
| Looking for a good town / apartment around Monmouth County (4 replies) |

Median year apartment built: 1977
Household type by relationship:
Households: 9,561- Male householders: 2,023 (563 living alone), Female householders: 1,757 (615 living alone)
1,723 spouses (1,723 opposite-sex spouses), 336 unmarried partners, (327 opposite-sex unmarried partners), 2,778 children (2,591 natural, 38 adopted, 149 stepchildren), 169 grandchildren, 69 brothers or sisters, 137 parents, 12 foster children, 74 other relatives, 387 non-relatives
- In group quarters: 92
Size of family households: 860 2-persons, 582 3-persons, 573 4-persons, 191 5-persons, 48 6-persons, 29 7-or-more-persons.
Size of nonfamily households: 1,176 1-person, 286 2-persons, 34 3-persons, 66 6-persons.
1,458 married couples with children.
431 single-parent households (98 men, 333 women).
84.2% of residents of Matawan speak English at home.
4.8% of residents speak Spanish at home (74% speak English very well, 20% speak English well, 5% speak English not well).
4.8% of residents speak other Indo-European language at home (77% speak English very well, 16% speak English well, 6% speak English not well).
4.5% of residents speak Asian or Pacific Island language at home (53% speak English very well, 28% speak English well, 18% speak English not well).
0.3% of residents speak other language at home (68% speak English very well, 32% speak English not well).
Foreign born population: 1,255 (13.1%)
(86.1% of them are naturalized citizens)
| Here: | 6.7 |
| State: | 6.8 |
| Here: | 4.0 |
| State: | 3.9 |

- Bedrooms in owner-occupied houses and condos in Matawan, New Jersey
- 0no bedroom
- 461 bedroom
- 5272 bedrooms
- 8103 bedrooms
- 8094 bedrooms
- 2115+ bedrooms

- Bedrooms in renter-occupied apartments in Matawan, New Jersey
- 17no bedroom
- 6311 bedroom
- 6602 bedrooms
- 833 bedrooms
- 04 bedrooms
- 685+ bedrooms

- Cars and other vehicles available in Matawan in owner-occupied houses/condos
- 70no vehicle
- 6201 vehicle
- 1,0992 vehicles
- 4203 vehicles
- 1524 vehicles
- 415+ vehicles

- Cars and other vehicles available in Matawan in renter-occupied apartments
- 155no vehicle
- 8371 vehicle
- 3282 vehicles
- 713 vehicles
- 04 vehicles
- 685+ vehicles

- Rooms in owner-occupied houses in Matawan, New Jersey
- 01 room
- 02 rooms
- 763 rooms
- 2554 rooms
- 3395 rooms
- 4336 rooms
- 4787 rooms
- 3578 rooms
- 4669+ rooms

- Rooms in renter-occupied apartments in Matawan, New Jersey
- 171 room
- 792 rooms
- 3553 rooms
- 5314 rooms
- 3135 rooms
- 656 rooms
- 317 rooms
- 08 rooms
- 689+ rooms


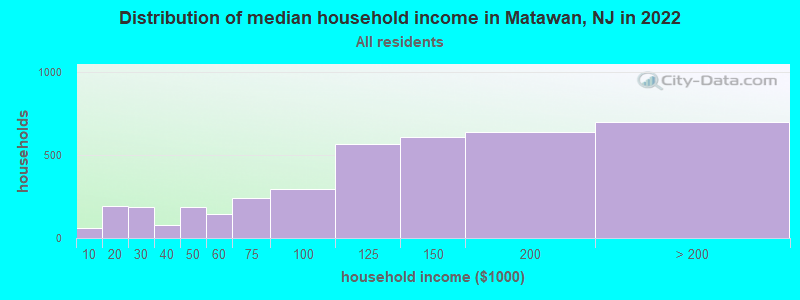
Matawan, NJ household income distribution

- 60Less than $10,000
- 195$10,000 to $19,999
- 186$20,000 to $29,999
- 78$30,000 to $39,999
- 188$40,000 to $49,999
- 144$50,000 to $59,999
- 242$60,000 to $74,999
- 294$75,000 to $99,999
- 563$100,000 to $124,999
- 610$125,000 to $149,999
- 638$150,000 to $199,999
- 698$200,000 or more
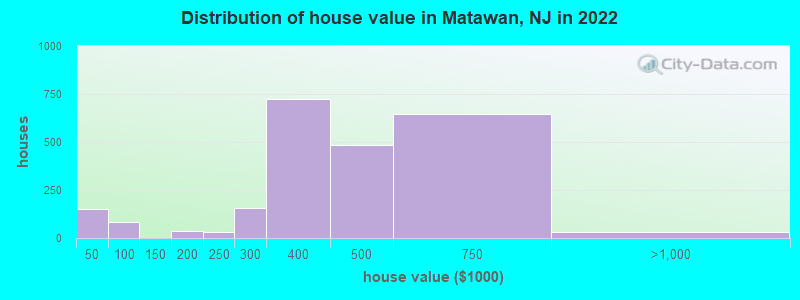
Home value of owner - occupied houses in 2022 in Matawan, NJ
-
- 34Less than $10,000
- 33$20,000 to $24,999
- 82$40,000 to $49,999
- 38$150,000 to $174,999
- 30$200,000 to $249,999
- 157$250,000 to $299,999
- 722$300,000 to $399,999
- 486$400,000 to $499,999
- 645$500,000 to $749,999
- 29$750,000 to $999,999
Rent paid by renters in 2022 in Matawan, NJ
-
- 16$150 to $199
- 53$350 to $399
- 54$750 to $799
- 23$900 to $999
- 97$1,000 to $1,249
- 229$1,250 to $1,499
- 544$1,500 to $1,999
- 272$2,000 to $2,499
- 12$2,500 to $2,999
- 49No cash rent


Percentage of workers working in this county: 59.6%
Number of people working at home: 1,191 (21.5% of all workers)
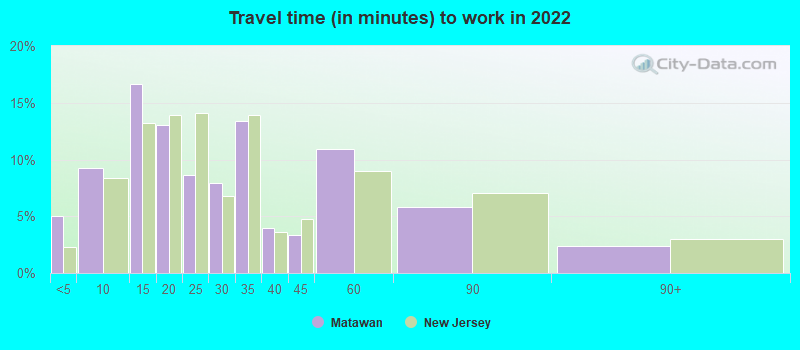
Travel time to work (commute)
- Less than 5 minutes: 233
- 5 to 9 minutes: 439
- 10 to 14 minutes: 369
- 15 to 19 minutes: 342
- 20 to 24 minutes: 741
- 25 to 29 minutes: 416
- 30 to 34 minutes: 627
- 35 to 39 minutes: 157
- 40 to 44 minutes: 151
- 45 to 59 minutes: 290
- 60 to 89 minutes: 366
- 90 or more minutes: 282
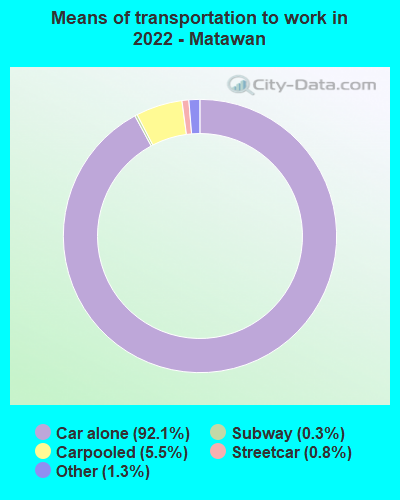
Means of transportation to work:
- Drove a car alone: 2,823 (65.5%)
- Carpooled: 199 (4.6%)
- Subway or elevated rail: 22 (0.5%)
- Long-distance train or commuter rail: 19 (0.4%)
- Taxi: 61 (1.4%)
- Walked: 2 (0.0%)
- Worked at home: 1,191 (27.6%)

- Unemployment by race in 2022
- Unemployment rate for White non-Hispanic residents
- 2.5%Males
- 1.9%Females
- Unemployment rate for Black residents
- 14.8%Males
- 3.7%Females
- Unemployment rate for Asian residents
- 17.0%Males
- Unemployment rate for Hispanic or Latino residents
- 2.0%Females

- Year of entry for the foreign-born population in Matawan, New Jersey
- 642010 or later
- 5702000 to 2009
- 3381990 to 1999
- 3111980 to 1989
- 1821970 to 1979
- 185Before 1970
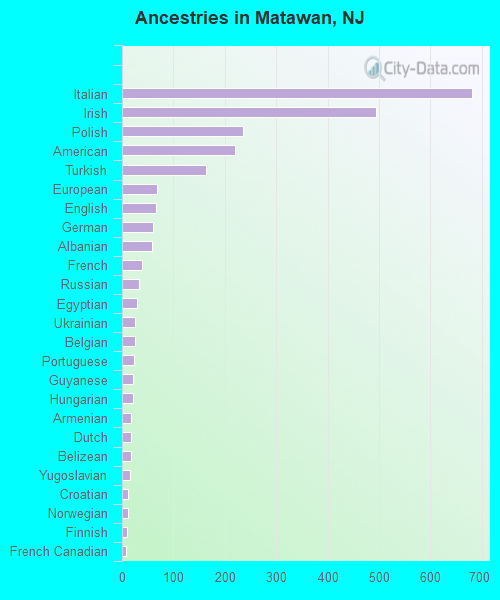
First ancestries reported:
- Italian: 680 (16.0%)
- Irish: 495 (11.7%)
- Polish: 235 (5.5%)
- American: 220 (5.2%)
- Turkish: 164 (3.9%)
- European: 69 (1.6%)
- English: 67 (1.6%)
- German: 61 (1.4%)
- Albanian: 59 (1.4%)
- French: 38 (0.9%)
- Russian: 33 (0.8%)
- Egyptian: 29 (0.7%)
- Ukrainian: 26 (0.6%)
- Belgian: 25 (0.6%)
- Portuguese: 24 (0.6%)
- Guyanese: 21 (0.5%)
- Hungarian: 21 (0.5%)
- Armenian: 17 (0.4%)
- Dutch: 17 (0.4%)
- Belizean: 17 (0.4%)
- Yugoslavian: 15 (0.4%)
- Croatian: 11 (0.3%)
- Norwegian: 11 (0.3%)
- Finnish: 10 (0.2%)
- French Canadian: 8 (0.2%)
- Macedonian: 7 (0.2%)
- British: 4 (0.09%)
- Welsh: 4 (0.09%)
- Romanian: 1 (0.02%)
Most common places of birth for foreign-born residents (%):
| Matawan: | 13.1% (164) |
| New Jersey: | 0.2% (3,482) |
| Matawan: | 7.9% (99) |
| New Jersey: | 0.2% (3,249) |
| Matawan: | 7.1% (89) |
| New Jersey: | 3.7% (78,969) |
| Matawan: | 6.1% (76) |
| New Jersey: | 0.5% (10,042) |
| Matawan: | 6.1% (76) |
| New Jersey: | 2.7% (58,563) |
| Matawan: | 4.9% (61) |
| New Jersey: | 12.8% (274,609) |
| Matawan: | 3.8% (48) |
| New Jersey: | 0.7% (15,548) |
| Matawan: | 3.6% (45) |
| New Jersey: | 0.4% (7,791) |
| Matawan: | 3.5% (44) |
| New Jersey: | 1.2% (26,173) |
| Matawan: | 3.0% (37) |
| New Jersey: | 0.7% (14,405) |
| Matawan: | 2.9% (36) |
| New Jersey: | 4.2% (90,817) |
| Matawan: | 2.6% (32) |
| New Jersey: | 0.4% (8,146) |
| Matawan: | 2.2% (28) |
| New Jersey: | 0.7% (15,533) |
| Matawan: | 2.1% (26) |
| New Jersey: | 1.6% (33,678) |
| Matawan: | 1.8% (22) |
| New Jersey: | 1.5% (33,198) |
| Matawan: | 1.7% (21) |
| New Jersey: | 0.1% (1,406) |
| Matawan: | 1.7% (21) |
| New Jersey: | 0.7% (15,644) |
Place of birth for U.S.-born residents:
- This state: 5,508
- Other state: 2,566
- Northeast: 2,214
- Midwest: 47
- South: 212
- West: 73
92.4% of Matawan residents lived in the same house 1 years ago.
Out of people who lived in different houses, 16.1% lived in this county.
Out of people who lived in different counties, 63.8% lived in New Jersey.
| Matawan: | 92.4% |
| State average: | 90.4% |
Education attainment for males 25 years and older:
- No schooling: 1
- Nursery to 4th grade: 0
- 5th and 6th grade: 0
- 7th and 8th grade: 0
- 9th grade: 0
- 10th grade: 1
- 11th grade: 29
- 12th grade, no diploma: 14
- High school graduate (or equivalency): 1,192
- Less than 1 year of college: 150
- Some college more than 1 year, no degree: 479
- Associate degree: 291
- Bachelor's degree: 1,077
- Master's degree: 334
- Professional school degree: 111
- Doctorate degree: 59

Education attainment for females 25 years and older:
- No schooling: 6
- Nursery to 4th grade: 0
- 5th and 6th grade: 0
- 7th and 8th grade: 31
- 9th grade: 7
- 10th grade: 24
- 11th grade: 14
- 12th grade, no diploma: 29
- High school graduate (or equivalency): 799
- Less than 1 year of college: 205
- Some college more than 1 year, no degree: 374
- Associate degree: 251
- Bachelor's degree: 1,159
- Master's degree: 389
- Professional school degree: 0
- Doctorate degree: 0


Housing units in structures:
- One, detached: 2,071
- One, attached: 94
- Two: 130
- 3 or 4: 349
- 5 to 9: 240
- 10 to 19: 477
- 20 to 49: 138
- 50 or more: 408
House/condo owner moved in on average 11 years ago
Renter moved in on average 1 years ago

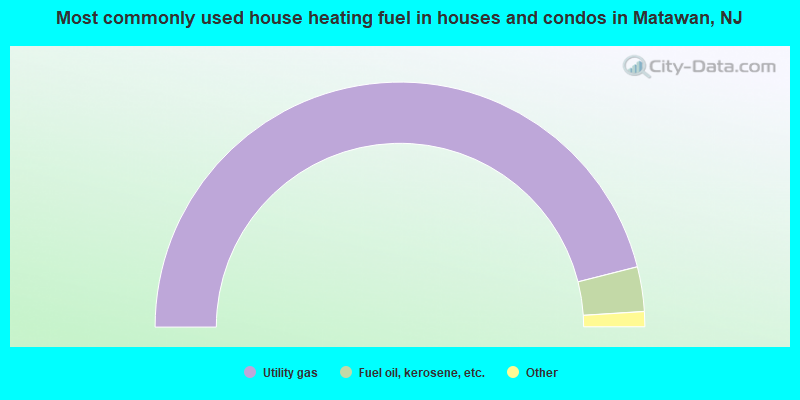
- 92.2%Utility gas
- 5.9%Fuel oil, kerosene, etc.
- 1.4%Bottled, tank, or LP gas
- 0.5%Electricity
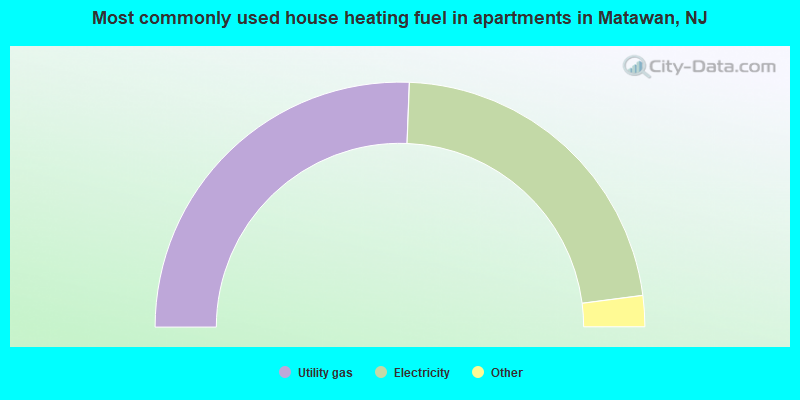
- 51.3%Utility gas
- 44.7%Electricity
- 2.2%Other fuel
- 1.8%Bottled, tank, or LP gas
Private vs. public school enrollment:
| Here: | 13.6% |
| New Jersey: | 12.3% |
| Here: | 2.4% |
| New Jersey: | 13.1% |
| Here: | 14.7% |
| New Jersey: | 33.2% |


