Martinez, CA (California) Houses and Residents
| Martinez: | $849,634 |
| California: | $715,900 |
Total population: 37,567 (Urban population: 36,131, Rural population: 36 (all nonfarm))
Houses: 15,469 (14,821 occupied: 10,547 owner occupied, 4,306 renter occupied)
| % of renters here: | 29% |
| State: | 44% |
Housing density: 1,263 houses/condos per square mile
Median price asked for vacant for-sale houses and condos in 2022: $2,628,264.
Median contract rent in 2022: $1,921 (lower quartile is $1,426, upper quartile is over $2,000)
Median rent asked for vacant for-rent units in 2022: $2,008
Median gross rent in Martinez, CA in 2022: over $2,000
Housing units in Martinez with a mortgage: 8,034 (762 second mortgage, 0 home equity loan, 719 both second mortgage and home equity loan)
Houses without a mortgage: 152
Median household income for houses/condos with a mortgage: $159,900
Median household income for apartments without a mortgage: $103,055
Median monthly housing costs: $2,338
Compare current foreclosures in Martinez, CA:
| Photo | Address | Area | Beds / Baths | Price | Details |
|---|---|---|---|---|---|

|
#1
Jane Ct
Martinez, CA 94553
|
1,121 sq. feet
|
2 baths 3 beds |
show details | |

|
#2
Leslie Ave
Martinez, CA 94553
|
1,006 sq. feet
|
1 baths 2 beds |
show details | |

|
#3
Roseann Dr
Martinez, CA 94553
|
2,454 sq. feet
|
2 baths 4 beds |
show details | |

|
#4
Brown St
Martinez, CA 94553
|
951 sq. feet
|
1 baths 2 beds |
show details | |

|
#5
Martinez Ave
Martinez, CA 94553
|
1,029 sq. feet
|
1 baths 2 beds |
show details | |

|
#6
Martha Dr
Martinez, CA 94553
|
955 sq. feet
|
1 baths 3 beds |
show details | |

|
#7
Vine Hill Way
Martinez, CA 94553
|
2,790 sq. feet
|
3 baths 4 beds |
show details | |

|
#8
Lost Lake Pl
Martinez, CA 94553
|
1,018 sq. feet
|
2 baths 2 beds |
show details | |

|
#9
Shadowfalls Ct
Martinez, CA 94553
|
1,242 sq. feet
|
2 baths 2 beds |
show details | |

|
#10
Chestnut St
Martinez, CA 94553
|
1,307 sq. feet
|
1 baths 3 beds |
show details |
| Photo | Address | Area | Beds / Baths | Price | Details |
|---|---|---|---|---|---|

|
#11
Knollwood Dr
Martinez, CA 94553
|
1,403 sq. feet
|
2 baths 3 beds |
show details | |

|
#12
Holiday Hills Dr
Martinez, CA 94553
|
1,197 sq. feet
|
2 baths 3 beds |
show details | |

|
#13
Irene Dr
Martinez, CA 94553
|
1,686 sq. feet
|
2 baths 5 beds |
show details | |

|
#14
Blue Ridge Dr
Martinez, CA 94553
|
1,386 sq. feet
|
2 baths 3 beds |
show details | |

|
#15
Arthur Rd
Martinez, CA 94553
|
1,432 sq. feet
|
2 baths 3 beds |
show details | |

|
#16
Medford Ct
Martinez, CA 94553
|
2,454 sq. feet
|
2 baths 4 beds |
show details | |

|
#17
Gilrix Dr
Martinez, CA 94553
|
2,088 sq. feet
|
2 baths 4 beds |
show details | |

|
#18
Pacheco Blvd
Martinez, CA 94553
|
831 sq. feet
|
1 baths 2 beds |
show details | |

|
#19
Glenwood Ct
Martinez, CA 94553
|
1,850 sq. feet
|
2 baths 4 beds |
show details | |

|
#20
4th Ave S
Martinez, CA 94553
|
1,265 sq. feet
|
1 baths 2 beds |
show details |
| Photo | Address | Area | Beds / Baths | Price | Details |
|---|---|---|---|---|---|

|
#21
Arcadia Ct
Martinez, CA 94553
|
1,695 sq. feet
|
2 baths 4 beds |
show details | |

|
#22
Center Ave
Martinez, CA 94553
|
1,390 sq. feet
|
2 baths 3 beds |
show details | |

|
#23
Brookside Dr
Martinez, CA 94553
|
1,624 sq. feet
|
2 baths 3 beds |
show details | |

|
#24
Pebblecreek Ct
Martinez, CA 94553
|
1,192 sq. feet
|
2 baths 2 beds |
show details | |

|
#25
Farm Ln
Martinez, CA 94553
|
939 sq. feet
|
2 baths 2 beds |
show details | |

|
#26
Hidden Creek Ct
Martinez, CA 94553
|
1,192 sq. feet
|
2 baths 2 beds |
show details | |

|
#27
Oak Manor Plz
Martinez, CA 94553
|
1,448 sq. feet
|
2 baths 3 beds |
show details | |

|
#28
Village Pl
Martinez, CA 94553
|
1,097 sq. feet
|
2 baths 2 beds |
show details | |

|
#29
Westward Pl
Martinez, CA 94553
|
1,332 sq. feet
|
2 baths 3 beds |
show details | |

|
#30
Veale Ave
Martinez, CA 94553
|
1,481 sq. feet
|
1 baths 3 beds |
show details |
| Photo | Address | Area | Beds / Baths | Price | Details |
|---|---|---|---|---|---|

|
#31
Pacheco Blvd
Martinez, CA 94553
|
831 sq. feet
|
1 baths 2 beds |
show details | |

|
#32
Raap Ave
Martinez, CA 94553
|
1,012 sq. feet
|
1 baths 3 beds |
show details | |

|
#33
Trailview Cir
Martinez, CA 94553
|
2,100 sq. feet
|
2 baths 3 beds |
show details | |

|
#34
Via Cordova Ln
Martinez, CA 94553
|
1,455 sq. feet
|
2 baths 3 beds |
show details | |

|
#35
S Crest Ave
Martinez, CA 94553
|
648 sq. feet
|
1 baths 3 beds |
show details | |

|
#36
Lake Reed Ct
Martinez, CA 94553
|
1,686 sq. feet
|
2 baths 3 beds |
show details | |

|
#37
Shadowfalls Dr
Martinez, CA 94553
|
1,686 sq. feet
|
2 baths 3 beds |
show details | |

|
#38
Duncan Dr
Martinez, CA 94553
|
1,352 sq. feet
|
2 baths 3 beds |
show details | |

|
#39
Ash St
Martinez, CA 94553
|
- sq. feet
|
- baths - beds |
show details | |

|
#40
Pacheco Blvd Apt D
Martinez, CA 94553
|
- sq. feet
|
- baths - beds |
show details |
| Photo | Address | Area | Beds / Baths | Price | Details |
|---|---|---|---|---|---|

|
#41
Ladybug Ln
Martinez, CA 94553
|
- sq. feet
|
- baths - beds |
show details | |

|
#42
Holly View Ct
Martinez, CA 94553
|
- sq. feet
|
- baths - beds |
show details | |

|
#43
Lindsey Dr
Martinez, CA 94553
|
- sq. feet
|
- baths - beds |
show details | |

|
#44
F St Apt 202
Martinez, CA 94553
|
- sq. feet
|
- baths - beds |
show details | |

|
#45
Medina Dr
Martinez, CA 94553
|
- sq. feet
|
- baths - beds |
show details | |

|
#46
Mont St Michel Way
Martinez, CA 94553
|
- sq. feet
|
- baths - beds |
show details | |

|
#47
J St Apt 133
Martinez, CA 94553
|
- sq. feet
|
- baths - beds |
show details | |

|
#48
Center Ave Apt 103
Martinez, CA 94553
|
- sq. feet
|
- baths - beds |
show details | |

|
#49
Euclid Avenue
Martinez, CA 94553
|
- sq. feet
|
- baths - beds |
show details | |

|
Check over 1 million property listings on Foreclosure.com!
|
browse all offers | |||

Latest news about housing in Martinez, CA collected exclusively by city-data.com from local newspapers, TV, and radio stations

 | Don’t make $235,000? Good luck buying a home in the Bay Area (124 replies) |
| Best place to purchase Condo...Concord, PH or Martinez (19 replies) |
| Confused - Benicia or Pleasant Hill/Martinez home buyer (5 replies) |
| Housing for TOURO student-Vallejo (20 replies) |
| Battle of the ages: Vallejo vs Sacramento vs Fresno House (37 replies) |
| The Los Angeles Homeless Containment Thread (9138 replies) |

Median year apartment built: 1971
Household type by relationship:
Households: 36,911- Male householders: 6,793 (1,424 living alone), Female householders: 7,749 (2,335 living alone)
7,685 spouses (7,605 opposite-sex spouses), 1,394 unmarried partners, (1,230 opposite-sex unmarried partners), 10,193 children (9,783 natural, 129 adopted, 280 stepchildren), 662 grandchildren, 338 brothers or sisters, 451 parents, 0 foster children, 201 other relatives, 846 non-relatives
- In group quarters: 594
Size of family households: 4,034 2-persons, 2,370 3-persons, 2,486 4-persons, 617 5-persons, 178 6-persons, 34 7-or-more-persons.
Size of nonfamily households: 3,803 1-person, 1,135 2-persons, 84 3-persons, 33 4-persons, 30 5-persons.
5,496 married couples with children.
1,224 single-parent households (347 men, 877 women).
80.4% of residents of Martinez speak English at home.
8.4% of residents speak Spanish at home (80% speak English very well, 14% speak English well, 5% speak English not well, 1% don't speak English at all).
3.5% of residents speak other Indo-European language at home (82% speak English very well, 14% speak English well, 4% speak English not well, 1% don't speak English at all).
5.4% of residents speak Asian or Pacific Island language at home (76% speak English very well, 15% speak English well, 7% speak English not well, 1% don't speak English at all).
0.7% of residents speak other language at home (95% speak English very well, 5% speak English well).
Foreign born population: 4,692 (12.7%)
(74.8% of them are naturalized citizens)
| Here: | 6.3 |
| State: | 6.0 |
| Here: | 4.1 |
| State: | 3.9 |

- Bedrooms in owner-occupied houses and condos in Martinez, California
- 0no bedroom
- 791 bedroom
- 1,7312 bedrooms
- 4,8873 bedrooms
- 3,1534 bedrooms
- 6975+ bedrooms

- Bedrooms in renter-occupied apartments in Martinez, California
- 242no bedroom
- 1,1081 bedroom
- 1,6902 bedrooms
- 9683 bedrooms
- 2624 bedrooms
- 375+ bedrooms

- Cars and other vehicles available in Martinez in owner-occupied houses/condos
- 89no vehicle
- 2,6191 vehicle
- 4,5402 vehicles
- 2,1653 vehicles
- 7934 vehicles
- 3415+ vehicles

- Cars and other vehicles available in Martinez in renter-occupied apartments
- 372no vehicle
- 1,8461 vehicle
- 1,5962 vehicles
- 4123 vehicles
- 664 vehicles
- 155+ vehicles

- Rooms in owner-occupied houses in Martinez, California
- 01 room
- 552 rooms
- 1253 rooms
- 9604 rooms
- 1,9315 rooms
- 2,6886 rooms
- 1,9587 rooms
- 1,3578 rooms
- 1,4739+ rooms

- Rooms in renter-occupied apartments in Martinez, California
- 2001 room
- 3532 rooms
- 7013 rooms
- 1,4024 rooms
- 6415 rooms
- 5476 rooms
- 2697 rooms
- 848 rooms
- 1089+ rooms


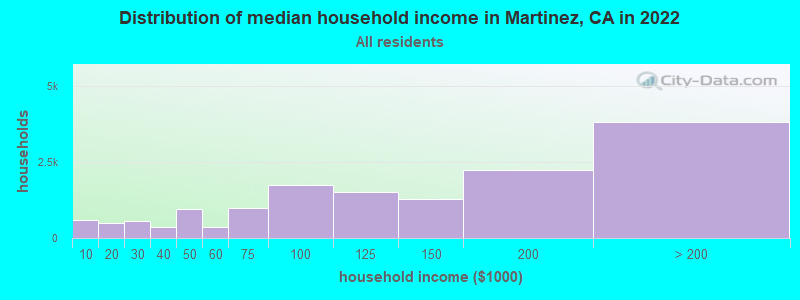
Martinez, CA household income distribution

- 580Less than $10,000
- 490$10,000 to $19,999
- 545$20,000 to $29,999
- 362$30,000 to $39,999
- 956$40,000 to $49,999
- 363$50,000 to $59,999
- 982$60,000 to $74,999
- 1,745$75,000 to $99,999
- 1,512$100,000 to $124,999
- 1,271$125,000 to $149,999
- 2,252$150,000 to $199,999
- 3,828$200,000 or more
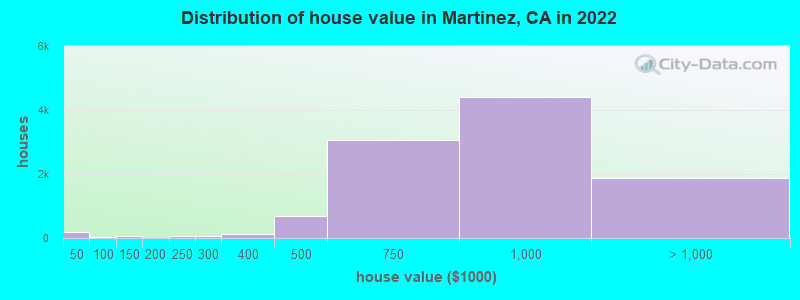
Home value of owner - occupied houses in 2022 in Martinez, CA
-
- 84Less than $10,000
- 35$15,000 to $19,999
- 31$20,000 to $24,999
- 11$25,000 to $29,999
- 9$35,000 to $39,999
- 8$40,000 to $49,999
- 9$60,000 to $69,999
- 20$80,000 to $89,999
- 48$100,000 to $124,999
- 8$150,000 to $174,999
- 73$200,000 to $249,999
- 63$250,000 to $299,999
- 127$300,000 to $399,999
- 697$400,000 to $499,999
- 3,062$500,000 to $749,999
- 4,411$750,000 to $999,999
- 1,591$1,000,000 to $1,499,999
- 125$1,500,000 to $1,999,999
- 172$2,000,000 or more
Rent paid by renters in 2022 in Martinez, CA
-
- 24$150 to $199
- 64$250 to $299
- 28$300 to $349
- 15$350 to $399
- 44$400 to $449
- 125$500 to $549
- 8$600 to $649
- 66$650 to $699
- 15$800 to $899
- 48$900 to $999
- 312$1,000 to $1,249
- 419$1,250 to $1,499
- 1,032$1,500 to $1,999
- 855$2,000 to $2,499
- 584$2,500 to $2,999
- 188$3,000 to $3,499
- 159$3,500 or more
- 108No cash rent


Percentage of workers working in this county: 81.3%
Number of people working at home: 3,954 (20.9% of all workers)
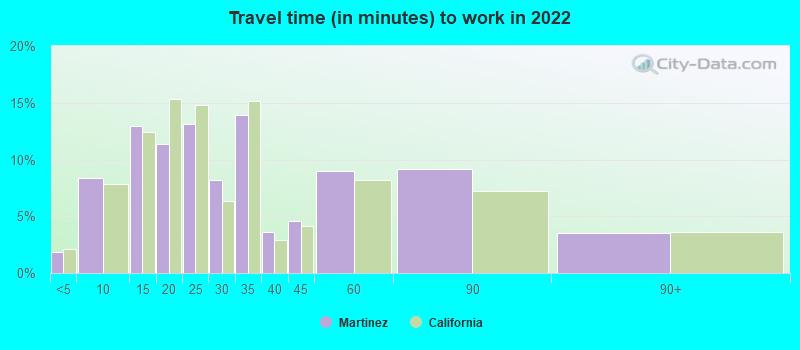
Travel time to work (commute)
- Less than 5 minutes: 391
- 5 to 9 minutes: 1,352
- 10 to 14 minutes: 2,505
- 15 to 19 minutes: 2,117
- 20 to 24 minutes: 1,921
- 25 to 29 minutes: 768
- 30 to 34 minutes: 1,400
- 35 to 39 minutes: 449
- 40 to 44 minutes: 797
- 45 to 59 minutes: 1,393
- 60 to 89 minutes: 1,499
- 90 or more minutes: 616
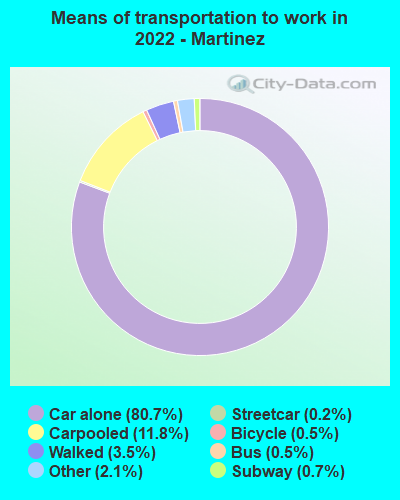
Means of transportation to work:
- Drove a car alone: 13,325 (63.3%)
- Carpooled: 2,174 (10.3%)
- Bus: 69 (0.3%)
- Subway or elevated rail: 20 (0.1%)
- Long-distance train or commuter rail: 94 (0.4%)
- Taxi: 368 (1.7%)
- Bicycle: 60 (0.3%)
- Walked: 820 (3.9%)
- Worked at home: 3,954 (18.8%)

- Unemployment by race in 2022
- Unemployment rate for White non-Hispanic residents
- 5.5%Males
- 5.1%Females
- Unemployment rate for American Indian and Alaska Native residents
- 9.8%Females
- Unemployment rate for Asian residents
- 3.5%Males
- 2.7%Females
- Unemployment rate for other race residents
- 4.9%Females
- Unemployment rate for two or more race residents
- 4.7%Males
- 2.4%Females
- Unemployment rate for Hispanic or Latino residents
- 3.4%Females

- Year of entry for the foreign-born population in Martinez, California
- 9592010 or later
- 8102000 to 2009
- 7941990 to 1999
- 8781980 to 1989
- 6301970 to 1979
- 921Before 1970

First ancestries reported:
- Irish: 1,218 (7.3%)
- Italian: 1,217 (7.3%)
- German: 981 (5.9%)
- American: 969 (5.8%)
- English: 925 (5.6%)
- European: 692 (4.2%)
- Portuguese: 242 (1.5%)
- Polish: 238 (1.4%)
- Scottish: 209 (1.3%)
- Norwegian: 179 (1.1%)
- Northern European: 147 (0.9%)
- Scotch-Irish: 116 (0.7%)
- Swedish: 116 (0.7%)
- Iranian: 99 (0.6%)
- Scandinavian: 95 (0.6%)
- British: 81 (0.5%)
- African: 78 (0.5%)
- Finnish: 73 (0.4%)
- Russian: 70 (0.4%)
- Dutch: 65 (0.4%)
- French: 59 (0.4%)
- Yugoslavian: 58 (0.3%)
- Lebanese: 54 (0.3%)
- Bulgarian: 54 (0.3%)
- Ukrainian: 53 (0.3%)
- Jamaican: 42 (0.3%)
- Maltese: 41 (0.2%)
- Greek: 40 (0.2%)
- Afghan: 34 (0.2%)
- Swiss: 34 (0.2%)
- Danish: 28 (0.2%)
- Eastern European: 27 (0.2%)
- Slavic: 22 (0.1%)
- Czech: 21 (0.1%)
- Armenian: 21 (0.1%)
- Hungarian: 19 (0.1%)
- Czechoslovakian: 16 (0.10%)
- French Canadian: 11 (0.07%)
- Jordanian: 7 (0.04%)
- Australian: 3 (0.02%)
Most common places of birth for foreign-born residents (%):
| Martinez: | 13.7% (609) |
| California: | 7.8% (818,297) |
| Martinez: | 12.8% (568) |
| California: | 6.6% (684,672) |
| Martinez: | 11.1% (491) |
| California: | 37.2% (3,881,193) |
| Martinez: | 5.1% (228) |
| California: | 0.7% (74,025) |
| Martinez: | 4.4% (197) |
| California: | 5.2% (539,184) |
| Martinez: | 4.0% (179) |
| California: | 1.0% (105,215) |
| Martinez: | 3.5% (155) |
| California: | 1.2% (127,477) |
| Martinez: | 3.2% (143) |
| California: | 3.0% (315,248) |
| Martinez: | 3.0% (132) |
| California: | 0.5% (48,911) |
| Martinez: | 2.7% (120) |
| California: | 4.9% (512,335) |
| Martinez: | 2.2% (98) |
| California: | 1.7% (176,274) |
| Martinez: | 1.9% (85) |
| California: | 0.5% (53,260) |
| Martinez: | 1.9% (83) |
| California: | 0.7% (73,304) |
| Martinez: | 1.7% (75) |
| California: | 2.0% (206,004) |
| Martinez: | 1.5% (68) |
| California: | 0.6% (57,953) |
Place of birth for U.S.-born residents:
- This state: 25,298
- Other state: 6,052
- Northeast: 1,368
- Midwest: 1,977
- South: 1,508
- West: 1,183
87.8% of Martinez residents lived in the same house 1 years ago.
Out of people who lived in different houses, 39.3% lived in this county.
Out of people who lived in different counties, 64.2% lived in California.
| Martinez: | 87.8% |
| State average: | 88.9% |
Education attainment for males 25 years and older:
- No schooling: 89
- Nursery to 4th grade: 11
- 5th and 6th grade: 56
- 7th and 8th grade: 19
- 9th grade: 0
- 10th grade: 41
- 11th grade: 39
- 12th grade, no diploma: 193
- High school graduate (or equivalency): 2,272
- Less than 1 year of college: 961
- Some college more than 1 year, no degree: 1,701
- Associate degree: 1,619
- Bachelor's degree: 4,195
- Master's degree: 1,224
- Professional school degree: 360
- Doctorate degree: 286

Education attainment for females 25 years and older:
- No schooling: 150
- Nursery to 4th grade: 44
- 5th and 6th grade: 17
- 7th and 8th grade: 4
- 9th grade: 60
- 10th grade: 153
- 11th grade: 14
- 12th grade, no diploma: 210
- High school graduate (or equivalency): 2,229
- Less than 1 year of college: 1,078
- Some college more than 1 year, no degree: 2,059
- Associate degree: 1,507
- Bachelor's degree: 3,973
- Master's degree: 1,522
- Professional school degree: 454
- Doctorate degree: 313


Housing units in structures:
- One, detached: 9,783
- One, attached: 2,447
- Two: 348
- 3 or 4: 756
- 5 to 9: 629
- 10 to 19: 555
- 20 to 49: 368
- 50 or more: 486
- Mobile homes: 48
- Boats, RVs, vans, etc.: 44
Housing units lacking complete kitchen facilities in 2022: 0.8%
House/condo owner moved in on average 14 years ago
Renter moved in on average 6 years ago


- 76.8%Utility gas
- 20.3%Electricity
- 1.5%Solar energy
- 0.8%Bottled, tank, or LP gas
- 0.5%Wood
- 0.2%No fuel used
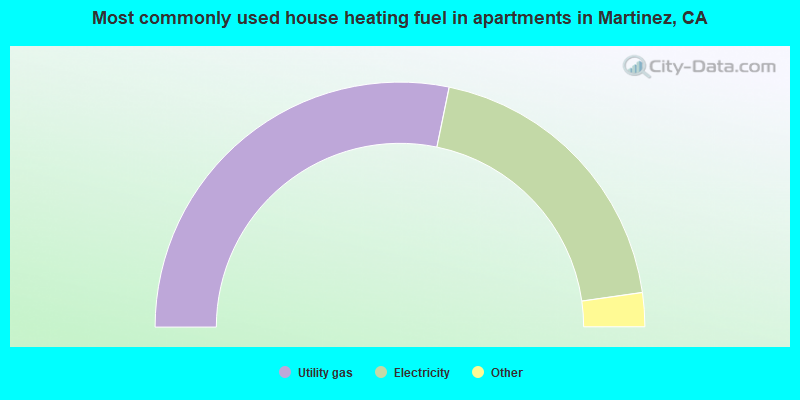
- 56.5%Utility gas
- 39.1%Electricity
- 3.2%No fuel used
- 0.9%Other fuel
- 0.4%Bottled, tank, or LP gas
Private vs. public school enrollment:
| Here: | 7.3% |
| California: | 10.5% |
| Here: | 8.5% |
| California: | 8.5% |
| Here: | 9.3% |
| California: | 15.9% |


