Marlborough, CT (Connecticut) Houses and Residents
| Marlborough: | $386,763 |
| Connecticut: | $347,200 |
Total population: 6,404 (Urban population: 3,091, Rural population: 2,618 (35 farm, 2,583 nonfarm))
Houses: 2,057 (2,005 occupied: 1,811 owner occupied, 194 renter occupied)
| % of renters here: | 10% |
| State: | 34% |
Housing density: 88 houses/condos per square mile
Median price asked for vacant for-sale houses and condos in 2022 in this county: $360,195.
Median contract rent in 2022: $1,039 (lower quartile is $646, upper quartile is $1,353)
Median gross rent in Marlborough, CT in 2022: $1,266
Housing units in Marlborough with a mortgage: 1,351 (155 second mortgage, 246 home equity loan, 25 both second mortgage and home equity loan)
Houses without a mortgage: 269
Compare current foreclosures near Marlborough, CT:
| Photo | Address | Area | Beds / Baths | Price | Details |
|---|---|---|---|---|---|

|
#1
Park Rd
Marlborough, CT 06447
|
1,134 sq. feet
|
1 baths 3 beds |
show details | |

|
#2
Pettengill Rd
Marlborough, CT 06447
|
1,796 sq. feet
|
2 baths 3 beds |
show details | |

|
#3
Jones Hollow Rd
Marlborough, CT 06447
|
1,984 sq. feet
|
2 baths 3 beds |
show details | |

|
#4
Denler Dr
Marlborough, CT 06447
|
1,476 sq. feet
|
3 baths 3 beds |
show details | |

|
#5
Saner Rd
Marlborough, CT 06447
|
2,386 sq. feet
|
2 baths 4 beds |
show details | |

|
#6
Avalon Ln
Marlborough, CT 06447
|
3,740 sq. feet
|
2 baths 4 beds |
show details | |

|
#7
Roberts Rd
Marlborough, CT 06447
|
1,881 sq. feet
|
1 baths 3 beds |
show details | |

|
#8
Lake Dr E
Oakdale, CT 06370
|
1,346 sq. feet
|
1 baths 3 beds |
$349,900
|
show details |

|
#9
Shares Ln
South Windsor, CT 06074
|
1,850 sq. feet
|
2 baths 4 beds |
$365,000
|
show details |

|
#10
Irving St
Manchester, CT 06042
|
1,335 sq. feet
|
2 baths 3 beds |
$251,750
|
show details |
| Photo | Address | Area | Beds / Baths | Price | Details |
|---|---|---|---|---|---|

|
#11
Reservoir Rd
Vernon Rockville, CT 06066
|
1,288 sq. feet
|
2 baths 3 beds |
$379,900
|
show details |

|
#12
Cooper Hill St # 150
Manchester, CT 06040
|
760 sq. feet
|
1 baths 2 beds |
$119,600
|
show details |

|
#13
Roosevelt St
New Britain, CT 06051
|
1,536 sq. feet
|
2 baths 3 beds |
$299,900
|
show details |

|
#14
Peck St
Berlin, CT 06037
|
608 sq. feet
|
1 baths 1 beds |
$144,900
|
show details |

|
#15
Railroad Ave
Chester, CT 06412
|
2,092 sq. feet
|
2 baths 4 beds |
$476,500
|
show details |

|
#16
Newberry Rd
South Windsor, CT 06074
|
3,386 sq. feet
|
2 baths 4 beds |
$644,900
|
show details |

|
#17
Pleasant St
Willimantic, CT 06226
|
2,836 sq. feet
|
3 baths 6 beds |
show details | |

|
#18
Commonwealth Ave
New Britain, CT 06053
|
1,406 sq. feet
|
2 baths 3 beds |
show details | |

|
#19
Harvard St
Hartford, CT 06106
|
1,411 sq. feet
|
2 baths 3 beds |
show details | |

|
#20
Arnold St
Hartford, CT 06106
|
3,299 sq. feet
|
3 baths 6 beds |
show details |
| Photo | Address | Area | Beds / Baths | Price | Details |
|---|---|---|---|---|---|

|
#21
Adrian Ave
Newington, CT 06111
|
1,490 sq. feet
|
1 baths 3 beds |
show details | |

|
#22
Palmer Dr
South Windsor, CT 06074
|
1,442 sq. feet
|
3 baths 3 beds |
show details | |

|
#23
Adrian Ave
Newington, CT 06111
|
1,196 sq. feet
|
1 baths 3 beds |
show details | |

|
#24
Broadview Ter
Hartford, CT 06106
|
1,821 sq. feet
|
2 baths 7 beds |
show details | |

|
#25
Norton Ln
South Windsor, CT 06074
|
2,028 sq. feet
|
2 baths 3 beds |
show details | |

|
#26
Prospect St
Willimantic, CT 06226
|
1,837 sq. feet
|
3 baths 8 beds |
show details | |

|
#27
Chestnut St
Willimantic, CT 06226
|
1,844 sq. feet
|
2 baths 4 beds |
show details | |

|
#28
Center Ct
Newington, CT 06111
|
1,201 sq. feet
|
1 baths 3 beds |
show details | |

|
#29
Witter Rd
Salem, CT 06420
|
1,952 sq. feet
|
2 baths 3 beds |
show details | |

|
#30
Main St
Newington, CT 06111
|
1,880 sq. feet
|
1 baths 3 beds |
show details |
| Photo | Address | Area | Beds / Baths | Price | Details |
|---|---|---|---|---|---|

|
#31
Partridge Dr
Newington, CT 06111
|
1,270 sq. feet
|
3 baths 3 beds |
show details | |

|
#32
Buckingham St Bsmt A
Hartford, CT 06106
|
1,105 sq. feet
|
3 baths 2 beds |
show details | |

|
#33
Main St
East Hartford, CT 06108
|
1,411 sq. feet
|
2 baths 4 beds |
show details | |

|
#34
Joshua Ln
Coventry, CT 06238
|
2,862 sq. feet
|
3 baths 4 beds |
show details | |

|
#35
Yale St
Hartford, CT 06106
|
1,204 sq. feet
|
1 baths 3 beds |
show details | |

|
#36
Cheshire St
Hartford, CT 06114
|
3,279 sq. feet
|
2 baths 4 beds |
show details | |

|
#37
Mansfield Ave
Willimantic, CT 06226
|
920 sq. feet
|
1 baths 3 beds |
show details | |

|
#38
Ellington Rd
East Hartford, CT 06108
|
1,721 sq. feet
|
2 baths 2 beds |
show details | |

|
#39
Exeter St
Hartford, CT 06106
|
1,124 sq. feet
|
2 baths 3 beds |
show details | |

|
#40
Popieluszko Ct
Hartford, CT 06106
|
1,668 sq. feet
|
3 baths 3 beds |
show details |
| Photo | Address | Area | Beds / Baths | Price | Details |
|---|---|---|---|---|---|

|
#41
Linnmoore St
Hartford, CT 06114
|
2,929 sq. feet
|
2 baths 4 beds |
show details | |

|
#42
Morris St Apt A
Hartford, CT 06114
|
1,328 sq. feet
|
2 baths 2 beds |
show details | |

|
#43
Hammond Ct
Colchester, CT 06415
|
1,152 sq. feet
|
1 baths 3 beds |
show details | |

|
#44
Hartt Ln
Newington, CT 06111
|
1,724 sq. feet
|
2 baths 3 beds |
show details | |

|
#45
Nepaug St
Hartford, CT 06106
|
1,703 sq. feet
|
2 baths 4 beds |
show details | |

|
#46
Granby St
Hartford, CT 06112
|
1,142 sq. feet
|
2 baths 2 beds |
show details | |

|
#47
Berkshire Dr
Newington, CT 06111
|
1,968 sq. feet
|
3 baths 3 beds |
show details | |

|
#48
Wooster St
Hartford, CT 06120
|
4,081 sq. feet
|
3 baths 6 beds |
show details | |

|
#49
Hickory Hill Ln
Newington, CT 06111
|
1,790 sq. feet
|
4 baths 3 beds |
show details | |

|
Check over 1 million property listings on Foreclosure.com!
|
browse all offers | |||
Latest news about housing in Marlborough, CT collected exclusively by city-data.com from local newspapers, TV, and radio stations


Household type by relationship:
Households: 865,787- In family households: 715,089 (143,179 male householders, 84,652 female householders)
161,327 spouses, 258,438 children (243,975 natural, 5,783 adopted, 8,680 stepchildren), 15,602 grandchildren, 8,779 brothers or sisters, 9,385 parents, foster children, 10,085 other relatives, 18,701 non-relatives
- In nonfamily households: 150,698 (54,155 male householders (41,831 living alone)), 68,868 female householders (58,693 living alone)), 27,675 nonrelatives
- In group quarters: 28,227 (15,383 institutionalized population)
135,700 married couples with children.
56,984 single-parent households (8,611 men, 48,373 women).
93.2% of residents of Marlborough speak English at home.
1.2% of residents speak Spanish at home (56% speak English very well, 44% speak English well).
5.5% of residents speak other Indo-European language at home (79% speak English very well, 16% speak English well, 2% speak English not well, 3% don't speak English at all).
0.1% of residents speak Asian or Pacific Island language at home (100% speak English very well).
Foreign born population: 497 (7.8%)
(85.3% of them are naturalized citizens)
| Here: | 7.9 |
| State: | 6.5 |
| Here: | 4.3 |
| State: | 4.0 |

- Bedrooms in owner-occupied houses and condos in Marlborough, Connecticut
- 0no bedroom
- 251 bedroom
- 1872 bedrooms
- 1,0813 bedrooms
- 4794 bedrooms
- 395+ bedrooms

- Bedrooms in renter-occupied apartments in Marlborough, Connecticut
- 0no bedroom
- 641 bedroom
- 482 bedrooms
- 633 bedrooms
- 194 bedrooms
- 05+ bedrooms

- Cars and other vehicles available in Marlborough in owner-occupied houses/condos
- 40no vehicle
- 2221 vehicle
- 1,0332 vehicles
- 4073 vehicles
- 784 vehicles
- 315+ vehicles

- Cars and other vehicles available in Marlborough in renter-occupied apartments
- 18no vehicle
- 1141 vehicle
- 452 vehicles
- 03 vehicles
- 04 vehicles
- 175+ vehicles

- Rooms in owner-occupied houses in Marlborough, Connecticut
- 01 room
- 02 rooms
- 93 rooms
- 844 rooms
- 1845 rooms
- 3306 rooms
- 5577 rooms
- 4318 rooms
- 2169+ rooms

- Rooms in renter-occupied apartments in Marlborough, Connecticut
- 01 room
- 272 rooms
- 373 rooms
- 484 rooms
- 05 rooms
- 286 rooms
- 287 rooms
- 178 rooms
- 99+ rooms


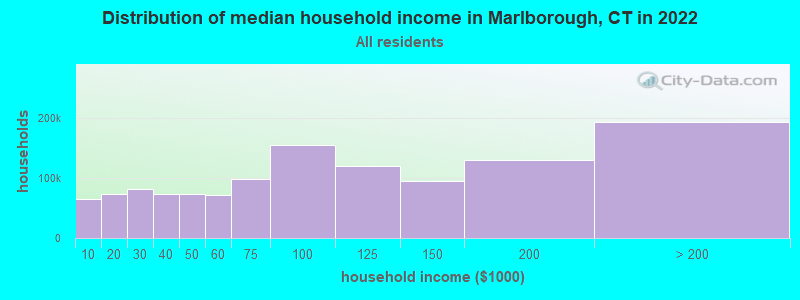
Marlborough, CT household income distribution

- 59,560Less than $10,000
- 67,327$10,000 to $19,999
- 76,026$20,000 to $29,999
- 67,967$30,000 to $39,999
- 67,689$40,000 to $49,999
- 66,213$50,000 to $59,999
- 92,325$60,000 to $74,999
- 144,381$75,000 to $99,999
- 111,988$100,000 to $124,999
- 89,417$125,000 to $149,999
- 122,186$150,000 to $199,999
- 181,643$200,000 or more
Percentage of workers working in this county: 77.0%
Number of people working at home: 581 (17.0% of all workers)
Travel time to work (commute)
- Less than 5 minutes: 61
- 5 to 9 minutes: 234
- 10 to 14 minutes: 160
- 15 to 19 minutes: 245
- 20 to 24 minutes: 556
- 25 to 29 minutes: 314
- 30 to 34 minutes: 615
- 35 to 39 minutes: 162
- 40 to 44 minutes: 178
- 45 to 59 minutes: 229
- 60 to 89 minutes: 114
- 90 or more minutes: 66
Means of transportation to work:
- Drove a car alone: 2,693 (89.4%)
- Carpooled: 166 (5.5%)
- Bus or trolley bus: 39 (1.3%)
- Walked: 15 (0.5%)
- Other means: 21 (0.7%)
- Worked at home: 78 (2.6%)


- Year of entry for the foreign-born population in Marlborough, Connecticut
- 51995 to March 2000
- 581990 to 1994
- 471985 to 1989
- 171980 to 1984
- 231975 to 1979
- 191970 to 1974
- 791965 to 1969
- 65Before 1965

First ancestries reported:
- Italian: 1,213 (16.6%)
- Irish: 1,104 (15.1%)
- English: 1,023 (14.0%)
- German: 650 (8.9%)
- Polish: 606 (8.3%)
- Other: 457 (6.2%)
- French: 448 (6.1%)
- United States: 370 (5.1%)
- French Canadian: 242 (3.3%)
- Scottish: 227 (3.1%)
- Swedish: 200 (2.7%)
- Russian: 128 (1.8%)
- Lithuanian: 106 (1.4%)
- Scotch-Irish: 96 (1.3%)
- Ukrainian: 87 (1.2%)
- Norwegian: 67 (0.9%)
- Greek: 54 (0.7%)
- Dutch: 43 (0.6%)
- Hungarian: 43 (0.6%)
- Portuguese: 39 (0.5%)
- Czech: 37 (0.5%)
- Danish: 34 (0.5%)
- Welsh: 25 (0.3%)
- Arab: 14 (0.2%)
Most common places of birth for foreign-born residents (%):
| Marlborough: | 14.1% (44) |
| Connecticut: | 7.0% (26,023) |
| Marlborough: | 11.2% (35) |
| Connecticut: | 1.0% (3,822) |
| Marlborough: | 10.5% (33) |
| Connecticut: | 4.4% (16,395) |
| Marlborough: | 9.6% (30) |
| Connecticut: | 5.2% (19,083) |
| Marlborough: | 7.7% (24) |
| Connecticut: | 3.6% (13,234) |
| Marlborough: | 7.0% (22) |
| Connecticut: | 0.4% (1,513) |
| Marlborough: | 5.4% (17) |
| Connecticut: | 6.9% (25,507) |
| Marlborough: | 4.8% (15) |
| Connecticut: | 1.2% (4,622) |
| Marlborough: | 4.5% (14) |
| Connecticut: | 0.3% (1,213) |
| Marlborough: | 4.2% (13) |
| Connecticut: | 3.1% (11,432) |
| Marlborough: | 3.8% (12) |
| Connecticut: | 4.1% (15,108) |
| Marlborough: | 3.5% (11) |
| Connecticut: | 2.1% (7,612) |
| Marlborough: | 3.2% (10) |
| Connecticut: | 2.5% (9,358) |
| Marlborough: | 2.6% (8) |
| Connecticut: | 0.4% (1,303) |
| Marlborough: | 2.6% (8) |
| Connecticut: | 0.5% (1,832) |
| Marlborough: | 2.2% (7) |
| Connecticut: | 0.9% (3,317) |
| Marlborough: | 2.2% (7) |
| Connecticut: | 0.1% (291) |
Place of birth for U.S.-born residents:
- This state: 3,684
- Other state: 1,658
- Northeast: 1,150
- Midwest: 179
- South: 206
- West: 123
66% of Marlborough residents lived in the same house 5 years ago.
Out of people who lived in different houses, 64% lived in this county.
Out of people who lived in different counties, 51% lived in Connecticut.
Education attainment for males 25 years and older:
- No schooling: 26
- Nursery to 4th grade: 0
- 5th and 6th grade: 10
- 7th and 8th grade: 35
- 9th grade: 19
- 10th grade: 18
- 11th grade: 28
- 12th grade, no diploma: 34
- High school graduate (or equivalency): 395
- Less than 1 year of college: 127
- Some college more than 1 year, no degree: 180
- Associate degree: 139
- Bachelor's degree: 550
- Master's degree: 229
- Professional school degree: 55
- Doctorate degree: 43

Education attainment for females 25 years and older:
- No schooling: 8
- Nursery to 4th grade: 0
- 5th and 6th grade: 0
- 7th and 8th grade: 66
- 9th grade: 8
- 10th grade: 32
- 11th grade: 32
- 12th grade, no diploma: 0
- High school graduate (or equivalency): 432
- Less than 1 year of college: 107
- Some college more than 1 year, no degree: 278
- Associate degree: 196
- Bachelor's degree: 519
- Master's degree: 258
- Professional school degree: 60
- Doctorate degree: 13


Housing units in structures:
- One, detached: 1,853
- One, attached: 60
- Two: 32
- 3 or 4: 36
- 5 to 9: 24
- 20 to 49: 28
- Mobile homes: 24
Median worth of mobile homes: $52,228
Housing units lacking complete kitchen facilities: 0.3%

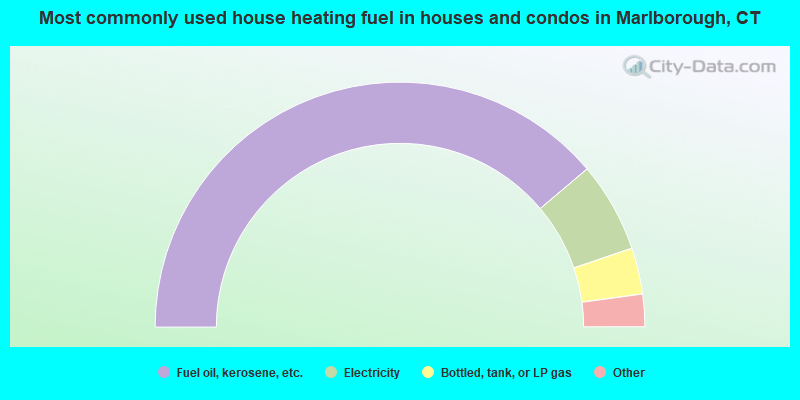
- 77.7%Fuel oil, kerosene, etc.
- 11.9%Electricity
- 6.1%Bottled, tank, or LP gas
- 3.0%Wood
- 0.9%Utility gas
- 0.3%Coal or coke
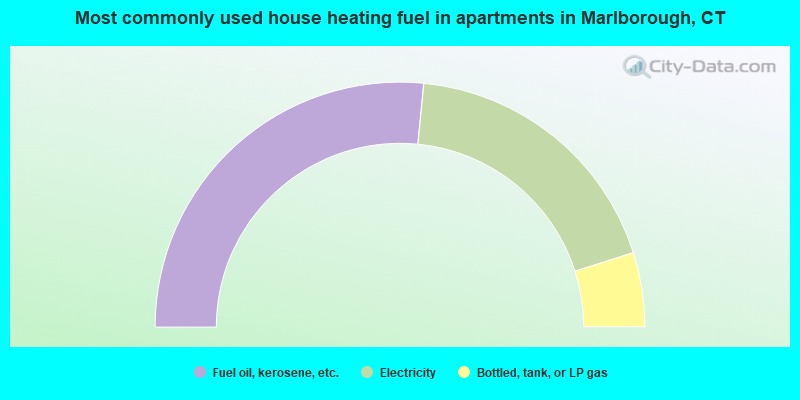
- 53.1%Fuel oil, kerosene, etc.
- 37.1%Electricity
- 9.8%Bottled, tank, or LP gas
Private vs. public school enrollment:
| Here: | 6.2% |
| Connecticut: | 9.9% |
| Here: | 10.7% |
| Connecticut: | 11.0% |
| Here: | 19.9% |
| Connecticut: | 33.4% |


