Maplewood, NJ (New Jersey) Houses and Residents
| Maplewood: | $571,992 |
| New Jersey: | $428,900 |
Total population: 23,170 (All urban)
Houses: 8,615 (8,452 occupied: 6,601 owner occupied, 1,851 renter occupied)
| % of renters here: | 22% |
| State: | 35% |
Housing density: 2,240 houses/condos per square mile
Median price asked for vacant for-sale houses and condos in 2022 in this county: $231,294.
Median contract rent in 2022: $1,683 (lower quartile is $1,284, upper quartile is over $2,000)
Median rent asked for vacant for-rent units in 2022: $1,830
Median gross rent in Maplewood, NJ in 2022: $1,936
Housing units in Maplewood with a mortgage: 4,308 (433 second mortgage, 668 home equity loan, 15 both second mortgage and home equity loan)
Houses without a mortgage: 1,233
Compare current foreclosures in Maplewood, NJ:
| Photo | Address | Area | Beds / Baths | Price | Details |
|---|---|---|---|---|---|

|
#1
Menzel Ave
Maplewood, NJ 07040
|
1,462 sq. feet
|
- baths - beds |
show details | |

|
#2
Van Ness Ter
Maplewood, NJ 07040
|
1,799 sq. feet
|
- baths - beds |
show details | |

|
#3
Troy Ct
Maplewood, NJ 07040
|
2,444 sq. feet
|
- baths - beds |
show details | |

|
#4
Tiffany Pl
Maplewood, NJ 07040
|
2,553 sq. feet
|
- baths - beds |
show details | |

|
#5
Meadowbrook Pl
Maplewood, NJ 07040
|
944 sq. feet
|
- baths - beds |
show details | |

|
#6
Brown St
Maplewood, NJ 07040
|
- sq. feet
|
- baths - beds |
show details | |

|
#7
Hughes St
Maplewood, NJ 07040
|
1,132 sq. feet
|
- baths - beds |
show details | |

|
#8
Yale St
Maplewood, NJ 07040
|
1,509 sq. feet
|
- baths - beds |
show details | |

|
#9
Tichenor Pl
Maplewood, NJ 07040
|
2,244 sq. feet
|
- baths - beds |
show details | |

|
#10
Union Ave
Maplewood, NJ 07040
|
- sq. feet
|
- baths - beds |
show details |
| Photo | Address | Area | Beds / Baths | Price | Details |
|---|---|---|---|---|---|

|
#11
Burr Rd
Maplewood, NJ 07040
|
1,669 sq. feet
|
- baths - beds |
show details | |

|
#12
Meadowbrook P A
Maplewood, NJ 07040
|
- sq. feet
|
- baths - beds |
show details | |

|
#13
Essex Ave
Maplewood, NJ 07040
|
1,199 sq. feet
|
- baths - beds |
show details | |

|
#14
Overlook Ter
Maplewood, NJ 07040
|
1,687 sq. feet
|
- baths - beds |
show details | |

|
#15
Irvington Ave
Maplewood, NJ 07040
|
1,232 sq. feet
|
- baths - beds |
show details | |

|
#16
Oakland Rd
Maplewood, NJ 07040
|
2,036 sq. feet
|
- baths - beds |
show details | |

|
#17
Burr Rd
Maplewood, NJ 07040
|
1,840 sq. feet
|
- baths - beds |
show details | |

|
#18
Boyden Pkwy
Maplewood, NJ 07040
|
2,970 sq. feet
|
- baths - beds |
show details | |

|
#19
Essex Rd
Maplewood, NJ 07040
|
2,668 sq. feet
|
- baths - beds |
show details | |

|
#20
Rutgers St
Maplewood, NJ 07040
|
1,813 sq. feet
|
- baths - beds |
show details |
| Photo | Address | Area | Beds / Baths | Price | Details |
|---|---|---|---|---|---|

|
#21
Tiffany Pl
Maplewood, NJ 07040
|
1,712 sq. feet
|
- baths - beds |
show details | |

|
#22
Van Ness Ct
Maplewood, NJ 07040
|
- sq. feet
|
- baths - beds |
show details | |

|
#23
Franklin Ave
Maplewood, NJ 07040
|
1,348 sq. feet
|
- baths - beds |
show details | |

|
#24
Colgate Rd
Maplewood, NJ 07040
|
2,089 sq. feet
|
- baths - beds |
show details | |

|
#25
Fernwood Rd # 2
Maplewood, NJ 07040
|
2,128 sq. feet
|
- baths - beds |
show details | |

|
#26
Summit Ave
Maplewood, NJ 07040
|
1,910 sq. feet
|
- baths - beds |
show details | |

|
#27
Hilton Ave
Maplewood, NJ 07040
|
1,571 sq. feet
|
- baths - beds |
show details | |

|
#28
Brown St
Maplewood, NJ 07040
|
1,604 sq. feet
|
- baths - beds |
show details | |

|
#29
Rynda Rd
Maplewood, NJ 07040
|
1,812 sq. feet
|
- baths - beds |
show details | |

|
#30
Broadview Ave
Maplewood, NJ 07040
|
1,344 sq. feet
|
- baths - beds |
show details |
| Photo | Address | Area | Beds / Baths | Price | Details |
|---|---|---|---|---|---|

|
#31
Irvington Ave Apt 12
Maplewood, NJ 07040
|
- sq. feet
|
- baths - beds |
show details | |

|
#32
Evelyn Ct
Maplewood, NJ 07040
|
2,080 sq. feet
|
- baths - beds |
show details | |

|
#33
Springfield Ave Unit 15
Maplewood, NJ 07040
|
- sq. feet
|
- baths - beds |
show details | |

|
#34
Springfield Ave
Maplewood, NJ 07040
|
1,110 sq. feet
|
- baths - beds |
show details | |

|
#35
Franklin Ave
Maplewood, NJ 07040
|
- sq. feet
|
- baths - beds |
show details | |

|
#36
Garfield Pl
Maplewood, NJ 07040
|
1,645 sq. feet
|
- baths - beds |
show details | |

|
#37
Peachtree Rd
Maplewood, NJ 07040
|
976 sq. feet
|
- baths - beds |
show details | |

|
#38
Boyden Pkwy
Maplewood, NJ 07040
|
- sq. feet
|
- baths - beds |
show details | |

|
#39
Boyden Pkwy
Maplewood, NJ 07040
|
2,346 sq. feet
|
- baths - beds |
show details | |

|
#40
Boyden Pkwy S
Maplewood, NJ 07040
|
2,525 sq. feet
|
- baths - beds |
show details |
| Photo | Address | Area | Beds / Baths | Price | Details |
|---|---|---|---|---|---|

|
#41
Shepard Ave
Maplewood, NJ 07040
|
- sq. feet
|
- baths - beds |
show details | |

|
#42
Irvington Ave # 5
Maplewood, NJ 07040
|
- sq. feet
|
- baths - beds |
show details | |

|
Check over 1 million property listings on Foreclosure.com!
|
browse all offers | |||
Latest news about housing in Maplewood, NJ collected exclusively by city-data.com from local newspapers, TV, and radio stations


Household type by relationship:
Households: 760,197- In family households: 645,040 (104,343 male householders, 84,996 female householders)
113,673 spouses, 245,726 children (232,723 natural, 5,793 adopted, 7,210 stepchildren), 20,627 grandchildren, 15,422 brothers or sisters, 11,923 parents, foster children, 19,910 other relatives, 22,762 non-relatives
- In nonfamily households: 115,157 (42,135 male householders (33,262 living alone)), 52,238 female householders (45,266 living alone)), 20,784 nonrelatives
- In group quarters: 23,772 (12,126 institutionalized population)
108,634 married couples with children.
65,899 single-parent households (10,059 men, 55,840 women).
81.2% of residents of Maplewood speak English at home.
4.6% of residents speak Spanish at home (65% speak English very well, 24% speak English well, 9% speak English not well, 2% don't speak English at all).
11.2% of residents speak other Indo-European language at home (62% speak English very well, 24% speak English well, 10% speak English not well, 4% don't speak English at all).
1.5% of residents speak Asian or Pacific Island language at home (88% speak English very well, 6% speak English well, 6% speak English not well).
1.5% of residents speak other language at home (82% speak English very well, 18% speak English well).
Foreign born population: 6,300 (24.7%)
(69.2% of them are naturalized citizens)
| Here: | 7.8 |
| State: | 6.8 |
| Here: | 5.5 |
| State: | 3.9 |

- Bedrooms in owner-occupied houses and condos in Maplewood, New Jersey
- 11no bedroom
- 2041 bedroom
- 7892 bedrooms
- 2,9893 bedrooms
- 1,6964 bedrooms
- 9125+ bedrooms

- Bedrooms in renter-occupied apartments in Maplewood, New Jersey
- 125no bedroom
- 5021 bedroom
- 7982 bedrooms
- 3493 bedrooms
- 364 bedrooms
- 415+ bedrooms

- Cars and other vehicles available in Maplewood in owner-occupied houses/condos
- 247no vehicle
- 2,1931 vehicle
- 3,2662 vehicles
- 6863 vehicles
- 1664 vehicles
- 435+ vehicles

- Cars and other vehicles available in Maplewood in renter-occupied apartments
- 368no vehicle
- 9881 vehicle
- 4032 vehicles
- 863 vehicles
- 64 vehicles
- 05+ vehicles

- Rooms in owner-occupied houses in Maplewood, New Jersey
- 111 room
- 02 rooms
- 2053 rooms
- 1724 rooms
- 5725 rooms
- 1,3956 rooms
- 1,3297 rooms
- 1,4068 rooms
- 1,5119+ rooms

- Rooms in renter-occupied apartments in Maplewood, New Jersey
- 1251 room
- 952 rooms
- 3223 rooms
- 3384 rooms
- 5995 rooms
- 1666 rooms
- 887 rooms
- 528 rooms
- 669+ rooms


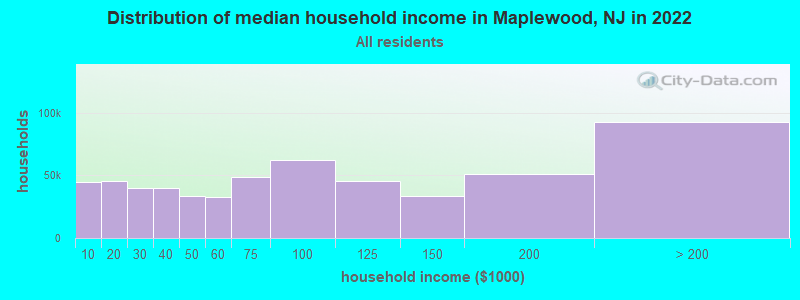
Maplewood, NJ household income distribution

- 44,858Less than $10,000
- 45,561$10,000 to $19,999
- 40,188$20,000 to $29,999
- 39,809$30,000 to $39,999
- 33,429$40,000 to $49,999
- 32,598$50,000 to $59,999
- 48,297$60,000 to $74,999
- 62,566$75,000 to $99,999
- 45,193$100,000 to $124,999
- 33,583$125,000 to $149,999
- 50,767$150,000 to $199,999
- 92,591$200,000 or more
Percentage of workers working in this county: 45.3%
Number of people working at home: 2,303 (15.4% of all workers)
Travel time to work (commute)
- Less than 5 minutes: 164
- 5 to 9 minutes: 788
- 10 to 14 minutes: 909
- 15 to 19 minutes: 1,231
- 20 to 24 minutes: 1,485
- 25 to 29 minutes: 723
- 30 to 34 minutes: 1,560
- 35 to 39 minutes: 347
- 40 to 44 minutes: 746
- 45 to 59 minutes: 1,184
- 60 to 89 minutes: 1,712
- 90 or more minutes: 560
Means of transportation to work:
- Drove a car alone: 7,714 (63.7%)
- Carpooled: 831 (6.9%)
- Bus or trolley bus: 530 (4.4%)
- Subway or elevated: 154 (1.3%)
- Railroad: 1,884 (15.6%)
- Ferryboat: 6 (0.0%)
- Taxi: 12 (0.1%)
- Motorcycle: 8 (0.1%)
- Bicycle: 11 (0.1%)
- Walked: 206 (1.7%)
- Other means: 53 (0.4%)
- Worked at home: 693 (5.7%)


- Year of entry for the foreign-born population in Maplewood, New Jersey
- 6891995 to March 2000
- 7761990 to 1994
- 6161985 to 1989
- 6711980 to 1984
- 4641975 to 1979
- 5191970 to 1974
- 1161965 to 1969
- 403Before 1965

First ancestries reported:
- Other: 8,527 (32.1%)
- Irish: 2,828 (10.7%)
- West Indian: 2,423 (9.1%)
- Italian: 2,392 (9.0%)
- German: 2,267 (8.5%)
- English: 1,434 (5.4%)
- Polish: 1,423 (5.4%)
- Russian: 1,194 (4.5%)
- United States: 712 (2.7%)
- Subsaharan African: 611 (2.3%)
- Scottish: 321 (1.2%)
- Ukrainian: 278 (1.0%)
- French: 266 (1.0%)
- Scotch-Irish: 229 (0.9%)
- Hungarian: 227 (0.9%)
- Norwegian: 217 (0.8%)
- Dutch: 214 (0.8%)
- Greek: 154 (0.6%)
- Lithuanian: 142 (0.5%)
- Welsh: 131 (0.5%)
- Czech: 128 (0.5%)
- French Canadian: 106 (0.4%)
- Slovak: 92 (0.3%)
- Swedish: 91 (0.3%)
- Portuguese: 52 (0.2%)
- Danish: 44 (0.2%)
- Swiss: 39 (0.1%)
- Arab: 5 (0.02%)
Most common places of birth for foreign-born residents (%):
| Maplewood: | 19.3% (820) |
| New Jersey: | 2.2% (31,963) |
| Maplewood: | 11.0% (470) |
| New Jersey: | 2.5% (36,443) |
| Maplewood: | 6.0% (257) |
| New Jersey: | 1.2% (17,746) |
| Maplewood: | 4.9% (210) |
| New Jersey: | 2.1% (30,355) |
| Maplewood: | 4.7% (202) |
| New Jersey: | 3.8% (55,466) |
| Maplewood: | 4.4% (189) |
| New Jersey: | 0.9% (13,289) |
| Maplewood: | 3.9% (166) |
| New Jersey: | 0.6% (8,389) |
| Maplewood: | 3.8% (160) |
| New Jersey: | 1.5% (22,097) |
| Maplewood: | 3.2% (138) |
| New Jersey: | 1.0% (14,768) |
| Maplewood: | 3.0% (129) |
| New Jersey: | 0.5% (7,928) |
| Maplewood: | 3.0% (129) |
| New Jersey: | 4.7% (69,773) |
| Maplewood: | 3.0% (126) |
| New Jersey: | 8.1% (119,497) |
| Maplewood: | 2.9% (122) |
| New Jersey: | 4.7% (69,754) |
| Maplewood: | 2.3% (98) |
| New Jersey: | 0.5% (7,079) |
| Maplewood: | 1.8% (78) |
| New Jersey: | 2.3% (33,531) |
Place of birth for U.S.-born residents:
- This state: 11,181
- Other state: 8,091
- Northeast: 5,083
- Midwest: 827
- South: 1,679
- West: 502
61% of Maplewood residents lived in the same house 5 years ago.
Out of people who lived in different houses, 47% lived in this county.
Out of people who lived in different counties, 43% lived in New Jersey.
Education attainment for males 25 years and older:
- No schooling: 13
- Nursery to 4th grade: 21
- 5th and 6th grade: 43
- 7th and 8th grade: 64
- 9th grade: 78
- 10th grade: 48
- 11th grade: 83
- 12th grade, no diploma: 151
- High school graduate (or equivalency): 1,129
- Less than 1 year of college: 370
- Some college more than 1 year, no degree: 1,065
- Associate degree: 260
- Bachelor's degree: 2,188
- Master's degree: 995
- Professional school degree: 675
- Doctorate degree: 194

Education attainment for females 25 years and older:
- No schooling: 39
- Nursery to 4th grade: 15
- 5th and 6th grade: 58
- 7th and 8th grade: 141
- 9th grade: 51
- 10th grade: 164
- 11th grade: 74
- 12th grade, no diploma: 258
- High school graduate (or equivalency): 1,828
- Less than 1 year of college: 359
- Some college more than 1 year, no degree: 1,035
- Associate degree: 523
- Bachelor's degree: 2,418
- Master's degree: 1,153
- Professional school degree: 445
- Doctorate degree: 49


Housing units in structures:
- One, detached: 5,908
- One, attached: 209
- Two: 1,109
- 3 or 4: 513
- 5 to 9: 123
- 10 to 19: 94
- 20 to 49: 100
- 50 or more: 559
Housing units lacking complete kitchen facilities: 0.9%

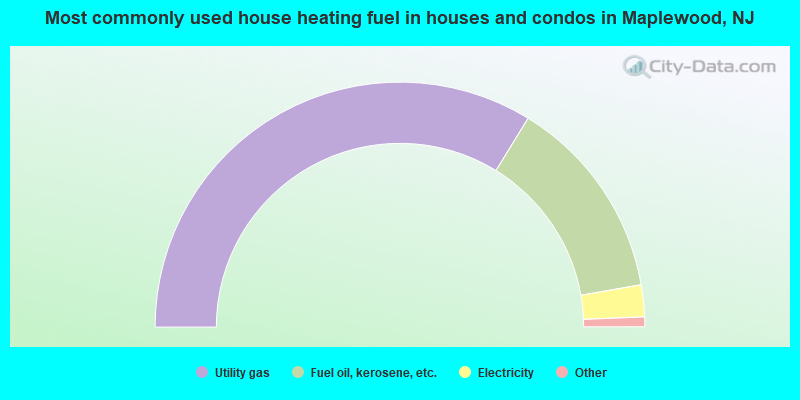
- 67.6%Utility gas
- 27.0%Fuel oil, kerosene, etc.
- 4.2%Electricity
- 1.0%Bottled, tank, or LP gas
- 0.1%Other fuel
- 0.1%Wood
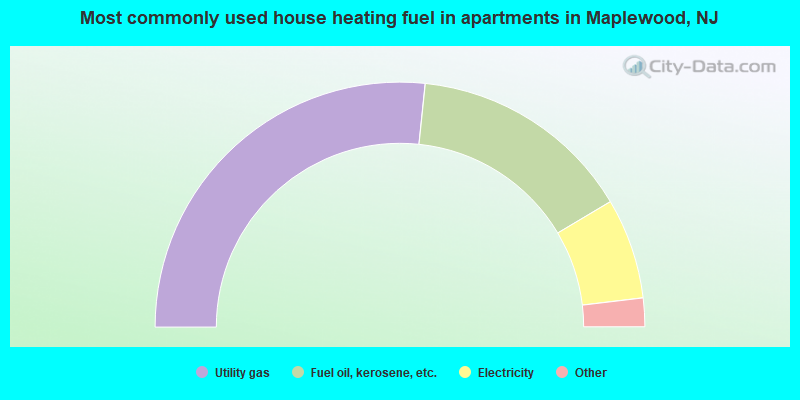
- 53.3%Utility gas
- 29.6%Fuel oil, kerosene, etc.
- 13.3%Electricity
- 3.3%Bottled, tank, or LP gas
- 0.5%Other fuel
Private vs. public school enrollment:
| Here: | 12.7% |
| New Jersey: | 13.2% |
| Here: | 11.2% |
| New Jersey: | 13.0% |
| Here: | 37.6% |
| New Jersey: | 30.1% |


