Lower Allen, PA (Pennsylvania) Houses and Residents
| Lower Allen: | $245,976 |
| Pennsylvania: | $245,500 |
Mean price in 2022:
Detached houses: $281,004
Here: $281,004 State: $317,202 Townhouses or other attached units: $246,675
Here: $246,675 State: $254,369
Total population: 6,694 (All urban)
Houses: 3,380 (3,292 occupied: 2,245 owner occupied, 1,072 renter occupied)
| % of renters here: | 32% |
| State: | 31% |
Housing density: 1,444 houses/condos per square mile
Median price asked for vacant for-sale houses and condos in 2022 in this county: $181,892.
Median contract rent in 2022: $881 (lower quartile is $703, upper quartile is $1,334)
Median rent asked for vacant for-rent units in 2022: $852
Median gross rent in Lower Allen, PA in 2022: $1,036
Housing units in Lower Allen with a mortgage: 1,684 (329 second mortgage, 0 home equity loan, 299 both second mortgage and home equity loan)
Houses without a mortgage: 32
Median household income for houses/condos with a mortgage: $109,496
Median household income for apartments without a mortgage: $84,129
Median monthly housing costs: $1,209
Compare current foreclosures near Lower Allen, PA:
| Photo | Address | Area | Beds / Baths | Price | Details |
|---|---|---|---|---|---|

|
#1
Furman Rd
Dillsburg, PA 17019
|
1,344 sq. feet
|
1 baths 3 beds |
show details | |

|
#2
Eddington Ave
Harrisburg, PA 17111
|
1,784 sq. feet
|
2 baths 4 beds |
show details | |

|
#3
Mulberry St
Harrisburg, PA 17104
|
1,683 sq. feet
|
1 baths 4 beds |
show details | |

|
#4
Vista Dr
New Cumberland, PA 17070
|
1,543 sq. feet
|
3 baths 3 beds |
show details | |

|
#5
Hunters Ridge Dr
Harrisburg, PA 17110
|
1,364 sq. feet
|
2 baths 3 beds |
show details | |

|
#6
Canyon Rd
Harrisburg, PA 17111
|
1,602 sq. feet
|
2 baths 4 beds |
show details | |

|
#7
E Green St
Camp Hill, PA 17011
|
1,540 sq. feet
|
2 baths 3 beds |
show details | |

|
#8
Maple St
Manchester, PA 17345
|
1,784 sq. feet
|
1 baths 3 beds |
show details | |

|
#9
Park St
Dover, PA 17315
|
1,280 sq. feet
|
1 baths 3 beds |
show details | |

|
#10
Green St
Harrisburg, PA 17102
|
2,412 sq. feet
|
1 baths 5 beds |
show details |
| Photo | Address | Area | Beds / Baths | Price | Details |
|---|---|---|---|---|---|

|
#11
Bunker Hill Rd
New Cumberland, PA 17070
|
1,852 sq. feet
|
2 baths 4 beds |
show details | |

|
#12
Butler St
Harrisburg, PA 17103
|
1,244 sq. feet
|
1 baths 3 beds |
show details | |

|
#13
Keystone Ave
Middletown, PA 17057
|
1,298 sq. feet
|
1 baths 3 beds |
show details | |

|
#14
2nd Street Aka 493 Second Street
Highspire, PA 17034
|
1,864 sq. feet
|
1 baths 3 beds |
show details | |

|
#15
Old Hershey Rd
Elizabethtown, PA 17022
|
1,200 sq. feet
|
1 baths 3 beds |
show details | |

|
#16
Tulane Rd
Hummelstown, PA 17036
|
698 sq. feet
|
1 baths 3 beds |
show details | |

|
#17
Church Rd
Hummelstown, PA 17036
|
1,520 sq. feet
|
3 baths 4 beds |
show details | |

|
#18
N Market St
Elizabethtown, PA 17022
|
1,656 sq. feet
|
1 baths 3 beds |
show details | |

|
#19
Harvest Dr
Harrisburg, PA 17111
|
2,642 sq. feet
|
2 baths 4 beds |
show details | |

|
#20
2nd St
Highspire, PA 17034
|
1,587 sq. feet
|
1 baths 3 beds |
show details |
| Photo | Address | Area | Beds / Baths | Price | Details |
|---|---|---|---|---|---|

|
#21
Parklea Dr
Hummelstown, PA 17036
|
984 sq. feet
|
1 baths 3 beds |
show details | |

|
#22
N West St
Carlisle, PA 17013
|
1,584 sq. feet
|
2 baths 3 beds |
show details | |

|
#23
W Vine St
Camp Hill, PA 17011
|
1,360 sq. feet
|
3 baths 3 beds |
show details | |

|
#24
S 24th St
Harrisburg, PA 17103
|
1,797 sq. feet
|
1 baths 5 beds |
show details | |

|
#25
Leonard Ln
Harrisburg, PA 17111
|
1,248 sq. feet
|
2 baths 2 beds |
show details | |

|
#26
Fishing Creek Valley Rd
Harrisburg, PA 17112
|
1,344 sq. feet
|
1 baths 3 beds |
show details | |

|
#27
Market St
Highspire, PA 17034
|
2,148 sq. feet
|
2 baths 3 beds |
show details | |

|
#28
N York Rd
Dillsburg, PA 17019
|
- sq. feet
|
2 baths 3 beds |
show details | |

|
#29
Chestnut St
Harrisburg, PA 17104
|
1,890 sq. feet
|
1 baths 5 beds |
show details | |

|
#30
N West St
Carlisle, PA 17013
|
1,440 sq. feet
|
1 baths 3 beds |
show details |
| Photo | Address | Area | Beds / Baths | Price | Details |
|---|---|---|---|---|---|

|
#31
Prosperous Dr
Harrisburg, PA 17112
|
3,734 sq. feet
|
3 baths 4 beds |
show details | |

|
#32
2nd St
Lemoyne, PA 17043
|
1,120 sq. feet
|
1 baths 2 beds |
show details | |

|
#33
S Front St
Harrisburg, PA 17104
|
1,265 sq. feet
|
1 baths 3 beds |
show details | |

|
#34
Baltimore Rd
Dillsburg, PA 17019
|
2,352 sq. feet
|
2 baths 3 beds |
show details | |

|
#35
N 16th St
Harrisburg, PA 17103
|
3,162 sq. feet
|
4 baths 5 beds |
show details | |

|
#36
Ridgeview Dr
Dillsburg, PA 17019
|
1,773 sq. feet
|
2 baths 3 beds |
show details | |

|
#37
Crossing Way
Manchester, PA 17345
|
1,094 sq. feet
|
1 baths 3 beds |
show details | |

|
#38
Front St
Enola, PA 17025
|
2,092 sq. feet
|
3 baths 4 beds |
show details | |

|
#39
Spring Rd
Carlisle, PA 17013
|
1,496 sq. feet
|
1 baths 3 beds |
show details | |

|
#40
2nd St
Enola, PA 17025
|
1,488 sq. feet
|
2 baths 3 beds |
show details |
| Photo | Address | Area | Beds / Baths | Price | Details |
|---|---|---|---|---|---|

|
#41
Liverpool Turnpike
Emigsville, PA 17318
|
1,776 sq. feet
|
2 baths 3 beds |
show details | |

|
#42
Nixon Dr
Mechanicsburg, PA 17055
|
2,020 sq. feet
|
1 baths 3 beds |
show details | |

|
#43
Main St
Harrisburg, PA 17113
|
1,205 sq. feet
|
1 baths 4 beds |
show details | |

|
#44
Conewago Ave
Manchester, PA 17345
|
768 sq. feet
|
1 baths 2 beds |
show details | |

|
#45
S 29th St
Harrisburg, PA 17103
|
1,334 sq. feet
|
1 baths 4 beds |
show details | |

|
#46
E High St
Elizabethtown, PA 17022
|
1,270 sq. feet
|
1 baths 3 beds |
show details | |

|
#47
Reservoir Dr
Dover, PA 17315
|
2,064 sq. feet
|
3 baths 3 beds |
show details | |

|
#48
Rosemont Ave
New Cumberland, PA 17070
|
1,410 sq. feet
|
2 baths 3 beds |
show details | |

|
#49
Prince St
Harrisburg, PA 17109
|
1,040 sq. feet
|
1 baths 2 beds |
show details | |

|
Check over 1 million property listings on Foreclosure.com!
|
browse all offers | |||


 | moving to Harrisburg pa (65 replies) |
| Job transfer to Harrisburg... camp hill/mechanicsburg? (4 replies) |
| New Urbanism comes to Central PA (0 replies) |
| Can you recommend areas to check out around Harrisburg? (11 replies) |
| Where to live in the Harrisburg area and surroundings? (12 replies) |
| from Brooklyn, NY to Harrisburg PA (8 replies) |

Median year apartment built: 1980
Household type by relationship:
Households: 7,555- Male householders: 1,662 (447 living alone), Female householders: 1,669 (747 living alone)
1,521 spouses (1,445 opposite-sex spouses), 243 unmarried partners, (219 opposite-sex unmarried partners), 2,163 children (2,074 natural, 72 adopted, 16 stepchildren), 52 grandchildren, 80 brothers or sisters, 31 parents, 0 foster children, 6 other relatives, 119 non-relatives
- In group quarters: 5
Size of family households: 945 2-persons, 447 3-persons, 266 4-persons, 180 5-persons, 67 6-persons.
Size of nonfamily households: 1,143 1-person, 234 2-persons, 17 3-persons.
1,221 married couples with children.
353 single-parent households (7 men, 346 women).
91.3% of residents of Lower Allen speak English at home.
5.1% of residents speak Spanish at home (49% speak English very well, 22% speak English well, 29% speak English not well).
0.9% of residents speak other Indo-European language at home (65% speak English very well, 35% speak English well).
2.0% of residents speak Asian or Pacific Island language at home (64% speak English very well, 19% speak English well, 10% speak English not well, 6% don't speak English at all).
0.9% of residents speak other language at home (100% speak English well).
Foreign born population: 425 (5.6%)
(83.8% of them are naturalized citizens)
| Here: | 7.3 |
| State: | 6.8 |
| Here: | 3.9 |
| State: | 4.3 |

- Bedrooms in owner-occupied houses and condos in Lower Allen, Pennsylvania
- 11no bedroom
- 01 bedroom
- 3172 bedrooms
- 1,0323 bedrooms
- 7244 bedrooms
- 1615+ bedrooms

- Bedrooms in renter-occupied apartments in Lower Allen, Pennsylvania
- 12no bedroom
- 3581 bedroom
- 4572 bedrooms
- 2123 bedrooms
- 344 bedrooms
- 05+ bedrooms

- Cars and other vehicles available in Lower Allen in owner-occupied houses/condos
- 0no vehicle
- 6281 vehicle
- 1,1692 vehicles
- 3753 vehicles
- 244 vehicles
- 505+ vehicles

- Cars and other vehicles available in Lower Allen in renter-occupied apartments
- 369no vehicle
- 3101 vehicle
- 3772 vehicles
- 173 vehicles
- 04 vehicles
- 05+ vehicles

- Rooms in owner-occupied houses in Lower Allen, Pennsylvania
- 111 room
- 02 rooms
- 03 rooms
- 434 rooms
- 2605 rooms
- 4356 rooms
- 4697 rooms
- 4428 rooms
- 5859+ rooms

- Rooms in renter-occupied apartments in Lower Allen, Pennsylvania
- 121 room
- 02 rooms
- 4493 rooms
- 1804 rooms
- 2525 rooms
- 856 rooms
- 277 rooms
- 488 rooms
- 199+ rooms


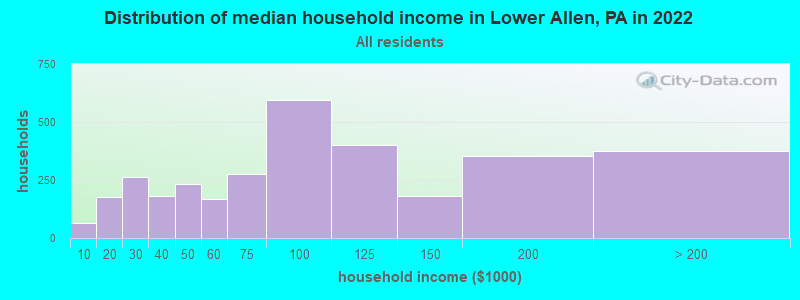
Lower Allen, PA household income distribution

- 66Less than $10,000
- 177$10,000 to $19,999
- 265$20,000 to $29,999
- 182$30,000 to $39,999
- 234$40,000 to $49,999
- 167$50,000 to $59,999
- 274$60,000 to $74,999
- 596$75,000 to $99,999
- 399$100,000 to $124,999
- 180$125,000 to $149,999
- 353$150,000 to $199,999
- 376$200,000 or more
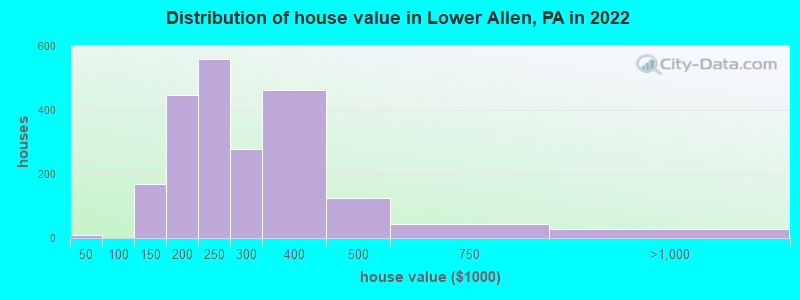
Home value of owner - occupied houses in 2022 in Lower Allen, PA
-
- 8$15,000 to $19,999
- 53$100,000 to $124,999
- 116$125,000 to $149,999
- 178$150,000 to $174,999
- 270$175,000 to $199,999
- 557$200,000 to $249,999
- 277$250,000 to $299,999
- 464$300,000 to $399,999
- 124$400,000 to $499,999
- 44$500,000 to $749,999
- 26$750,000 to $999,999
Rent paid by renters in 2022 in Lower Allen, PA
-
- 8$150 to $199
- 26$200 to $249
- 43$250 to $299
- 29$300 to $349
- 14$350 to $399
- 8$450 to $499
- 62$500 to $549
- 28$550 to $599
- 14$600 to $649
- 37$650 to $699
- 24$700 to $749
- 45$750 to $799
- 205$800 to $899
- 96$900 to $999
- 54$1,000 to $1,249
- 246$1,250 to $1,499
- 32$1,500 to $1,999
- 15$2,000 to $2,499
- 16$3,500 or more
- 63No cash rent


Percentage of workers working in this county: 51.7%
Number of people working at home: 454 (11.6% of all workers)
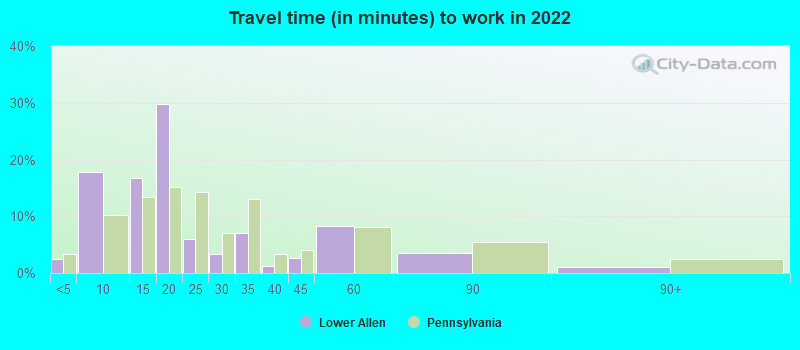
Travel time to work (commute)
- Less than 5 minutes: 49
- 5 to 9 minutes: 317
- 10 to 14 minutes: 750
- 15 to 19 minutes: 949
- 20 to 24 minutes: 459
- 25 to 29 minutes: 285
- 30 to 34 minutes: 348
- 35 to 39 minutes: 42
- 40 to 44 minutes: 47
- 45 to 59 minutes: 106
- 60 to 89 minutes: 0
- 90 or more minutes: 31
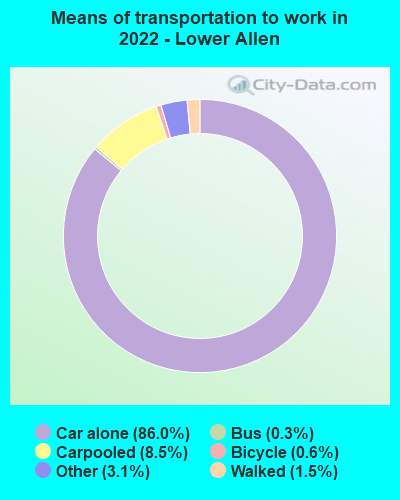
Means of transportation to work:
- Drove a car alone: 1,771 (70.3%)
- Carpooled: 168 (6.7%)
- Bus: 5 (0.2%)
- Taxi: 87 (3.5%)
- Bicycle: 16 (0.6%)
- Walked: 34 (1.3%)
- Worked at home: 454 (18.0%)

- Unemployment by race in 2022
- Unemployment rate for White non-Hispanic residents
- 3.3%Males
- 1.8%Females
- Unemployment rate for two or more race residents
- 7.2%Females

- Year of entry for the foreign-born population in Lower Allen, Pennsylvania
- 412010 or later
- 1872000 to 2009
- 921990 to 1999
- 471980 to 1989
- 621970 to 1979
- 100Before 1970

First ancestries reported:
- German: 796 (24.6%)
- American: 375 (11.6%)
- French: 246 (7.6%)
- Irish: 225 (7.0%)
- European: 223 (6.9%)
- Italian: 132 (4.1%)
- English: 106 (3.3%)
- Polish: 60 (1.9%)
- Eastern European: 45 (1.4%)
- Czech: 44 (1.4%)
- African: 39 (1.2%)
- Swiss: 35 (1.1%)
- Portuguese: 33 (1.0%)
- French Canadian: 29 (0.9%)
- Hungarian: 29 (0.9%)
- Pennsylvania German: 27 (0.8%)
- Romanian: 25 (0.8%)
- Sudanese: 25 (0.8%)
- Swedish: 25 (0.8%)
- Scottish: 16 (0.5%)
- Canadian: 15 (0.5%)
- Welsh: 15 (0.5%)
- Moroccan: 14 (0.4%)
- Norwegian: 6 (0.2%)
- British: 5 (0.2%)
Most common places of birth for foreign-born residents (%):
| Lower Allen: | 21.0% (82) |
| Pennsylvania: | 0.5% (4,424) |
| Lower Allen: | 14.8% (58) |
| Pennsylvania: | 0.5% (4,593) |
| Lower Allen: | 12.5% (49) |
| Pennsylvania: | 7.2% (67,704) |
| Lower Allen: | 8.2% (32) |
| Pennsylvania: | 0.2% (1,563) |
| Lower Allen: | 7.7% (30) |
| Pennsylvania: | 0.6% (5,598) |
| Lower Allen: | 5.6% (22) |
| Pennsylvania: | 0.7% (6,690) |
| Lower Allen: | 5.4% (21) |
| Pennsylvania: | 1.8% (17,032) |
| Lower Allen: | 5.1% (20) |
| Pennsylvania: | 0.3% (2,635) |
| Lower Allen: | 3.8% (15) |
| Pennsylvania: | 0.2% (1,557) |
| Lower Allen: | 3.6% (14) |
| Pennsylvania: | 0.4% (3,416) |
| Lower Allen: | 2.8% (11) |
| Pennsylvania: | 0.5% (4,483) |
| Lower Allen: | 2.0% (8) |
| Pennsylvania: | 1.0% (9,205) |
| Lower Allen: | 1.5% (6) |
| Pennsylvania: | 1.9% (18,065) |
Place of birth for U.S.-born residents:
- This state: 5,128
- Other state: 1,891
- Northeast: 888
- Midwest: 292
- South: 598
- West: 103
93.6% of Lower Allen residents lived in the same house 1 years ago.
Out of people who lived in different houses, 24.6% lived in this county.
Out of people who lived in different counties, 83.5% lived in Pennsylvania.
| Lower Allen: | 93.6% |
| State average: | 89.3% |
Education attainment for males 25 years and older:
- No schooling: 21
- Nursery to 4th grade: 0
- 5th and 6th grade: 15
- 7th and 8th grade: 28
- 9th grade: 7
- 10th grade: 0
- 11th grade: 0
- 12th grade, no diploma: 0
- High school graduate (or equivalency): 487
- Less than 1 year of college: 80
- Some college more than 1 year, no degree: 391
- Associate degree: 344
- Bachelor's degree: 741
- Master's degree: 357
- Professional school degree: 48
- Doctorate degree: 64

Education attainment for females 25 years and older:
- No schooling: 25
- Nursery to 4th grade: 0
- 5th and 6th grade: 8
- 7th and 8th grade: 17
- 9th grade: 0
- 10th grade: 37
- 11th grade: 8
- 12th grade, no diploma: 1
- High school graduate (or equivalency): 529
- Less than 1 year of college: 129
- Some college more than 1 year, no degree: 288
- Associate degree: 277
- Bachelor's degree: 834
- Master's degree: 548
- Professional school degree: 55
- Doctorate degree: 42


Housing units in structures:
- One, detached: 2,020
- One, attached: 457
- Two: 38
- 3 or 4: 24
- 5 to 9: 120
- 10 to 19: 265
- 20 to 49: 150
- 50 or more: 303
House/condo owner moved in on average 14 years ago
Renter moved in on average 6 years ago

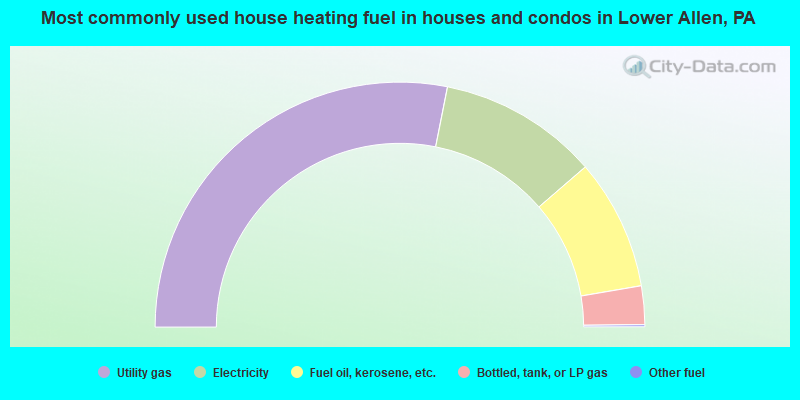
- 56.3%Utility gas
- 21.1%Electricity
- 17.3%Fuel oil, kerosene, etc.
- 5.1%Bottled, tank, or LP gas
- 0.3%Other fuel
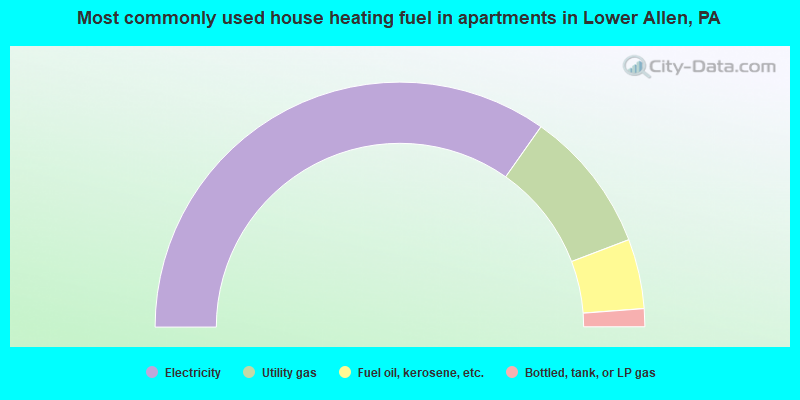
- 69.6%Electricity
- 18.9%Utility gas
- 9.2%Fuel oil, kerosene, etc.
- 2.4%Bottled, tank, or LP gas
Private vs. public school enrollment:
| Here: | 6.1% |
| Pennsylvania: | 15.7% |
| Here: | 16.4% |
| Pennsylvania: | 13.4% |
| Here: | 46.0% |
| Pennsylvania: | 39.8% |


