Housing density: 2,037 houses/condos per square mile
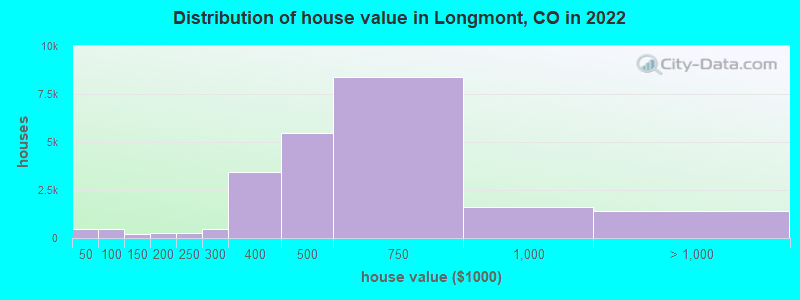
Median price asked for vacant for-sale houses and condos in 2022: $472,490.
Median contract rent in 2022: $1,631 (lower quartile is $1,329, upper quartile is $1,914)
Median rent asked for vacant for-rent units in 2022: $1,430
Median gross rent in Longmont, CO in 2022: $1,753
Housing units in Longmont with a mortgage: 18,850 (1,990 second mortgage, 128 home equity loan, 1,780 both second mortgage and home equity loan) Houses without a mortgage: 313
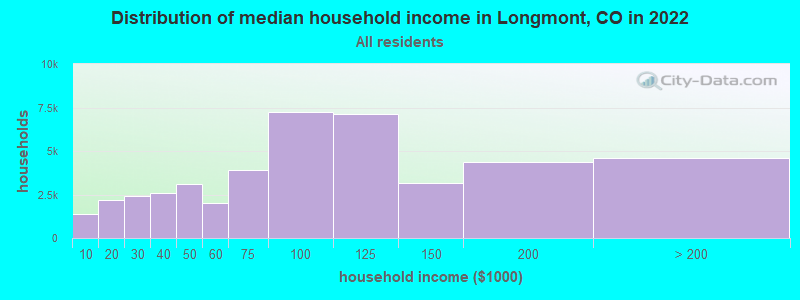
Median household income for houses/condos with a mortgage: $115,686
Median household income for apartments without a mortgage: $92,491
12,403 married couples with children.
5,524 single-parent households (933 men, 4,591 women).
82.2% of residents of Longmont speak English at home.
13.4% of residents speak Spanish at home (72% speak English very well, 16% speak English well, 8% speak English not well, 3% don't speak English at all).
2.8% of residents speak other Indo-European language at home (80% speak English very well, 14% speak English well, 6% speak English not well).
1.5% of residents speak Asian or Pacific Island language at home (60% speak English very well, 26% speak English well, 13% speak English not well).
0.4% of residents speak other language at home (67% speak English very well, 28% speak English well, 5% don't speak English at all).
Foreign born population: 9,264 (9.2%)
(48.3% of them are naturalized citizens)
Percentage of workers working in this county: 86.3% Number of people working at home: 12,063 (22.5% of all workers)
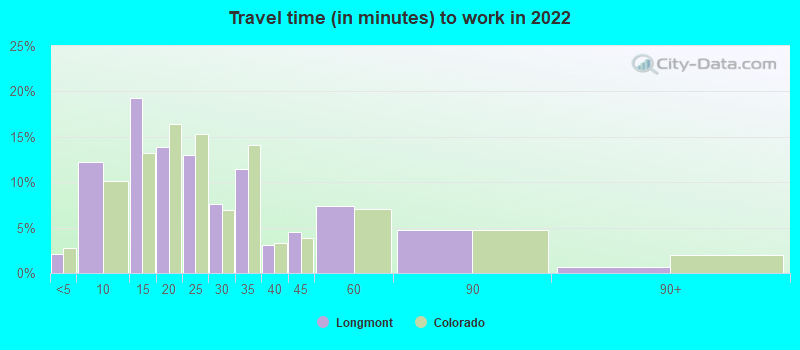
Travel time to work (commute)
Less than 5 minutes: 587
5 to 9 minutes: 4,644
10 to 14 minutes: 8,327
15 to 19 minutes: 5,936
20 to 24 minutes: 4,364
25 to 29 minutes: 3,097
30 to 34 minutes: 5,713
35 to 39 minutes: 1,155
40 to 44 minutes: 1,175
45 to 59 minutes: 2,894
60 to 89 minutes: 2,741
90 or more minutes: 425
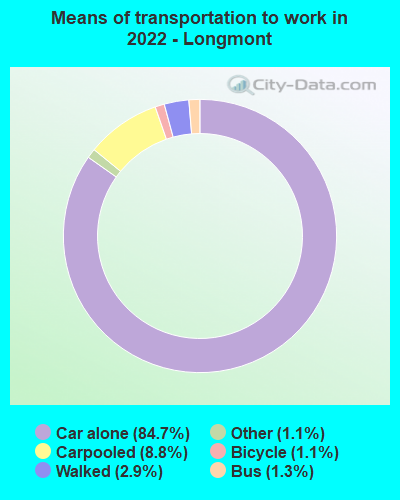
Means of transportation to work:
Drove a car alone: 31,233 (62.3%)
Carpooled: 3,695 (7.4%)
Bus: 483 (1.0%)
Taxi: 627 (1.3%)
Bicycle: 482 (1.0%)
Walked: 1,197 (2.4%)
Worked at home: 12,063 (24.1%)
Unemployment by race in 2022
Unemployment rate for White non-Hispanic residents
0.8%Males
4.9%Females
Unemployment rate for Black residents
0.4%Males
9.3%Females
Unemployment rate for American Indian and Alaska Native residents
7.4%Males
Unemployment rate for Asian residents
1.6%Males
2.4%Females
Unemployment rate for other race residents
6.1%Males
2.5%Females
Unemployment rate for two or more race residents
7.5%Males
5.1%Females
Unemployment rate for Hispanic or Latino residents
5.2%Males
0.9%Females
Year of entry for the foreign-born population in Longmont, Colorado
2,0102010 or later
2,0742000 to 2009
2,9821990 to 1999
1,6661980 to 1989
7361970 to 1979
695Before 1970
First ancestries reported:
German: 4,792 (12.1%)
English: 4,755 (12.0%)
Irish: 2,765 (7.0%)
American: 2,616 (6.6%)
European: 1,704 (4.3%)
Italian: 1,141 (2.9%)
Polish: 585 (1.5%)
Scottish: 583 (1.5%)
Norwegian: 574 (1.4%)
Scotch-Irish: 470 (1.2%)
French: 460 (1.2%)
Swedish: 445 (1.1%)
British: 378 (1.0%)
Dutch: 316 (0.8%)
Ukrainian: 302 (0.8%)
Russian: 262 (0.7%)
Eastern European: 246 (0.6%)
Danish: 221 (0.6%)
French Canadian: 216 (0.5%)
Ethiopian: 206 (0.5%)
Scandinavian: 192 (0.5%)
Swiss: 166 (0.4%)
Welsh: 126 (0.3%)
Greek: 124 (0.3%)
African: 118 (0.3%)
Czech: 98 (0.2%)
Moroccan: 91 (0.2%)
Northern European: 89 (0.2%)
Hungarian: 85 (0.2%)
Canadian: 76 (0.2%)
Yugoslavian: 67 (0.2%)
Celtic: 63 (0.2%)
Austrian: 56 (0.1%)
Lithuanian: 55 (0.1%)
Slovak: 54 (0.1%)
Bulgarian: 42 (0.1%)
Iranian: 38 (0.10%)
Romanian: 32 (0.08%)
Lebanese: 28 (0.07%)
Basque: 27 (0.07%)
Pennsylvania German: 26 (0.07%)
Jamaican: 26 (0.07%)
Portuguese: 24 (0.06%)
Brazilian: 24 (0.06%)
Belgian: 24 (0.06%)
Czechoslovakian: 21 (0.05%)
Turkish: 17 (0.04%)
Finnish: 15 (0.04%)
Alsatian: 13 (0.03%)
Croatian: 9 (0.02%)
Armenian: 9 (0.02%)
Maltese: 7 (0.02%)
Cajun: 2 (0.01%)
Most common places of birth for foreign-born residents (%):
Mexico
Longmont:
43.8% (4,270)
Colorado:
38.3% (209,491)
Ukraine
Longmont:
4.8% (472)
Colorado:
0.8% (4,267)
China, excluding Hong Kong and Taiwan
Longmont:
3.9% (380)
Colorado:
3.3% (17,998)
Canada
Longmont:
3.6% (354)
Colorado:
2.7% (15,026)
Germany
Longmont:
2.7% (260)
Colorado:
2.5% (13,706)
Korea
Longmont:
2.7% (260)
Colorado:
2.9% (15,981)
Peru
Longmont:
2.4% (231)
Colorado:
0.9% (4,810)
Colombia
Longmont:
2.0% (194)
Colorado:
1.1% (5,971)
India
Longmont:
2.0% (192)
Colorado:
4.0% (21,689)
Vietnam
Longmont:
1.9% (183)
Colorado:
3.0% (16,616)
Guatemala
Longmont:
1.9% (182)
Colorado:
1.4% (7,898)
Russia
Longmont:
1.8% (172)
Colorado:
1.4% (7,860)
Nepal
Longmont:
1.7% (170)
Colorado:
1.0% (5,214)
Ethiopia
Longmont:
1.7% (168)
Colorado:
1.9% (10,372)
Spain
Longmont:
1.7% (161)
Colorado:
0.3% (1,788)
United Kingdom, excluding England and Scotland
Longmont:
1.6% (153)
Colorado:
1.1% (5,799)
England
Longmont:
1.5% (150)
Colorado:
1.2% (6,672)
Place of birth for U.S.-born residents:
This state: 33,774
Other state: 54,971
Northeast: 10,508
Midwest: 17,731
South: 12,207
West: 14,525
80.6% of Longmont residents lived in the same house 1 years ago. Out of people who lived in different houses, 24.6% lived in this county. Out of people who lived in different counties, 54.2% lived in Colorado.
Longmont:
80.6%
State average:
83.6%
Education attainment for males 25 years and older:
No schooling: 1,094
Nursery to 4th grade: 0
5th and 6th grade: 0
7th and 8th grade: 0
9th grade: 299
10th grade: 325
11th grade: 192
12th grade, no diploma: 594
High school graduate (or equivalency): 6,043
Less than 1 year of college: 2,824
Some college more than 1 year, no degree: 5,785
Associate degree: 3,078
Bachelor's degree: 9,680
Master's degree: 3,127
Professional school degree: 860
Doctorate degree: 1,451
Education attainment for females 25 years and older:
No schooling: 603
Nursery to 4th grade: 0
5th and 6th grade: 126
7th and 8th grade: 121
9th grade: 473
10th grade: 409
11th grade: 229
12th grade, no diploma: 118
High school graduate (or equivalency): 6,840
Less than 1 year of college: 2,677
Some college more than 1 year, no degree: 4,442
Associate degree: 3,102
Bachelor's degree: 12,296
Master's degree: 4,574
Professional school degree: 503
Doctorate degree: 834
Housing units in structures:
One, detached: 25,346
One, attached: 4,676
Two: 417
3 or 4: 704
5 to 9: 2,517
10 to 19: 5,795
20 to 49: 1,114
50 or more: 3,022
Mobile homes: 808
Median worth of mobile homes: $65,400
Housing units lacking complete plumbing facilities in 2022: 0.1%
Housing units lacking complete kitchen facilities in 2022: 0.8%
House/condo owner moved in on average 10 years ago